Offshore Wind Construction Vessel Market Market Dynamics: Drivers and Barriers to Growth 2025-2033

Offshore Wind Construction Vessel Market by Type (Self-propelled Jack-up Vessel, Normal Jack-up Vessel, Heavy Lift Vessel), by North America (United States, Canada, Rest of North America), by Europe (Germany, France, United Kingdom, Italy, Spain, NORDIC, Russia, Turkey, Rest of Europe), by Asia Pacific (China, India, Australia, Japan, South Korea, Malaysia, Thailand, Indonesia, Vietnam, Rest of Asia Pacific), by Middle East and Africa (Saudi Arabia, United Arab Emirates, Nigeria, Egypt, Qatar, South Africa, Rest of Middle East and Africa), by South America (Brazil, Argentina, Colombia, Rest of South America) Forecast 2025-2033

Jul 1 2025
Base Year: 2024

234 Pages
Main Logo

Offshore Wind Construction Vessel Market Market Dynamics: Drivers and Barriers to Growth 2025-2033


Home
Industries
Energy & Power
sponsor image
sponsor image
sponsor image
sponsor image
sponsor image

Tailored for you

  • In-depth Analysis Tailored to Specified Regions or Segments
  • Company Profiles Customized to User Preferences
  • Comprehensive Insights Focused on Specific Segments or Regions
  • Customized Evaluation of Competitive Landscape to Meet Your Needs
  • Tailored Customization to Address Other Specific Requirements
Ask for customization


Key Insights

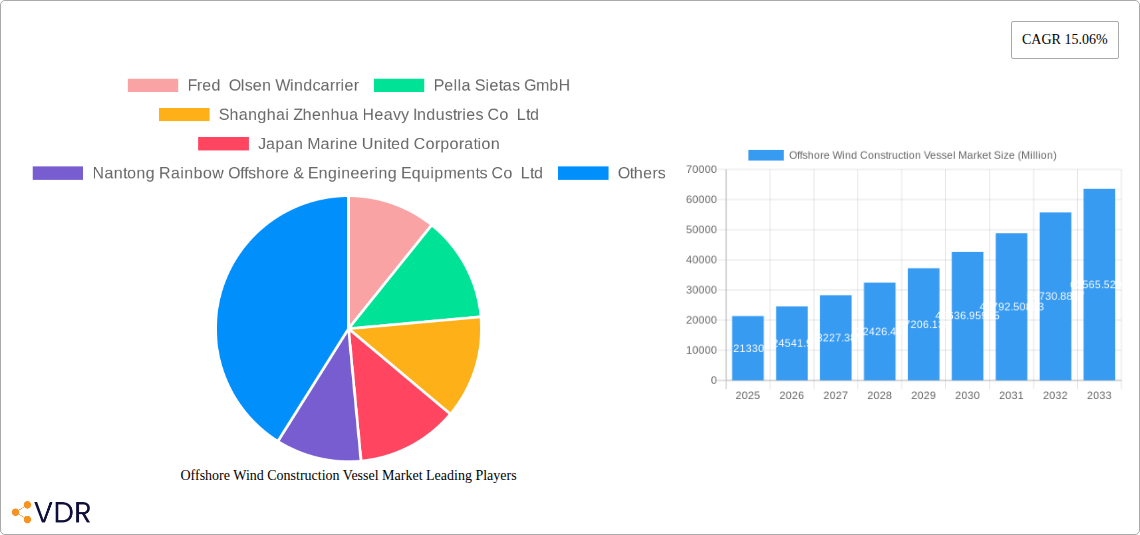
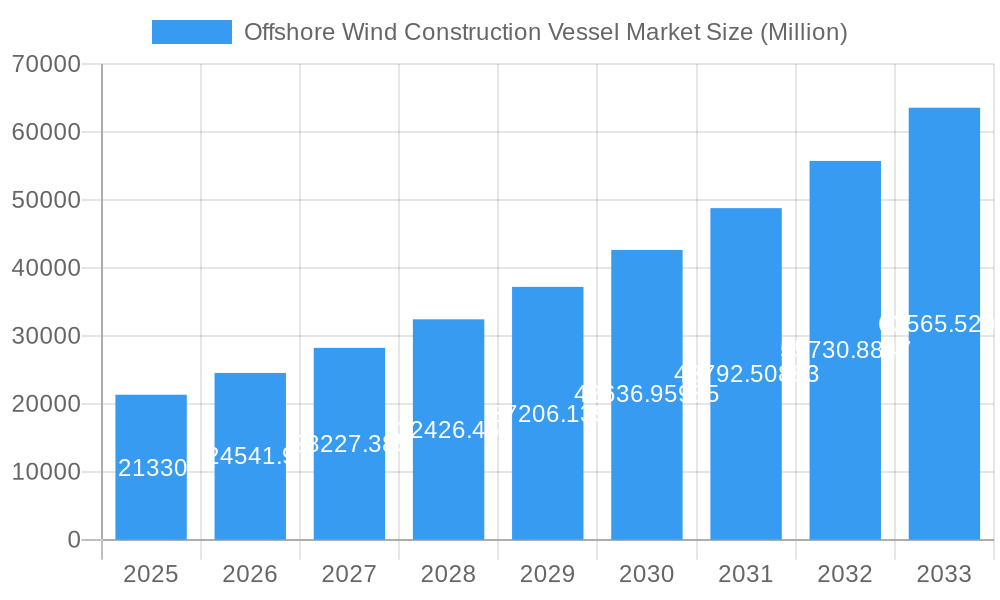
The Offshore Wind Construction Vessel market is experiencing robust growth, projected to reach a market size of $21.33 billion in 2025, exhibiting a Compound Annual Growth Rate (CAGR) of 15.06% from 2019 to 2033. This expansion is driven by the surging global demand for renewable energy, particularly offshore wind power. Governments worldwide are implementing supportive policies and incentives to accelerate the transition to cleaner energy sources, fueling substantial investments in offshore wind farm construction. Technological advancements in vessel design, including the development of more efficient and powerful jack-up vessels and heavy-lift vessels, are also contributing to market growth. Furthermore, the increasing size and complexity of offshore wind farms necessitate specialized vessels capable of handling larger turbines and heavier components, creating a strong demand for advanced construction vessels. Competition among key players like Fred Olsen Windcarrier, Pella Sietas GmbH, and COSCO SHIPPING Heavy Transport Inc., is driving innovation and efficiency gains within the industry.

The market is segmented into Self-propelled Jack-up Vessels, Normal Jack-up Vessels, and Heavy Lift Vessels, each catering to specific needs within the offshore wind construction process. Geographical distribution reveals strong growth across North America, Europe, and Asia-Pacific, reflecting the significant offshore wind energy projects underway in these regions. While the market faces challenges such as fluctuating commodity prices and potential supply chain disruptions, the long-term outlook remains positive, supported by the ever-increasing commitment to renewable energy targets and the ongoing development of larger, more efficient offshore wind farms. The market's robust growth trajectory is expected to continue throughout the forecast period (2025-2033), driven by a confluence of factors including policy support, technological advancements, and the ever-growing need for clean energy solutions.

Offshore Wind Construction Vessel Market Research Report - Market Size, Growth & Forecast

Offshore Wind Construction Vessel Market: A Comprehensive Market Report (2019-2033)

This in-depth report provides a comprehensive analysis of the Offshore Wind Construction Vessel Market, encompassing market dynamics, growth trends, regional analysis, and key player profiles. The report covers the parent market of marine construction and the child market of offshore wind energy infrastructure development, offering valuable insights for industry professionals, investors, and stakeholders. The study period spans 2019-2033, with 2025 as the base and estimated year. The market size is presented in million USD.

Offshore Wind Construction Vessel Market Dynamics & Structure

The offshore wind construction vessel market is characterized by moderate concentration, with key players like Fred Olsen Windcarrier, Pella Sietas GmbH, and Shanghai Zhenhua Heavy Industries Co Ltd holding significant market share (xx%). Technological innovation, driven by the need for larger, more efficient vessels to handle increasingly powerful wind turbines, is a major growth driver. Stringent regulatory frameworks concerning safety, emissions, and environmental impact shape market dynamics. The market also faces competition from alternative technologies for offshore wind installation, albeit limited currently. Consolidation through mergers and acquisitions (M&A) is expected to continue, with xx M&A deals projected between 2025 and 2033.

  • Market Concentration: Moderately concentrated, with top 5 players holding xx% market share.
  • Technological Innovation: Focus on larger capacity vessels, automation, and environmentally friendly propulsion systems.
  • Regulatory Landscape: Stringent safety and environmental regulations influence vessel design and operation.
  • Competitive Substitutes: Limited direct substitutes, but competition exists from alternative installation methods.
  • End-User Demographics: Primarily offshore wind farm developers and contractors.
  • M&A Activity: Projected xx M&A deals in the forecast period (2025-2033).

Offshore Wind Construction Vessel Market Growth Trends & Insights

The global offshore wind construction vessel market is experiencing robust growth, driven by the burgeoning offshore wind energy sector. The market size reached xx million USD in 2024 and is projected to reach xx million USD by 2033, exhibiting a CAGR of xx% during the forecast period (2025-2033). This growth is fueled by increasing global demand for renewable energy, supportive government policies, and technological advancements leading to larger, more efficient wind turbines and the associated need for specialized vessels for their installation and maintenance. Market penetration is expected to increase from xx% in 2024 to xx% by 2033. Technological disruptions, such as the adoption of dual-fuel methanol propulsion systems and enhanced dynamic positioning systems, are further contributing to market expansion. Consumer behavior, largely driven by sustainability concerns and the cost-effectiveness of offshore wind power, positively influences the market's growth trajectory.

Offshore Wind Construction Vessel Market Growth

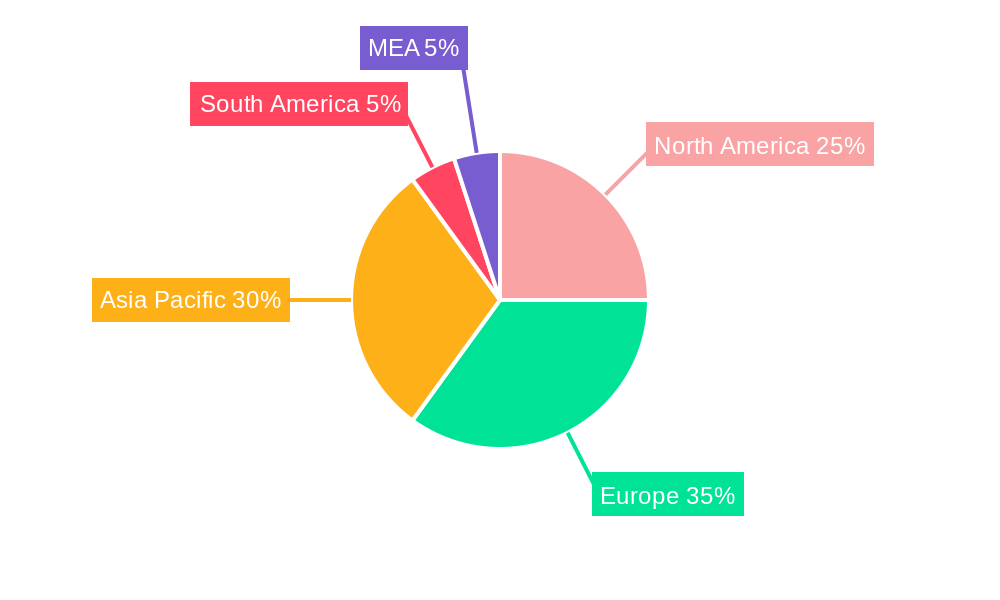
Dominant Regions, Countries, or Segments in Offshore Wind Construction Vessel Market

Europe, particularly Northern Europe (including countries like the UK, Germany, and Denmark), currently dominates the offshore wind construction vessel market due to the significant investments in offshore wind farms and mature wind energy infrastructure in the region. Within the vessel types, the demand for self-propelled jack-up vessels is highest owing to their versatility and efficiency in various water depths.

  • Key Drivers (Europe):
    • Extensive offshore wind farm development.
    • Supportive government policies and incentives.
    • Well-established infrastructure and supply chain.
  • Dominant Segment: Self-propelled Jack-up Vessels, commanding a xx% market share, due to their versatility and suitability for various water depths and wind turbine sizes. This is followed by Heavy Lift Vessels at xx% and Normal Jack-up Vessels at xx%.

The Asia-Pacific region is poised for significant growth, driven by substantial planned investments in offshore wind capacity. North America shows promising growth potential, particularly with the recent launch of Jones Act-compliant vessels like Charybdis.

Offshore Wind Construction Vessel Market Product Landscape

The offshore wind construction vessel market showcases innovation in vessel design, including larger crane capacities, improved dynamic positioning systems, and environmentally friendly propulsion systems. Self-propelled jack-up vessels are evolving with enhanced sea-keeping capabilities and increased operational efficiency. Heavy lift vessels are designed to handle the increasingly large wind turbine components, while normal jack-up vessels cater to specific project requirements and water depths. Unique selling propositions include reduced emissions, increased operational uptime, and optimized installation processes.

Key Drivers, Barriers & Challenges in Offshore Wind Construction Vessel Market

Key Drivers:

  • Growing global demand for renewable energy.
  • Government incentives and supportive policies promoting offshore wind energy.
  • Technological advancements leading to larger and more powerful wind turbines.

Challenges and Restraints:

  • High initial investment costs for vessel construction.
  • Dependence on the broader offshore wind industry's growth trajectory.
  • Potential supply chain bottlenecks for specialized equipment and skilled labor. This impacts vessel construction timelines and overall project execution.
  • Stringent regulatory compliance requirements that increase operational complexities and costs.
  • Competition from alternative installation methods could impact market growth, especially in the long term. While limited currently, this remains a potential threat.

Emerging Opportunities in Offshore Wind Construction Vessel Market

  • Expansion into emerging markets with significant offshore wind potential (e.g., Asia-Pacific).
  • Development of specialized vessels for floating offshore wind turbine installation.
  • Adoption of innovative technologies like autonomous systems and AI-powered operations to improve efficiency and safety.
  • Increasing demand for vessels with dual-fuel or alternative fuel propulsion systems to reduce environmental impact.

Growth Accelerators in the Offshore Wind Construction Vessel Market Industry

The long-term growth of the offshore wind construction vessel market is strongly linked to the continuous expansion of the offshore wind energy sector globally. Technological breakthroughs like the development of more efficient and sustainable vessel designs and the improvement of installation techniques are key drivers. Strategic partnerships between vessel owners, wind farm developers, and turbine manufacturers are essential to ensure smooth project execution and optimized vessel utilization. Market expansion into new geographical areas with vast offshore wind resources and supportive regulatory environments will further propel market growth.

Key Players Shaping the Offshore Wind Construction Vessel Market Market

  • Fred Olsen Windcarrier
  • Pella Sietas GmbH
  • Shanghai Zhenhua Heavy Industries Co Ltd
  • Japan Marine United Corporation
  • Nantong Rainbow Offshore & Engineering Equipments Co Ltd
  • COSCO SHIPPING Heavy Transport Inc
  • Xiamen Shipbuilding Industry Co Ltd
  • Lamprell Energy Ltd
  • Deme Group
  • Seafox

Notable Milestones in Offshore Wind Construction Vessel Sector

  • April 2024: Dominion Energy successfully launched Charybdis, the first Jones Act-compliant offshore wind turbine construction vessel in the US.
  • February 2024: ABS approved in principle a design for a dual-fuel methanol-powered heavy-duty offshore wind turbine construction vessel by Yantai CIMC Raffles Offshore Ltd.

In-Depth Offshore Wind Construction Vessel Market Outlook

The future of the offshore wind construction vessel market looks bright, driven by the accelerating global transition to renewable energy. The ongoing expansion of offshore wind farms, coupled with technological innovations and strategic partnerships, creates substantial opportunities for growth. The focus on sustainability and efficiency will continue to shape vessel design and operations, presenting opportunities for companies that prioritize environmental responsibility and technological advancements. The market is expected to witness continued consolidation through mergers and acquisitions, leading to a more concentrated but technologically advanced sector.

Offshore Wind Construction Vessel Market Segmentation

  • 1. Type
    • 1.1. Self-propelled Jack-up Vessel
    • 1.2. Normal Jack-up Vessel
    • 1.3. Heavy Lift Vessel

Offshore Wind Construction Vessel Market Segmentation By Geography

  • 1. North America
    • 1.1. United States
    • 1.2. Canada
    • 1.3. Rest of North America
  • 2. Europe
    • 2.1. Germany
    • 2.2. France
    • 2.3. United Kingdom
    • 2.4. Italy
    • 2.5. Spain
    • 2.6. NORDIC
    • 2.7. Russia
    • 2.8. Turkey
    • 2.9. Rest of Europe
  • 3. Asia Pacific
    • 3.1. China
    • 3.2. India
    • 3.3. Australia
    • 3.4. Japan
    • 3.5. South Korea
    • 3.6. Malaysia
    • 3.7. Thailand
    • 3.8. Indonesia
    • 3.9. Vietnam
    • 3.10. Rest of Asia Pacific
  • 4. Middle East and Africa
    • 4.1. Saudi Arabia
    • 4.2. United Arab Emirates
    • 4.3. Nigeria
    • 4.4. Egypt
    • 4.5. Qatar
    • 4.6. South Africa
    • 4.7. Rest of Middle East and Africa
  • 5. South America
    • 5.1. Brazil
    • 5.2. Argentina
    • 5.3. Colombia
    • 5.4. Rest of South America
Offshore Wind Construction Vessel Market Regional Share


Offshore Wind Construction Vessel Market REPORT HIGHLIGHTS

AspectsDetails
Study Period 2019-2033
Base Year 2024
Estimated Year 2025
Forecast Period2025-2033
Historical Period2019-2024
Growth RateCAGR of 15.06% from 2019-2033
Segmentation
    • By Type
      • Self-propelled Jack-up Vessel
      • Normal Jack-up Vessel
      • Heavy Lift Vessel
  • By Geography
    • North America
      • United States
      • Canada
      • Rest of North America
    • Europe
      • Germany
      • France
      • United Kingdom
      • Italy
      • Spain
      • NORDIC
      • Russia
      • Turkey
      • Rest of Europe
    • Asia Pacific
      • China
      • India
      • Australia
      • Japan
      • South Korea
      • Malaysia
      • Thailand
      • Indonesia
      • Vietnam
      • Rest of Asia Pacific
    • Middle East and Africa
      • Saudi Arabia
      • United Arab Emirates
      • Nigeria
      • Egypt
      • Qatar
      • South Africa
      • Rest of Middle East and Africa
    • South America
      • Brazil
      • Argentina
      • Colombia
      • Rest of South America


Table of Contents

  1. 1. Introduction
    • 1.1. Research Scope
    • 1.2. Market Segmentation
    • 1.3. Research Methodology
    • 1.4. Definitions and Assumptions
  2. 2. Executive Summary
    • 2.1. Introduction
  3. 3. Market Dynamics
    • 3.1. Introduction
      • 3.2. Market Drivers
        • 3.2.1. Increasing Offshore Wind Energy Installation4.; Growing Imperative Toward Renewable Energy
      • 3.3. Market Restrains
        • 3.3.1. High Initial Capital Investment
      • 3.4. Market Trends
        • 3.4.1. Normal Jack-Up Vessels Expected to Witness Growth
  4. 4. Market Factor Analysis
    • 4.1. Porters Five Forces
    • 4.2. Supply/Value Chain
    • 4.3. PESTEL analysis
    • 4.4. Market Entropy
    • 4.5. Patent/Trademark Analysis
  5. 5. Global Offshore Wind Construction Vessel Market Analysis, Insights and Forecast, 2019-2031
    • 5.1. Market Analysis, Insights and Forecast - by Type
      • 5.1.1. Self-propelled Jack-up Vessel
      • 5.1.2. Normal Jack-up Vessel
      • 5.1.3. Heavy Lift Vessel
    • 5.2. Market Analysis, Insights and Forecast - by Region
      • 5.2.1. North America
      • 5.2.2. Europe
      • 5.2.3. Asia Pacific
      • 5.2.4. Middle East and Africa
      • 5.2.5. South America
  6. 6. North America Offshore Wind Construction Vessel Market Analysis, Insights and Forecast, 2019-2031
    • 6.1. Market Analysis, Insights and Forecast - by Type
      • 6.1.1. Self-propelled Jack-up Vessel
      • 6.1.2. Normal Jack-up Vessel
      • 6.1.3. Heavy Lift Vessel
  7. 7. Europe Offshore Wind Construction Vessel Market Analysis, Insights and Forecast, 2019-2031
    • 7.1. Market Analysis, Insights and Forecast - by Type
      • 7.1.1. Self-propelled Jack-up Vessel
      • 7.1.2. Normal Jack-up Vessel
      • 7.1.3. Heavy Lift Vessel
  8. 8. Asia Pacific Offshore Wind Construction Vessel Market Analysis, Insights and Forecast, 2019-2031
    • 8.1. Market Analysis, Insights and Forecast - by Type
      • 8.1.1. Self-propelled Jack-up Vessel
      • 8.1.2. Normal Jack-up Vessel
      • 8.1.3. Heavy Lift Vessel
  9. 9. Middle East and Africa Offshore Wind Construction Vessel Market Analysis, Insights and Forecast, 2019-2031
    • 9.1. Market Analysis, Insights and Forecast - by Type
      • 9.1.1. Self-propelled Jack-up Vessel
      • 9.1.2. Normal Jack-up Vessel
      • 9.1.3. Heavy Lift Vessel
  10. 10. South America Offshore Wind Construction Vessel Market Analysis, Insights and Forecast, 2019-2031
    • 10.1. Market Analysis, Insights and Forecast - by Type
      • 10.1.1. Self-propelled Jack-up Vessel
      • 10.1.2. Normal Jack-up Vessel
      • 10.1.3. Heavy Lift Vessel
  11. 11. North America Offshore Wind Construction Vessel Market Analysis, Insights and Forecast, 2019-2031
      • 11.1. Market Analysis, Insights and Forecast - By Country/Sub-region
        • 11.1.1 United States
        • 11.1.2 Canada
        • 11.1.3 Mexico
  12. 12. Europe Offshore Wind Construction Vessel Market Analysis, Insights and Forecast, 2019-2031
      • 12.1. Market Analysis, Insights and Forecast - By Country/Sub-region
        • 12.1.1 Germany
        • 12.1.2 United Kingdom
        • 12.1.3 France
        • 12.1.4 Spain
        • 12.1.5 Italy
        • 12.1.6 Spain
        • 12.1.7 Belgium
        • 12.1.8 Netherland
        • 12.1.9 Nordics
        • 12.1.10 Rest of Europe
  13. 13. Asia Pacific Offshore Wind Construction Vessel Market Analysis, Insights and Forecast, 2019-2031
      • 13.1. Market Analysis, Insights and Forecast - By Country/Sub-region
        • 13.1.1 China
        • 13.1.2 Japan
        • 13.1.3 India
        • 13.1.4 South Korea
        • 13.1.5 Southeast Asia
        • 13.1.6 Australia
        • 13.1.7 Indonesia
        • 13.1.8 Phillipes
        • 13.1.9 Singapore
        • 13.1.10 Thailandc
        • 13.1.11 Rest of Asia Pacific
  14. 14. South America Offshore Wind Construction Vessel Market Analysis, Insights and Forecast, 2019-2031
      • 14.1. Market Analysis, Insights and Forecast - By Country/Sub-region
        • 14.1.1 Brazil
        • 14.1.2 Argentina
        • 14.1.3 Peru
        • 14.1.4 Chile
        • 14.1.5 Colombia
        • 14.1.6 Ecuador
        • 14.1.7 Venezuela
        • 14.1.8 Rest of South America
  15. 15. MEA Offshore Wind Construction Vessel Market Analysis, Insights and Forecast, 2019-2031
      • 15.1. Market Analysis, Insights and Forecast - By Country/Sub-region
        • 15.1.1 United Arab Emirates
        • 15.1.2 Saudi Arabia
        • 15.1.3 South Africa
        • 15.1.4 Rest of Middle East and Africa
  16. 16. Competitive Analysis
    • 16.1. Global Market Share Analysis 2024
      • 16.2. Company Profiles
        • 16.2.1 Fred Olsen Windcarrier
          • 16.2.1.1. Overview
          • 16.2.1.2. Products
          • 16.2.1.3. SWOT Analysis
          • 16.2.1.4. Recent Developments
          • 16.2.1.5. Financials (Based on Availability)
        • 16.2.2 Pella Sietas GmbH
          • 16.2.2.1. Overview
          • 16.2.2.2. Products
          • 16.2.2.3. SWOT Analysis
          • 16.2.2.4. Recent Developments
          • 16.2.2.5. Financials (Based on Availability)
        • 16.2.3 Shanghai Zhenhua Heavy Industries Co Ltd
          • 16.2.3.1. Overview
          • 16.2.3.2. Products
          • 16.2.3.3. SWOT Analysis
          • 16.2.3.4. Recent Developments
          • 16.2.3.5. Financials (Based on Availability)
        • 16.2.4 Japan Marine United Corporation
          • 16.2.4.1. Overview
          • 16.2.4.2. Products
          • 16.2.4.3. SWOT Analysis
          • 16.2.4.4. Recent Developments
          • 16.2.4.5. Financials (Based on Availability)
        • 16.2.5 Nantong Rainbow Offshore & Engineering Equipments Co Ltd
          • 16.2.5.1. Overview
          • 16.2.5.2. Products
          • 16.2.5.3. SWOT Analysis
          • 16.2.5.4. Recent Developments
          • 16.2.5.5. Financials (Based on Availability)
        • 16.2.6 COSCO SHIPPING Heavy Transport Inc
          • 16.2.6.1. Overview
          • 16.2.6.2. Products
          • 16.2.6.3. SWOT Analysis
          • 16.2.6.4. Recent Developments
          • 16.2.6.5. Financials (Based on Availability)
        • 16.2.7 Xiamen Shipbuilding Industry Co Ltd
          • 16.2.7.1. Overview
          • 16.2.7.2. Products
          • 16.2.7.3. SWOT Analysis
          • 16.2.7.4. Recent Developments
          • 16.2.7.5. Financials (Based on Availability)
        • 16.2.8 Lamprell Energy Ltd
          • 16.2.8.1. Overview
          • 16.2.8.2. Products
          • 16.2.8.3. SWOT Analysis
          • 16.2.8.4. Recent Developments
          • 16.2.8.5. Financials (Based on Availability)
        • 16.2.9 Deme Group
          • 16.2.9.1. Overview
          • 16.2.9.2. Products
          • 16.2.9.3. SWOT Analysis
          • 16.2.9.4. Recent Developments
          • 16.2.9.5. Financials (Based on Availability)
        • 16.2.10 Seafox
          • 16.2.10.1. Overview
          • 16.2.10.2. Products
          • 16.2.10.3. SWOT Analysis
          • 16.2.10.4. Recent Developments
          • 16.2.10.5. Financials (Based on Availability)

List of Figures

  1. Figure 1: Global Offshore Wind Construction Vessel Market Revenue Breakdown (Million, %) by Region 2024 & 2032
  2. Figure 2: Global Offshore Wind Construction Vessel Market Volume Breakdown (K Unit, %) by Region 2024 & 2032
  3. Figure 3: North America Offshore Wind Construction Vessel Market Revenue (Million), by Country 2024 & 2032
  4. Figure 4: North America Offshore Wind Construction Vessel Market Volume (K Unit), by Country 2024 & 2032
  5. Figure 5: North America Offshore Wind Construction Vessel Market Revenue Share (%), by Country 2024 & 2032
  6. Figure 6: North America Offshore Wind Construction Vessel Market Volume Share (%), by Country 2024 & 2032
  7. Figure 7: Europe Offshore Wind Construction Vessel Market Revenue (Million), by Country 2024 & 2032
  8. Figure 8: Europe Offshore Wind Construction Vessel Market Volume (K Unit), by Country 2024 & 2032
  9. Figure 9: Europe Offshore Wind Construction Vessel Market Revenue Share (%), by Country 2024 & 2032
  10. Figure 10: Europe Offshore Wind Construction Vessel Market Volume Share (%), by Country 2024 & 2032
  11. Figure 11: Asia Pacific Offshore Wind Construction Vessel Market Revenue (Million), by Country 2024 & 2032
  12. Figure 12: Asia Pacific Offshore Wind Construction Vessel Market Volume (K Unit), by Country 2024 & 2032
  13. Figure 13: Asia Pacific Offshore Wind Construction Vessel Market Revenue Share (%), by Country 2024 & 2032
  14. Figure 14: Asia Pacific Offshore Wind Construction Vessel Market Volume Share (%), by Country 2024 & 2032
  15. Figure 15: South America Offshore Wind Construction Vessel Market Revenue (Million), by Country 2024 & 2032
  16. Figure 16: South America Offshore Wind Construction Vessel Market Volume (K Unit), by Country 2024 & 2032
  17. Figure 17: South America Offshore Wind Construction Vessel Market Revenue Share (%), by Country 2024 & 2032
  18. Figure 18: South America Offshore Wind Construction Vessel Market Volume Share (%), by Country 2024 & 2032
  19. Figure 19: MEA Offshore Wind Construction Vessel Market Revenue (Million), by Country 2024 & 2032
  20. Figure 20: MEA Offshore Wind Construction Vessel Market Volume (K Unit), by Country 2024 & 2032
  21. Figure 21: MEA Offshore Wind Construction Vessel Market Revenue Share (%), by Country 2024 & 2032
  22. Figure 22: MEA Offshore Wind Construction Vessel Market Volume Share (%), by Country 2024 & 2032
  23. Figure 23: North America Offshore Wind Construction Vessel Market Revenue (Million), by Type 2024 & 2032
  24. Figure 24: North America Offshore Wind Construction Vessel Market Volume (K Unit), by Type 2024 & 2032
  25. Figure 25: North America Offshore Wind Construction Vessel Market Revenue Share (%), by Type 2024 & 2032
  26. Figure 26: North America Offshore Wind Construction Vessel Market Volume Share (%), by Type 2024 & 2032
  27. Figure 27: North America Offshore Wind Construction Vessel Market Revenue (Million), by Country 2024 & 2032
  28. Figure 28: North America Offshore Wind Construction Vessel Market Volume (K Unit), by Country 2024 & 2032
  29. Figure 29: North America Offshore Wind Construction Vessel Market Revenue Share (%), by Country 2024 & 2032
  30. Figure 30: North America Offshore Wind Construction Vessel Market Volume Share (%), by Country 2024 & 2032
  31. Figure 31: Europe Offshore Wind Construction Vessel Market Revenue (Million), by Type 2024 & 2032
  32. Figure 32: Europe Offshore Wind Construction Vessel Market Volume (K Unit), by Type 2024 & 2032
  33. Figure 33: Europe Offshore Wind Construction Vessel Market Revenue Share (%), by Type 2024 & 2032
  34. Figure 34: Europe Offshore Wind Construction Vessel Market Volume Share (%), by Type 2024 & 2032
  35. Figure 35: Europe Offshore Wind Construction Vessel Market Revenue (Million), by Country 2024 & 2032
  36. Figure 36: Europe Offshore Wind Construction Vessel Market Volume (K Unit), by Country 2024 & 2032
  37. Figure 37: Europe Offshore Wind Construction Vessel Market Revenue Share (%), by Country 2024 & 2032
  38. Figure 38: Europe Offshore Wind Construction Vessel Market Volume Share (%), by Country 2024 & 2032
  39. Figure 39: Asia Pacific Offshore Wind Construction Vessel Market Revenue (Million), by Type 2024 & 2032
  40. Figure 40: Asia Pacific Offshore Wind Construction Vessel Market Volume (K Unit), by Type 2024 & 2032
  41. Figure 41: Asia Pacific Offshore Wind Construction Vessel Market Revenue Share (%), by Type 2024 & 2032
  42. Figure 42: Asia Pacific Offshore Wind Construction Vessel Market Volume Share (%), by Type 2024 & 2032
  43. Figure 43: Asia Pacific Offshore Wind Construction Vessel Market Revenue (Million), by Country 2024 & 2032
  44. Figure 44: Asia Pacific Offshore Wind Construction Vessel Market Volume (K Unit), by Country 2024 & 2032
  45. Figure 45: Asia Pacific Offshore Wind Construction Vessel Market Revenue Share (%), by Country 2024 & 2032
  46. Figure 46: Asia Pacific Offshore Wind Construction Vessel Market Volume Share (%), by Country 2024 & 2032
  47. Figure 47: Middle East and Africa Offshore Wind Construction Vessel Market Revenue (Million), by Type 2024 & 2032
  48. Figure 48: Middle East and Africa Offshore Wind Construction Vessel Market Volume (K Unit), by Type 2024 & 2032
  49. Figure 49: Middle East and Africa Offshore Wind Construction Vessel Market Revenue Share (%), by Type 2024 & 2032
  50. Figure 50: Middle East and Africa Offshore Wind Construction Vessel Market Volume Share (%), by Type 2024 & 2032
  51. Figure 51: Middle East and Africa Offshore Wind Construction Vessel Market Revenue (Million), by Country 2024 & 2032
  52. Figure 52: Middle East and Africa Offshore Wind Construction Vessel Market Volume (K Unit), by Country 2024 & 2032
  53. Figure 53: Middle East and Africa Offshore Wind Construction Vessel Market Revenue Share (%), by Country 2024 & 2032
  54. Figure 54: Middle East and Africa Offshore Wind Construction Vessel Market Volume Share (%), by Country 2024 & 2032
  55. Figure 55: South America Offshore Wind Construction Vessel Market Revenue (Million), by Type 2024 & 2032
  56. Figure 56: South America Offshore Wind Construction Vessel Market Volume (K Unit), by Type 2024 & 2032
  57. Figure 57: South America Offshore Wind Construction Vessel Market Revenue Share (%), by Type 2024 & 2032
  58. Figure 58: South America Offshore Wind Construction Vessel Market Volume Share (%), by Type 2024 & 2032
  59. Figure 59: South America Offshore Wind Construction Vessel Market Revenue (Million), by Country 2024 & 2032
  60. Figure 60: South America Offshore Wind Construction Vessel Market Volume (K Unit), by Country 2024 & 2032
  61. Figure 61: South America Offshore Wind Construction Vessel Market Revenue Share (%), by Country 2024 & 2032
  62. Figure 62: South America Offshore Wind Construction Vessel Market Volume Share (%), by Country 2024 & 2032

List of Tables

  1. Table 1: Global Offshore Wind Construction Vessel Market Revenue Million Forecast, by Region 2019 & 2032
  2. Table 2: Global Offshore Wind Construction Vessel Market Volume K Unit Forecast, by Region 2019 & 2032
  3. Table 3: Global Offshore Wind Construction Vessel Market Revenue Million Forecast, by Type 2019 & 2032
  4. Table 4: Global Offshore Wind Construction Vessel Market Volume K Unit Forecast, by Type 2019 & 2032
  5. Table 5: Global Offshore Wind Construction Vessel Market Revenue Million Forecast, by Region 2019 & 2032
  6. Table 6: Global Offshore Wind Construction Vessel Market Volume K Unit Forecast, by Region 2019 & 2032
  7. Table 7: Global Offshore Wind Construction Vessel Market Revenue Million Forecast, by Country 2019 & 2032
  8. Table 8: Global Offshore Wind Construction Vessel Market Volume K Unit Forecast, by Country 2019 & 2032
  9. Table 9: United States Offshore Wind Construction Vessel Market Revenue (Million) Forecast, by Application 2019 & 2032
  10. Table 10: United States Offshore Wind Construction Vessel Market Volume (K Unit) Forecast, by Application 2019 & 2032
  11. Table 11: Canada Offshore Wind Construction Vessel Market Revenue (Million) Forecast, by Application 2019 & 2032
  12. Table 12: Canada Offshore Wind Construction Vessel Market Volume (K Unit) Forecast, by Application 2019 & 2032
  13. Table 13: Mexico Offshore Wind Construction Vessel Market Revenue (Million) Forecast, by Application 2019 & 2032
  14. Table 14: Mexico Offshore Wind Construction Vessel Market Volume (K Unit) Forecast, by Application 2019 & 2032
  15. Table 15: Global Offshore Wind Construction Vessel Market Revenue Million Forecast, by Country 2019 & 2032
  16. Table 16: Global Offshore Wind Construction Vessel Market Volume K Unit Forecast, by Country 2019 & 2032
  17. Table 17: Germany Offshore Wind Construction Vessel Market Revenue (Million) Forecast, by Application 2019 & 2032
  18. Table 18: Germany Offshore Wind Construction Vessel Market Volume (K Unit) Forecast, by Application 2019 & 2032
  19. Table 19: United Kingdom Offshore Wind Construction Vessel Market Revenue (Million) Forecast, by Application 2019 & 2032
  20. Table 20: United Kingdom Offshore Wind Construction Vessel Market Volume (K Unit) Forecast, by Application 2019 & 2032
  21. Table 21: France Offshore Wind Construction Vessel Market Revenue (Million) Forecast, by Application 2019 & 2032
  22. Table 22: France Offshore Wind Construction Vessel Market Volume (K Unit) Forecast, by Application 2019 & 2032
  23. Table 23: Spain Offshore Wind Construction Vessel Market Revenue (Million) Forecast, by Application 2019 & 2032
  24. Table 24: Spain Offshore Wind Construction Vessel Market Volume (K Unit) Forecast, by Application 2019 & 2032
  25. Table 25: Italy Offshore Wind Construction Vessel Market Revenue (Million) Forecast, by Application 2019 & 2032
  26. Table 26: Italy Offshore Wind Construction Vessel Market Volume (K Unit) Forecast, by Application 2019 & 2032
  27. Table 27: Spain Offshore Wind Construction Vessel Market Revenue (Million) Forecast, by Application 2019 & 2032
  28. Table 28: Spain Offshore Wind Construction Vessel Market Volume (K Unit) Forecast, by Application 2019 & 2032
  29. Table 29: Belgium Offshore Wind Construction Vessel Market Revenue (Million) Forecast, by Application 2019 & 2032
  30. Table 30: Belgium Offshore Wind Construction Vessel Market Volume (K Unit) Forecast, by Application 2019 & 2032
  31. Table 31: Netherland Offshore Wind Construction Vessel Market Revenue (Million) Forecast, by Application 2019 & 2032
  32. Table 32: Netherland Offshore Wind Construction Vessel Market Volume (K Unit) Forecast, by Application 2019 & 2032
  33. Table 33: Nordics Offshore Wind Construction Vessel Market Revenue (Million) Forecast, by Application 2019 & 2032
  34. Table 34: Nordics Offshore Wind Construction Vessel Market Volume (K Unit) Forecast, by Application 2019 & 2032
  35. Table 35: Rest of Europe Offshore Wind Construction Vessel Market Revenue (Million) Forecast, by Application 2019 & 2032
  36. Table 36: Rest of Europe Offshore Wind Construction Vessel Market Volume (K Unit) Forecast, by Application 2019 & 2032
  37. Table 37: Global Offshore Wind Construction Vessel Market Revenue Million Forecast, by Country 2019 & 2032
  38. Table 38: Global Offshore Wind Construction Vessel Market Volume K Unit Forecast, by Country 2019 & 2032
  39. Table 39: China Offshore Wind Construction Vessel Market Revenue (Million) Forecast, by Application 2019 & 2032
  40. Table 40: China Offshore Wind Construction Vessel Market Volume (K Unit) Forecast, by Application 2019 & 2032
  41. Table 41: Japan Offshore Wind Construction Vessel Market Revenue (Million) Forecast, by Application 2019 & 2032
  42. Table 42: Japan Offshore Wind Construction Vessel Market Volume (K Unit) Forecast, by Application 2019 & 2032
  43. Table 43: India Offshore Wind Construction Vessel Market Revenue (Million) Forecast, by Application 2019 & 2032
  44. Table 44: India Offshore Wind Construction Vessel Market Volume (K Unit) Forecast, by Application 2019 & 2032
  45. Table 45: South Korea Offshore Wind Construction Vessel Market Revenue (Million) Forecast, by Application 2019 & 2032
  46. Table 46: South Korea Offshore Wind Construction Vessel Market Volume (K Unit) Forecast, by Application 2019 & 2032
  47. Table 47: Southeast Asia Offshore Wind Construction Vessel Market Revenue (Million) Forecast, by Application 2019 & 2032
  48. Table 48: Southeast Asia Offshore Wind Construction Vessel Market Volume (K Unit) Forecast, by Application 2019 & 2032
  49. Table 49: Australia Offshore Wind Construction Vessel Market Revenue (Million) Forecast, by Application 2019 & 2032
  50. Table 50: Australia Offshore Wind Construction Vessel Market Volume (K Unit) Forecast, by Application 2019 & 2032
  51. Table 51: Indonesia Offshore Wind Construction Vessel Market Revenue (Million) Forecast, by Application 2019 & 2032
  52. Table 52: Indonesia Offshore Wind Construction Vessel Market Volume (K Unit) Forecast, by Application 2019 & 2032
  53. Table 53: Phillipes Offshore Wind Construction Vessel Market Revenue (Million) Forecast, by Application 2019 & 2032
  54. Table 54: Phillipes Offshore Wind Construction Vessel Market Volume (K Unit) Forecast, by Application 2019 & 2032
  55. Table 55: Singapore Offshore Wind Construction Vessel Market Revenue (Million) Forecast, by Application 2019 & 2032
  56. Table 56: Singapore Offshore Wind Construction Vessel Market Volume (K Unit) Forecast, by Application 2019 & 2032
  57. Table 57: Thailandc Offshore Wind Construction Vessel Market Revenue (Million) Forecast, by Application 2019 & 2032
  58. Table 58: Thailandc Offshore Wind Construction Vessel Market Volume (K Unit) Forecast, by Application 2019 & 2032
  59. Table 59: Rest of Asia Pacific Offshore Wind Construction Vessel Market Revenue (Million) Forecast, by Application 2019 & 2032
  60. Table 60: Rest of Asia Pacific Offshore Wind Construction Vessel Market Volume (K Unit) Forecast, by Application 2019 & 2032
  61. Table 61: Global Offshore Wind Construction Vessel Market Revenue Million Forecast, by Country 2019 & 2032
  62. Table 62: Global Offshore Wind Construction Vessel Market Volume K Unit Forecast, by Country 2019 & 2032
  63. Table 63: Brazil Offshore Wind Construction Vessel Market Revenue (Million) Forecast, by Application 2019 & 2032
  64. Table 64: Brazil Offshore Wind Construction Vessel Market Volume (K Unit) Forecast, by Application 2019 & 2032
  65. Table 65: Argentina Offshore Wind Construction Vessel Market Revenue (Million) Forecast, by Application 2019 & 2032
  66. Table 66: Argentina Offshore Wind Construction Vessel Market Volume (K Unit) Forecast, by Application 2019 & 2032
  67. Table 67: Peru Offshore Wind Construction Vessel Market Revenue (Million) Forecast, by Application 2019 & 2032
  68. Table 68: Peru Offshore Wind Construction Vessel Market Volume (K Unit) Forecast, by Application 2019 & 2032
  69. Table 69: Chile Offshore Wind Construction Vessel Market Revenue (Million) Forecast, by Application 2019 & 2032
  70. Table 70: Chile Offshore Wind Construction Vessel Market Volume (K Unit) Forecast, by Application 2019 & 2032
  71. Table 71: Colombia Offshore Wind Construction Vessel Market Revenue (Million) Forecast, by Application 2019 & 2032
  72. Table 72: Colombia Offshore Wind Construction Vessel Market Volume (K Unit) Forecast, by Application 2019 & 2032
  73. Table 73: Ecuador Offshore Wind Construction Vessel Market Revenue (Million) Forecast, by Application 2019 & 2032
  74. Table 74: Ecuador Offshore Wind Construction Vessel Market Volume (K Unit) Forecast, by Application 2019 & 2032
  75. Table 75: Venezuela Offshore Wind Construction Vessel Market Revenue (Million) Forecast, by Application 2019 & 2032
  76. Table 76: Venezuela Offshore Wind Construction Vessel Market Volume (K Unit) Forecast, by Application 2019 & 2032
  77. Table 77: Rest of South America Offshore Wind Construction Vessel Market Revenue (Million) Forecast, by Application 2019 & 2032
  78. Table 78: Rest of South America Offshore Wind Construction Vessel Market Volume (K Unit) Forecast, by Application 2019 & 2032
  79. Table 79: Global Offshore Wind Construction Vessel Market Revenue Million Forecast, by Country 2019 & 2032
  80. Table 80: Global Offshore Wind Construction Vessel Market Volume K Unit Forecast, by Country 2019 & 2032
  81. Table 81: United Arab Emirates Offshore Wind Construction Vessel Market Revenue (Million) Forecast, by Application 2019 & 2032
  82. Table 82: United Arab Emirates Offshore Wind Construction Vessel Market Volume (K Unit) Forecast, by Application 2019 & 2032
  83. Table 83: Saudi Arabia Offshore Wind Construction Vessel Market Revenue (Million) Forecast, by Application 2019 & 2032
  84. Table 84: Saudi Arabia Offshore Wind Construction Vessel Market Volume (K Unit) Forecast, by Application 2019 & 2032
  85. Table 85: South Africa Offshore Wind Construction Vessel Market Revenue (Million) Forecast, by Application 2019 & 2032
  86. Table 86: South Africa Offshore Wind Construction Vessel Market Volume (K Unit) Forecast, by Application 2019 & 2032
  87. Table 87: Rest of Middle East and Africa Offshore Wind Construction Vessel Market Revenue (Million) Forecast, by Application 2019 & 2032
  88. Table 88: Rest of Middle East and Africa Offshore Wind Construction Vessel Market Volume (K Unit) Forecast, by Application 2019 & 2032
  89. Table 89: Global Offshore Wind Construction Vessel Market Revenue Million Forecast, by Type 2019 & 2032
  90. Table 90: Global Offshore Wind Construction Vessel Market Volume K Unit Forecast, by Type 2019 & 2032
  91. Table 91: Global Offshore Wind Construction Vessel Market Revenue Million Forecast, by Country 2019 & 2032
  92. Table 92: Global Offshore Wind Construction Vessel Market Volume K Unit Forecast, by Country 2019 & 2032
  93. Table 93: United States Offshore Wind Construction Vessel Market Revenue (Million) Forecast, by Application 2019 & 2032
  94. Table 94: United States Offshore Wind Construction Vessel Market Volume (K Unit) Forecast, by Application 2019 & 2032
  95. Table 95: Canada Offshore Wind Construction Vessel Market Revenue (Million) Forecast, by Application 2019 & 2032
  96. Table 96: Canada Offshore Wind Construction Vessel Market Volume (K Unit) Forecast, by Application 2019 & 2032
  97. Table 97: Rest of North America Offshore Wind Construction Vessel Market Revenue (Million) Forecast, by Application 2019 & 2032
  98. Table 98: Rest of North America Offshore Wind Construction Vessel Market Volume (K Unit) Forecast, by Application 2019 & 2032
  99. Table 99: Global Offshore Wind Construction Vessel Market Revenue Million Forecast, by Type 2019 & 2032
  100. Table 100: Global Offshore Wind Construction Vessel Market Volume K Unit Forecast, by Type 2019 & 2032
  101. Table 101: Global Offshore Wind Construction Vessel Market Revenue Million Forecast, by Country 2019 & 2032
  102. Table 102: Global Offshore Wind Construction Vessel Market Volume K Unit Forecast, by Country 2019 & 2032
  103. Table 103: Germany Offshore Wind Construction Vessel Market Revenue (Million) Forecast, by Application 2019 & 2032
  104. Table 104: Germany Offshore Wind Construction Vessel Market Volume (K Unit) Forecast, by Application 2019 & 2032
  105. Table 105: France Offshore Wind Construction Vessel Market Revenue (Million) Forecast, by Application 2019 & 2032
  106. Table 106: France Offshore Wind Construction Vessel Market Volume (K Unit) Forecast, by Application 2019 & 2032
  107. Table 107: United Kingdom Offshore Wind Construction Vessel Market Revenue (Million) Forecast, by Application 2019 & 2032
  108. Table 108: United Kingdom Offshore Wind Construction Vessel Market Volume (K Unit) Forecast, by Application 2019 & 2032
  109. Table 109: Italy Offshore Wind Construction Vessel Market Revenue (Million) Forecast, by Application 2019 & 2032
  110. Table 110: Italy Offshore Wind Construction Vessel Market Volume (K Unit) Forecast, by Application 2019 & 2032
  111. Table 111: Spain Offshore Wind Construction Vessel Market Revenue (Million) Forecast, by Application 2019 & 2032
  112. Table 112: Spain Offshore Wind Construction Vessel Market Volume (K Unit) Forecast, by Application 2019 & 2032
  113. Table 113: NORDIC Offshore Wind Construction Vessel Market Revenue (Million) Forecast, by Application 2019 & 2032
  114. Table 114: NORDIC Offshore Wind Construction Vessel Market Volume (K Unit) Forecast, by Application 2019 & 2032
  115. Table 115: Russia Offshore Wind Construction Vessel Market Revenue (Million) Forecast, by Application 2019 & 2032
  116. Table 116: Russia Offshore Wind Construction Vessel Market Volume (K Unit) Forecast, by Application 2019 & 2032
  117. Table 117: Turkey Offshore Wind Construction Vessel Market Revenue (Million) Forecast, by Application 2019 & 2032
  118. Table 118: Turkey Offshore Wind Construction Vessel Market Volume (K Unit) Forecast, by Application 2019 & 2032
  119. Table 119: Rest of Europe Offshore Wind Construction Vessel Market Revenue (Million) Forecast, by Application 2019 & 2032
  120. Table 120: Rest of Europe Offshore Wind Construction Vessel Market Volume (K Unit) Forecast, by Application 2019 & 2032
  121. Table 121: Global Offshore Wind Construction Vessel Market Revenue Million Forecast, by Type 2019 & 2032
  122. Table 122: Global Offshore Wind Construction Vessel Market Volume K Unit Forecast, by Type 2019 & 2032
  123. Table 123: Global Offshore Wind Construction Vessel Market Revenue Million Forecast, by Country 2019 & 2032
  124. Table 124: Global Offshore Wind Construction Vessel Market Volume K Unit Forecast, by Country 2019 & 2032
  125. Table 125: China Offshore Wind Construction Vessel Market Revenue (Million) Forecast, by Application 2019 & 2032
  126. Table 126: China Offshore Wind Construction Vessel Market Volume (K Unit) Forecast, by Application 2019 & 2032
  127. Table 127: India Offshore Wind Construction Vessel Market Revenue (Million) Forecast, by Application 2019 & 2032
  128. Table 128: India Offshore Wind Construction Vessel Market Volume (K Unit) Forecast, by Application 2019 & 2032
  129. Table 129: Australia Offshore Wind Construction Vessel Market Revenue (Million) Forecast, by Application 2019 & 2032
  130. Table 130: Australia Offshore Wind Construction Vessel Market Volume (K Unit) Forecast, by Application 2019 & 2032
  131. Table 131: Japan Offshore Wind Construction Vessel Market Revenue (Million) Forecast, by Application 2019 & 2032
  132. Table 132: Japan Offshore Wind Construction Vessel Market Volume (K Unit) Forecast, by Application 2019 & 2032
  133. Table 133: South Korea Offshore Wind Construction Vessel Market Revenue (Million) Forecast, by Application 2019 & 2032
  134. Table 134: South Korea Offshore Wind Construction Vessel Market Volume (K Unit) Forecast, by Application 2019 & 2032
  135. Table 135: Malaysia Offshore Wind Construction Vessel Market Revenue (Million) Forecast, by Application 2019 & 2032
  136. Table 136: Malaysia Offshore Wind Construction Vessel Market Volume (K Unit) Forecast, by Application 2019 & 2032
  137. Table 137: Thailand Offshore Wind Construction Vessel Market Revenue (Million) Forecast, by Application 2019 & 2032
  138. Table 138: Thailand Offshore Wind Construction Vessel Market Volume (K Unit) Forecast, by Application 2019 & 2032
  139. Table 139: Indonesia Offshore Wind Construction Vessel Market Revenue (Million) Forecast, by Application 2019 & 2032
  140. Table 140: Indonesia Offshore Wind Construction Vessel Market Volume (K Unit) Forecast, by Application 2019 & 2032
  141. Table 141: Vietnam Offshore Wind Construction Vessel Market Revenue (Million) Forecast, by Application 2019 & 2032
  142. Table 142: Vietnam Offshore Wind Construction Vessel Market Volume (K Unit) Forecast, by Application 2019 & 2032
  143. Table 143: Rest of Asia Pacific Offshore Wind Construction Vessel Market Revenue (Million) Forecast, by Application 2019 & 2032
  144. Table 144: Rest of Asia Pacific Offshore Wind Construction Vessel Market Volume (K Unit) Forecast, by Application 2019 & 2032
  145. Table 145: Global Offshore Wind Construction Vessel Market Revenue Million Forecast, by Type 2019 & 2032
  146. Table 146: Global Offshore Wind Construction Vessel Market Volume K Unit Forecast, by Type 2019 & 2032
  147. Table 147: Global Offshore Wind Construction Vessel Market Revenue Million Forecast, by Country 2019 & 2032
  148. Table 148: Global Offshore Wind Construction Vessel Market Volume K Unit Forecast, by Country 2019 & 2032
  149. Table 149: Saudi Arabia Offshore Wind Construction Vessel Market Revenue (Million) Forecast, by Application 2019 & 2032
  150. Table 150: Saudi Arabia Offshore Wind Construction Vessel Market Volume (K Unit) Forecast, by Application 2019 & 2032
  151. Table 151: United Arab Emirates Offshore Wind Construction Vessel Market Revenue (Million) Forecast, by Application 2019 & 2032
  152. Table 152: United Arab Emirates Offshore Wind Construction Vessel Market Volume (K Unit) Forecast, by Application 2019 & 2032
  153. Table 153: Nigeria Offshore Wind Construction Vessel Market Revenue (Million) Forecast, by Application 2019 & 2032
  154. Table 154: Nigeria Offshore Wind Construction Vessel Market Volume (K Unit) Forecast, by Application 2019 & 2032
  155. Table 155: Egypt Offshore Wind Construction Vessel Market Revenue (Million) Forecast, by Application 2019 & 2032
  156. Table 156: Egypt Offshore Wind Construction Vessel Market Volume (K Unit) Forecast, by Application 2019 & 2032
  157. Table 157: Qatar Offshore Wind Construction Vessel Market Revenue (Million) Forecast, by Application 2019 & 2032
  158. Table 158: Qatar Offshore Wind Construction Vessel Market Volume (K Unit) Forecast, by Application 2019 & 2032
  159. Table 159: South Africa Offshore Wind Construction Vessel Market Revenue (Million) Forecast, by Application 2019 & 2032
  160. Table 160: South Africa Offshore Wind Construction Vessel Market Volume (K Unit) Forecast, by Application 2019 & 2032
  161. Table 161: Rest of Middle East and Africa Offshore Wind Construction Vessel Market Revenue (Million) Forecast, by Application 2019 & 2032
  162. Table 162: Rest of Middle East and Africa Offshore Wind Construction Vessel Market Volume (K Unit) Forecast, by Application 2019 & 2032
  163. Table 163: Global Offshore Wind Construction Vessel Market Revenue Million Forecast, by Type 2019 & 2032
  164. Table 164: Global Offshore Wind Construction Vessel Market Volume K Unit Forecast, by Type 2019 & 2032
  165. Table 165: Global Offshore Wind Construction Vessel Market Revenue Million Forecast, by Country 2019 & 2032
  166. Table 166: Global Offshore Wind Construction Vessel Market Volume K Unit Forecast, by Country 2019 & 2032
  167. Table 167: Brazil Offshore Wind Construction Vessel Market Revenue (Million) Forecast, by Application 2019 & 2032
  168. Table 168: Brazil Offshore Wind Construction Vessel Market Volume (K Unit) Forecast, by Application 2019 & 2032
  169. Table 169: Argentina Offshore Wind Construction Vessel Market Revenue (Million) Forecast, by Application 2019 & 2032
  170. Table 170: Argentina Offshore Wind Construction Vessel Market Volume (K Unit) Forecast, by Application 2019 & 2032
  171. Table 171: Colombia Offshore Wind Construction Vessel Market Revenue (Million) Forecast, by Application 2019 & 2032
  172. Table 172: Colombia Offshore Wind Construction Vessel Market Volume (K Unit) Forecast, by Application 2019 & 2032
  173. Table 173: Rest of South America Offshore Wind Construction Vessel Market Revenue (Million) Forecast, by Application 2019 & 2032
  174. Table 174: Rest of South America Offshore Wind Construction Vessel Market Volume (K Unit) Forecast, by Application 2019 & 2032


Frequently Asked Questions

1. What is the projected Compound Annual Growth Rate (CAGR) of the Offshore Wind Construction Vessel Market?

The projected CAGR is approximately 15.06%.

2. Which companies are prominent players in the Offshore Wind Construction Vessel Market?

Key companies in the market include Fred Olsen Windcarrier, Pella Sietas GmbH, Shanghai Zhenhua Heavy Industries Co Ltd, Japan Marine United Corporation, Nantong Rainbow Offshore & Engineering Equipments Co Ltd, COSCO SHIPPING Heavy Transport Inc, Xiamen Shipbuilding Industry Co Ltd, Lamprell Energy Ltd, Deme Group, Seafox.

3. What are the main segments of the Offshore Wind Construction Vessel Market?

The market segments include Type.

4. Can you provide details about the market size?

The market size is estimated to be USD 21.33 Million as of 2022.

5. What are some drivers contributing to market growth?

Increasing Offshore Wind Energy Installation4.; Growing Imperative Toward Renewable Energy.

6. What are the notable trends driving market growth?

Normal Jack-Up Vessels Expected to Witness Growth.

7. Are there any restraints impacting market growth?

High Initial Capital Investment.

8. Can you provide examples of recent developments in the market?

April 2024: Dominion Energy announced that it successfully launched Charybdis, the first Jones Act-compliant offshore wind turbine construction vessel in the United States, from land to water. This achievement marks a significant milestone in the vessel's construction, with the completion of hull welding and the commissioning of the vessel's four legs and associated jacking system.

9. What pricing options are available for accessing the report?

Pricing options include single-user, multi-user, and enterprise licenses priced at USD 4750, USD 5250, and USD 8750 respectively.

10. Is the market size provided in terms of value or volume?

The market size is provided in terms of value, measured in Million and volume, measured in K Unit.

11. Are there any specific market keywords associated with the report?

Yes, the market keyword associated with the report is "Offshore Wind Construction Vessel Market," which aids in identifying and referencing the specific market segment covered.

12. How do I determine which pricing option suits my needs best?

The pricing options vary based on user requirements and access needs. Individual users may opt for single-user licenses, while businesses requiring broader access may choose multi-user or enterprise licenses for cost-effective access to the report.

13. Are there any additional resources or data provided in the Offshore Wind Construction Vessel Market report?

While the report offers comprehensive insights, it's advisable to review the specific contents or supplementary materials provided to ascertain if additional resources or data are available.

14. How can I stay updated on further developments or reports in the Offshore Wind Construction Vessel Market?

To stay informed about further developments, trends, and reports in the Offshore Wind Construction Vessel Market, consider subscribing to industry newsletters, following relevant companies and organizations, or regularly checking reputable industry news sources and publications.


Methodology

Step 1 - Identification of Relevant Samples Size from Population Database

Step Chart
Bar Chart
Method Chart

Step 2 - Approaches for Defining Global Market Size (Value, Volume* & Price*)

Approach Chart
Top-down and bottom-up approaches are used to validate the global market size and estimate the market size for manufactures, regional segments, product, and application.

Note*: In applicable scenarios

Step 3 - Data Sources

Primary Research

  • Web Analytics
  • Survey Reports
  • Research Institute
  • Latest Research Reports
  • Opinion Leaders

Secondary Research

  • Annual Reports
  • White Paper
  • Latest Press Release
  • Industry Association
  • Paid Database
  • Investor Presentations
Analyst Chart

Step 4 - Data Triangulation

Involves using different sources of information in order to increase the validity of a study

These sources are likely to be stakeholders in a program - participants, other researchers, program staff, other community members, and so on.

Then we put all data in single framework & apply various statistical tools to find out the dynamic on the market.

During the analysis stage, feedback from the stakeholder groups would be compared to determine areas of agreement as well as areas of divergence

Additionally, after gathering mixed and scattered data from a wide range of sources, data is triangulated and correlated to come up with estimated figures which are further validated through primary mediums or industry experts, opinion leaders.

About Visionary Data Reports

Visionary Data Reports provides future-focused market research, advanced analytics, and strategic insights for technology, healthcare, green energy, and finance. Our reports help you anticipate trends, innovate, and lead in your industry. Our expert team combines primary research, data science, and industry knowledge to deliver actionable intelligence. We offer syndicated reports, custom analytics, and consulting services tailored to your business needs. At Visionary Data Reports, we are committed to quality, transparency, and client satisfaction. Every report is rigorously validated to ensure accuracy and relevance. Our global perspective and forward-thinking approach help you understand both current and emerging market dynamics.

Stay ahead with Visionary Data Reports. Subscribe to our newsletter for the latest insights and research highlights, and follow us on social media for real-time updates. Visionary Data Reports – Your Guide to Tomorrow’s Opportunities.

artwork spiralartwork spiralRelated Reports
artwork underline

Understanding US Energy Storage Market Trends and Growth Dynamics

Explore the explosive growth of the US energy storage market with a CAGR over 30% from 2025-2033. Discover key drivers, emerging trends, and leading companies shaping a cleaner energy future.

December 2025
Base Year: 2024
No Of Pages: 197
Price: $3800

Comprehensive Insights into Norway Wind Energy Industry: Trends and Growth Projections 2025-2033

Explore the booming Norway Wind Energy Industry with a projected market size of $3,555 million by 2025 and a 7.73% CAGR. Discover key drivers, trends in offshore wind, and growth opportunities.

December 2025
Base Year: 2024
No Of Pages: 197
Price: $3800

PDC Drill Bits Industry Insightful Analysis: Trends, Competitor Dynamics, and Opportunities 2025-2033

Explore the dynamic Polycrystalline Diamond Compact (PDC) drill bits market analysis, uncovering key growth drivers, market size projections exceeding USD 3,500 million by 2025, and a CAGR above 4.00%. Discover insights into regional trends, market segments, and leading companies shaping the future of oil and gas drilling.

December 2025
Base Year: 2024
No Of Pages: 234
Price: $4750

Exploring South America Consumer Battery Industry Market Evolution 2025-2033

Explore the booming South America consumer battery market, driven by portable electronics and evolving tech. Discover key drivers, Lithium-ion dominance, and major players in this dynamic growth sector from 2019-2033.

December 2025
Base Year: 2024
No Of Pages: 180
Price: $4750

United Arab Emirates Power EPC Market Future-proof Strategies: Trends, Competitor Dynamics, and Opportunities 2025-2033

Explore the dynamic United Arab Emirates Power EPC market forecast, highlighting growth drivers, renewable energy trends, and key players in this expanding sector.

December 2025
Base Year: 2024
No Of Pages: 197
Price: $3800

Oil and Gas Industry in UK: Harnessing Emerging Innovations for Growth 2025-2033

Explore the UK oil and gas market analysis, including key drivers, restraints, and segmentation. Discover market size, CAGR, and expert insights for Shell, Chevron, TotalEnergies, and more. Get forecast data for 2025-2033.

December 2025
Base Year: 2024
No Of Pages: 197
Price: $3800

Brazil Oil and Gas Upstream Industry 2025-2033 Overview: Trends, Competitor Dynamics, and Opportunities

The size of the Brazil Oil and Gas Upstream Industry market was valued at USD XX Million in 2024 and is projected to reach USD XXX Million by 2033, with an expected CAGR of 4.00">> 4.00% during the forecast period.

December 2025
Base Year: 2024
No Of Pages: 197
Price: $3800

Understanding US Transformer Industry Trends and Growth Dynamics

Explore the burgeoning US transformer market, driven by grid modernization and renewable energy integration. Discover key insights, market size, CAGR, drivers, restraints, and leading companies from 2025-2033.

December 2025
Base Year: 2024
No Of Pages: 197
Price: $3800

China Nuclear Power Plant Equipment Market Unlocking Growth Opportunities: Analysis and Forecast 2025-2033

Explore the China Nuclear Power Plant Equipment Market analysis, CAGR > 6.00%, drivers, restraints, and key segments. Discover market trends for Pressurized Water Reactor, Island Equipment, and major companies.

December 2025
Base Year: 2024
No Of Pages: 197
Price: $3800

Exploring Key Trends in Saudi Arabia Drilling Rigs Market Market

Explore the Saudi Arabia Drilling Rigs Market analysis, including market size, CAGR of 4.80%, key drivers, trends, and major companies. Get insights into the onshore deployment segment and regional focus on Saudi Arabia.

December 2025
Base Year: 2024
No Of Pages: 197
Price: $3800

Consumer Trends Driving Industrial Centrifuge Industry Market Growth

Explore the booming Industrial Centrifuge Market, projected to reach $8.47 billion with a 4.51% CAGR. Discover key growth drivers, emerging trends, and regional market dominance in water treatment, pharmaceuticals, and food & beverages.

December 2025
Base Year: 2024
No Of Pages: 234
Price: $4750

Japan Power EPC Market Growth Projections: Trends to Watch

Explore the dynamic Japan Power EPC Market, analyzing key drivers like renewable energy expansion and infrastructure upgrades. Discover market size, CAGR, trends, restraints, and leading companies shaping the future of power generation in Japan through 2033.

December 2025
Base Year: 2024
No Of Pages: 197
Price: $3800

Equatorial Guinea Power Industry Insights: Market Size Analysis to 2033

Explore the burgeoning Equatorial Guinea power industry market with insights on growth drivers, key trends, and segmental analysis. Discover forecasts for electricity transmission, generation, and renewable energy equipment.

November 2025
Base Year: 2024
No Of Pages: 197
Price: $3800

Exploring Innovations in Africa Thermal Energy Storage Industry: Market Dynamics 2025-2033

Explore the booming African Thermal Energy Storage market, driven by renewable energy integration and power generation needs. Discover key growth drivers, market size projections, and leading companies shaping the future of energy in Africa.

November 2025
Base Year: 2024
No Of Pages: 234
Price: $4750

Decoding Market Trends in Oil and Gas Industry in Malaysia: 2025-2033 Analysis

Explore Malaysia's Oil and Gas Industry market size, CAGR, key drivers, trends, and restraints. Get in-depth analysis and future projections for this vital energy sector.

November 2025
Base Year: 2024
No Of Pages: 197
Price: $3800

Strategic Growth Drivers for Portugal Gas Generator Market Market

Explore the Portugal Gas Generator Market analysis, including market size, CAGR, drivers, trends, restraints, and key players. Discover growth opportunities and insights for the 2019-2033 period.

November 2025
Base Year: 2024
No Of Pages: 197
Price: $3800

FPSO Market Market Size and Trends 2025-2033: Comprehensive Outlook

Explore the dynamic FPSO market forecast, driven by deepwater exploration and technological innovation. Discover market size, CAGR, key drivers, restraints, and regional growth trends.

November 2025
Base Year: 2024
No Of Pages: 234
Price: $4750

Exploring Consumer Shifts in North America Oil & Gas Line Pipe Market Market 2025-2033

The size of the North America Oil & Gas Line Pipe Market market was valued at USD XX Million in 2024 and is projected to reach USD XXX Million by 2033, with an expected CAGR of 2.00">> 2.00% during the forecast period.

November 2025
Base Year: 2024
No Of Pages: 234
Price: $4750

Future Prospects for North America Smart Meters Market Growth

Explore the booming North America smart meters market forecast, driven by smart grid adoption and energy efficiency initiatives. Discover key insights, growth drivers, and leading companies shaping the future of utility management.

November 2025
Base Year: 2024
No Of Pages: 234
Price: $4750

Strategic Growth Drivers for Steam Turbine MRO Market Market

Explore the booming Steam Turbine MRO market forecast (2025-2033) with insights on drivers, trends, and segments for power, oil & gas. Get CAGR analysis.

November 2025
Base Year: 2024
No Of Pages: 234
Price: $4750

Exploring Asia-Pacific Solar PV Module Market’s Market Size Dynamics 2025-2033

Explore the booming Asia-Pacific Solar PV Module Market, driven by robust CAGR and government initiatives. Discover key drivers, trends, restraints, and growth opportunities across product types, end-users, and leading regions.

November 2025
Base Year: 2024
No Of Pages: 234
Price: $4750

Bulgaria Solar Energy Market XX CAGR Growth Analysis 2025-2033

Explore the dynamic Bulgarian solar energy market forecast, market size, CAGR, drivers, trends, restraints, and key players. Discover growth opportunities in clean energy.

November 2025
Base Year: 2024
No Of Pages: 197
Price: $3800

Europe Power to Gas Market Market Disruption and Future Trends

Explore the booming Europe Power to Gas market, driven by renewable energy integration and decarbonization efforts. Discover market size, growth drivers, and key segments for 2025-2033.

November 2025
Base Year: 2024
No Of Pages: 234
Price: $4750

Southeast Asia Power Transmission and Distribution Market Growth Pathways: Strategic Analysis and Forecasts 2025-2033

Explore the dynamic Southeast Asia Power Transmission and Distribution market, driven by robust economic growth and smart grid adoption. Discover key insights, CAGR trends, and market forecasts up to 2033 for Vietnam, Indonesia, Malaysia, and Thailand.

November 2025
Base Year: 2024
No Of Pages: 234
Price: $4750

Navigating South America Lithium-ion Battery For Electric Vehicle Market Market Growth 2025-2033

Explore the burgeoning South America lithium-ion battery market for electric vehicles, driven by robust growth and adoption. Discover key trends, market size, and leading companies shaping the future of EV mobility in the region.

November 2025
Base Year: 2024
No Of Pages: 234
Price: $4750

Growth Strategies in Middle East and Africa Solar Panel Recycling Market Market: 2025-2033 Outlook

Explore the booming Middle East and Africa Solar Panel Recycling Market, driven by rapid solar adoption and circular economy initiatives. Discover key drivers, trends, and growth forecasts for this essential sector.

November 2025
Base Year: 2024
No Of Pages: 234
Price: $4750

Peru Oil & Gas Downstream Industry Market Predictions and Opportunities 2025-2033

The size of the Peru Oil & Gas Downstream Industry market was valued at USD XX Million in 2024 and is projected to reach USD XXX Million by 2033, with an expected CAGR of 1.61">> 1.61% during the forecast period.

November 2025
Base Year: 2024
No Of Pages: 197
Price: $3800

Regional Trends and Opportunities for China Oil & Gas Upstream Industry Market

Explore the China Oil & Gas Upstream Industry market analysis, including key drivers, trends, restraints, and growth forecasts up to 2033. Discover insights into onshore and offshore exploration and production.

November 2025
Base Year: 2024
No Of Pages: 197
Price: $3800

Exploring Regional Dynamics of Power Transmission Tower Market Market 2025-2033

The size of the Power Transmission Tower Market market was valued at USD XX Million in 2024 and is projected to reach USD XXX Million by 2033, with an expected CAGR of 6.00">> 6.00% during the forecast period.

November 2025
Base Year: 2024
No Of Pages: 234
Price: $4750

North America Natural Gas Market Market Demand Dynamics: Insights 2025-2033

Explore the dynamic North America natural gas market analysis, forecasting robust growth driven by power generation, industrial fuel, and automotive applications. Discover key trends, drivers, and restraints shaping the region through 2033.

November 2025
Base Year: 2024
No Of Pages: 197
Price: $3800

Denmark Oil And Gas Midstream Market CAGR Growth Drivers and Trends: Forecasts 2025-2033

Explore the robust growth of the Denmark Oil and Gas Midstream market, driven by infrastructure development and energy security needs. Discover key insights, market drivers, and emerging trends shaping the sector through 2033.

October 2025
Base Year: 2024
No Of Pages: 197
Price: $3800

Netherlands Combined Heat and Power Market Analysis 2025 and Forecasts 2033: Unveiling Growth Opportunities

The size of the Netherlands Combined Heat and Power Market market was valued at USD XX Million in 2024 and is projected to reach USD XXX Million by 2033, with an expected CAGR of 1.34% during the forecast period.

October 2025
Base Year: 2024
No Of Pages: 197
Price: $3800

Thermal Power Industry Growth Opportunities and Market Forecast 2025-2033: A Strategic Analysis

Explore the Thermal Power Industry's market size, CAGR of 3%, and key drivers. Understand trends, restraints, fuel types (Coal, Gas, Nuclear), and leading companies from 2019-2033.

October 2025
Base Year: 2024
No Of Pages: 180
Price: $4750

North America Directional Drilling Industry Future-proof Strategies: Trends, Competitor Dynamics, and Opportunities 2025-2033

Explore the booming North America directional drilling market, driven by advanced technologies like RSS and growing oil/gas demand. Get key insights, market size, CAGR, and growth drivers for 2025-2033.

October 2025
Base Year: 2024
No Of Pages: 234
Price: $4750

Exploring Opportunities in Asia-Pacific Gas Generator Market Sector

The size of the Asia-Pacific Gas Generator Market market was valued at USD XX Million in 2024 and is projected to reach USD XXX Million by 2033, with an expected CAGR of 6.38">> 6.38% during the forecast period.

October 2025
Base Year: 2024
No Of Pages: 234
Price: $4750

Challenges to Overcome in Saudi Arabia Land-Based Fuel Transportation Market Market Growth: Analysis 2025-2033

Explore the dynamic Saudi Arabia Land-Based Fuel Transportation Market, driven by robust demand, infrastructure growth, and strategic energy initiatives. Discover key segments, trends, and leading companies shaping this vital sector's future.

October 2025
Base Year: 2024
No Of Pages: 197
Price: $3800

Laminated Busbar Industry Competitive Strategies: Trends and Forecasts 2025-2033

The size of the Laminated Busbar Industry market was valued at USD 0.78 USD Billion in 2024 and is projected to reach USD 1.17 USD Billion by 2033, with an expected CAGR of 6.02% during the forecast period.

October 2025
Base Year: 2024
No Of Pages: 180
Price: $4750

North America Nuclear Power Plant and Equipment Market Industry Overview and Projections

Explore the robust growth and key drivers of the North America Nuclear Power Plant and Equipment Market, from PWRs to BWRs, and understand future trends and opportunities through 2033.

October 2025
Base Year: 2024
No Of Pages: 234
Price: $4750

Consumer Trends Driving Brazil ROV Market Market Growth

The size of the Brazil ROV Market market was valued at USD XX Million in 2024 and is projected to reach USD XXX Million by 2033, with an expected CAGR of 6.00">> 6.00% during the forecast period.

October 2025
Base Year: 2024
No Of Pages: 197
Price: $3800

Emerging Growth Patterns in Algeria Oil and Gas Upstream Industry Market

Explore the burgeoning Algeria Oil and Gas Upstream Industry with our in-depth analysis. Discover market size, CAGR, key drivers like onshore and offshore projects, influential companies, and future trends shaping Algeria's energy landscape.

October 2025
Base Year: 2024
No Of Pages: 197
Price: $3800

Exploring Venezuela Energy Industry Market Disruption and Innovation

Explore the Venezuela Energy Industry's robust growth forecast, driven by hydrocarbon reserves and renewable integration. Discover key trends, restraints, and major players shaping the market's future from 2019-2033.

October 2025
Base Year: 2024
No Of Pages: 180
Price: $3800

Regional Growth Projections for Canada Renewable Energy Market Industry

Explore the dynamic Canadian renewable energy market, driven by robust growth, supportive policies, and technological innovation. Discover key drivers, trends, and segments shaping the future of sustainable power in Canada.

October 2025
Base Year: 2024
No Of Pages: 197
Price: $3800

Romania Wind Energy Market Market’s Consumer Landscape: Insights and Trends 2025-2033

Explore the booming Romanian wind energy market! Discover market size, CAGR, key drivers like renewable energy policies, and segments (onshore/offshore). Leading companies and future trends for 2025-2033.

October 2025
Base Year: 2024
No Of Pages: 197
Price: $3800

Consumer Trends Driving South America Medium Voltage Switchgear Market Market Growth

Explore the booming South America Medium Voltage Switchgear Market, driven by smart grids, renewable energy, and infrastructure upgrades. Get key insights, CAGR, market size, and top companies.

October 2025
Base Year: 2024
No Of Pages: 234
Price: $4750

Strategic Insights into South America High Voltage Switchgear Market Market Trends

Explore the dynamic South America High Voltage Switchgear Market, forecasting significant growth driven by renewable energy, infrastructure upgrades, and smart grid adoption. Discover key trends, drivers, and restraints impacting Brazil, Argentina, Colombia, and beyond.

October 2025
Base Year: 2024
No Of Pages: 234
Price: $4750

North America Wind Power Market Charting Growth Trajectories 2025-2033: Strategic Insights and Forecasts

The size of the North America Wind Power Market market was valued at USD XX Million in 2024 and is projected to reach USD XXX Million by 2033, with an expected CAGR of 7.34% during the forecast period.

October 2025
Base Year: 2024
No Of Pages: 234
Price: $4750

Sudan Power Industry Trends and Opportunities for Growth

Explore the evolving Sudan power industry market. Discover key drivers, emerging trends, and restraints shaping the energy landscape from 2019-2033.

October 2025
Base Year: 2024
No Of Pages: 197
Price: $3800

Emerging Opportunities in Alkaline Battery Market Market

Explore the dynamic Alkaline Battery Market forecast, driven by robust CAGR, consumer electronics demand, and emerging rechargeable trends. Discover market size, growth drivers, restraints, key players, and regional analysis up to 2033.

October 2025
Base Year: 2024
No Of Pages: 180
Price: $4750

Nigeria Solar EPC Market 2025-2033 Overview: Trends, Dynamics, and Growth Opportunities

Explore the booming Nigeria Solar EPC Market, projected to reach $1.22 Billion by 2025 with a strong CAGR. Discover market drivers, trends, and key players shaping Nigeria's renewable energy future.

October 2025
Base Year: 2024
No Of Pages: 197
Price: $3800

Oil and Gas Nuclear Magnetic Resonance Industry Future-proof Strategies: Trends, Competitor Dynamics, and Opportunities 2025-2033

Explore the booming Oil and Gas Nuclear Magnetic Resonance (NMR) market, driven by advanced reservoir characterization and EOR techniques. Discover key growth drivers, market trends, and regional insights from 2025-2033 with a CAGR over 5.00%.

October 2025
Base Year: 2024
No Of Pages: 234
Price: $4750
  • Home
  • About Us
  • Industries
    • Packaging
    • Automotive
    • Home and Property Improvement
    • Retail
    • Energy & Power
    • Food & Beverage
    • Real Estate and Construction
    • Hospitality and Tourism
    • Agriculture
    • Manufacturing Products and Services
    • Healthcare
    • Logistics
    • Aerospace & Defense
    • Chemicals & Materials
    • Professional and Commercial Services
    • Financial Services and Investment Intelligence
    • Consumer Goods and Services
    • Animal Nutrition & Wellness
    • Technology, Media and Telecom
  • Services
  • Contact
Main Logo
  • Home
  • About Us
  • Industries
    • Packaging
    • Automotive
    • Home and Property Improvement
    • Retail
    • Energy & Power
    • Food & Beverage
    • Real Estate and Construction
    • Hospitality and Tourism
    • Agriculture
    • Manufacturing Products and Services
    • Healthcare
    • Logistics
    • Aerospace & Defense
    • Chemicals & Materials
    • Professional and Commercial Services
    • Financial Services and Investment Intelligence
    • Consumer Goods and Services
    • Animal Nutrition & Wellness
    • Technology, Media and Telecom
  • Services
  • Contact
+17162654855
[email protected]

+17162654855

[email protected]

Business Address

Head Office

Ansec House 3 rd floor Tank Road, Yerwada, Pune, Maharashtra 411014

Contact Information

Craig Francis

Business Development Head

+17162654855

[email protected]

Secure Payment Partners

payment image
RetailPackagingLogisticsAutomotiveHealthcareAgricultureEnergy & PowerFood & BeverageAerospace & DefenseChemicals & MaterialsHospitality and TourismConsumer Goods and ServicesAnimal Nutrition & WellnessReal Estate and ConstructionHome and Property ImprovementTechnology, Media and TelecomManufacturing Products and ServicesFinancial Services and Investment Intelligence

© 2025 PRDUA Research & Media Private Limited, All rights reserved

Privacy Policy
Terms and Conditions
FAQ