

Key Insights
The offshore decommissioning services market is poised for substantial expansion, driven by the imperative to address aging offshore oil and gas infrastructure and escalating environmental remediation mandates. Projections indicate a compound annual growth rate (CAGR) of 6.5%, with the market valued at $11.1 billion in the base year of 2025. The market is segmented by water depth, including shallow, deep, and ultra-deepwater, each presenting distinct complexities and cost structures. Deepwater and ultra-deepwater segments, requiring specialized expertise and advanced technology, are key growth drivers. Leading entities such as Aker Solutions, DNV GL, and TechnipFMC are instrumental in this evolution through their technological prowess and established market positions. Geographically, North America and Europe dominate due to mature oil and gas sectors and extensive legacy infrastructure, while the Asia-Pacific region emerges as a significant growth area, reflecting past exploration activities necessitating future decommissioning. Key market restraints include substantial capital expenditure requirements, the volatility of oil prices impacting investment, and the technological hurdles inherent in complex, environmentally sensitive deepwater operations. Nevertheless, heightened environmental awareness and the mitigation of liabilities associated with delayed decommissioning are stimulating investment and market advancement.
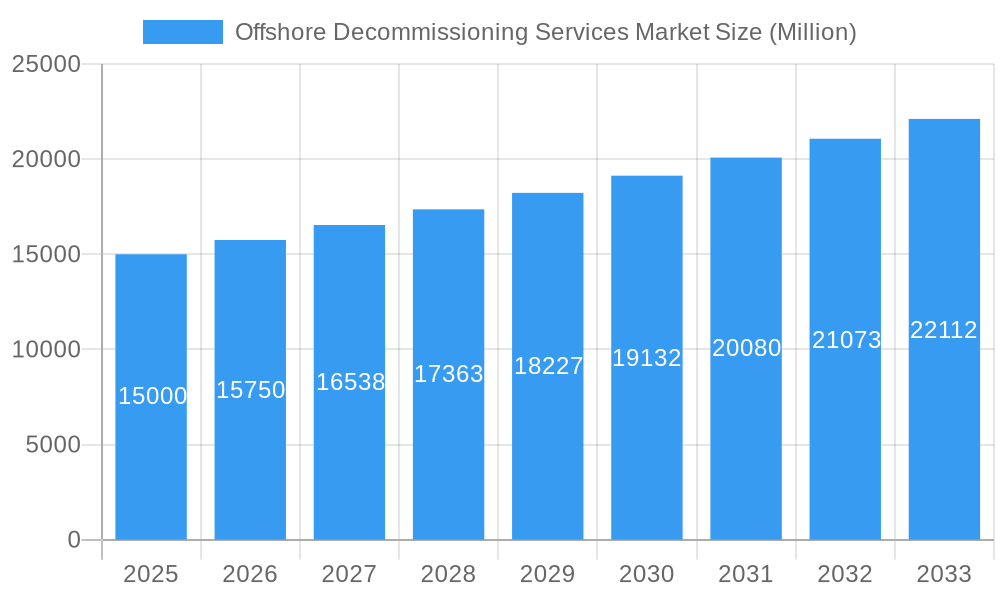
Offshore Decommissioning Services Market Market Size (In Billion)
The forecast period (2025-2033) is expected to sustain this growth trajectory, propelled by a substantial pipeline of decommissioning projects and persistent regulatory enforcement. Innovations in robotics and automation are enhancing operational efficiency and cost-effectiveness, attracting further investment. Market success will be contingent on robust collaboration among operators, contractors, and regulatory bodies to ensure safe, efficient, and environmentally responsible decommissioning practices. The market landscape will increasingly feature integrated service offerings, encompassing the entire decommissioning lifecycle to optimize efficiency and cost. Moreover, the development of pioneering technologies focused on minimizing environmental impact will be crucial for future market expansion and competitive differentiation.
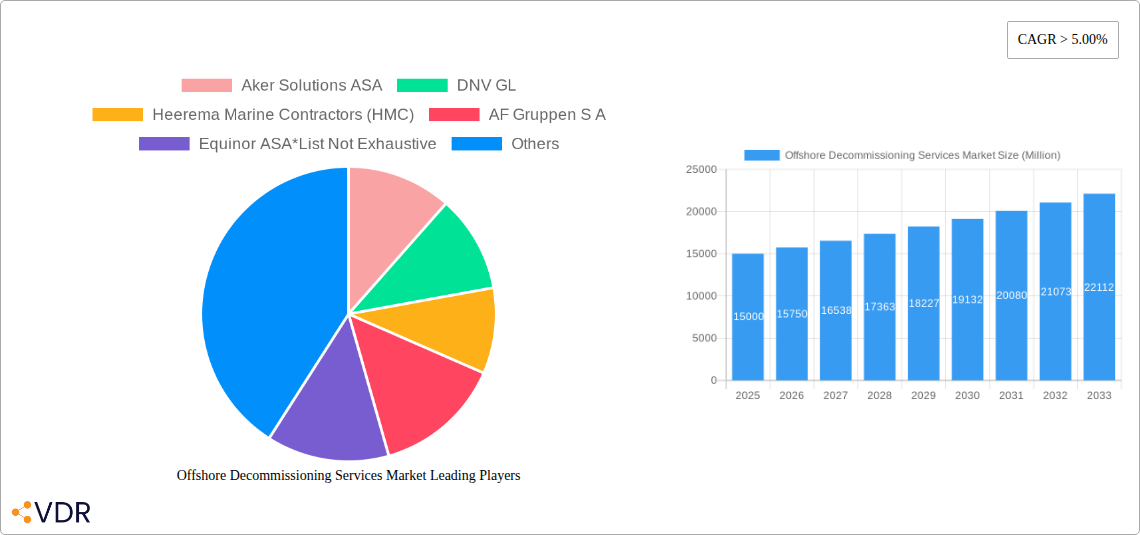
Offshore Decommissioning Services Market Company Market Share
Offshore Decommissioning Services Market Report: 2019-2033
This comprehensive report provides an in-depth analysis of the Offshore Decommissioning Services market, encompassing market dynamics, growth trends, regional analysis, competitive landscape, and future outlook. The study period spans from 2019 to 2033, with 2025 serving as the base and estimated year. The forecast period covers 2025-2033, and the historical period analyzed is 2019-2024. The market is segmented by water depth: Shallow Water, Deepwater, and Ultra-Deepwater. Key players include Aker Solutions ASA, DNV GL, Heerema Marine Contractors (HMC), AF Gruppen S A, Equinor ASA, Able UK, John Wood Group PLC, DeepOcean Group Holding B V, TechnipFMC PLC, and Allseas Group. This report is vital for industry professionals, investors, and stakeholders seeking to understand and capitalize on opportunities within this rapidly evolving market. The market size in 2025 is estimated at xx Million.
Offshore Decommissioning Services Market Dynamics & Structure
The offshore decommissioning services market is characterized by moderate concentration, with several large players and a number of smaller specialized firms. Technological innovation, particularly in robotics and remotely operated vehicles (ROVs), is a key driver, while stringent regulatory frameworks and environmental concerns shape market practices. Substitutes are limited, primarily focusing on alternative disposal methods, which are often more costly and less environmentally friendly. The end-user demographic is primarily comprised of oil and gas companies, with a growing contribution from renewable energy developers. M&A activity has been relatively consistent, with xx deals recorded in the last five years, primarily driven by companies seeking to expand their service offerings and geographical reach.
- Market Concentration: Moderately concentrated, with a Herfindahl-Hirschman Index (HHI) of xx.
- Technological Innovation: Significant advancements in ROVs, AI-powered systems, and subsea robotics are driving efficiency and reducing environmental impact.
- Regulatory Framework: Stringent regulations regarding environmental protection and worker safety impose significant compliance costs, yet ensure sustainable practices.
- Competitive Substitutes: Limited viable substitutes, with land-based disposal options often less cost-effective and environmentally sound.
- End-User Demographics: Primarily oil and gas companies, increasingly involving renewable energy firms.
- M&A Trends: xx M&A deals over the past five years, signaling consolidation and expansion within the market. The average deal size was xx Million.
Offshore Decommissioning Services Market Growth Trends & Insights
The offshore decommissioning services market is experiencing robust growth, driven by the aging offshore oil and gas infrastructure and increasing regulatory pressure for responsible decommissioning. The market size is projected to reach xx Million by 2033, exhibiting a Compound Annual Growth Rate (CAGR) of xx% during the forecast period. This growth is fueled by several factors, including increased government funding for decommissioning projects, technological advancements leading to more efficient and cost-effective decommissioning methods, and growing awareness about environmental sustainability. Adoption rates of innovative technologies like remotely operated vehicles (ROVs) and automated systems are steadily rising, which is transforming the industry and driving growth. Changes in consumer behavior, with a focus on environmental responsibility, are also playing a crucial role. Market penetration is expected to reach xx% by 2033.
Dominant Regions, Countries, or Segments in Offshore Decommissioning Services Market
The North Sea region, particularly the UK and Norway, currently dominates the offshore decommissioning services market. This dominance is attributed to a high concentration of aging oil and gas infrastructure requiring decommissioning, coupled with stringent environmental regulations and supportive government policies. Other regions, such as the Gulf of Mexico and Southeast Asia, are also witnessing significant growth, driven by increasing exploration and production activities and the subsequent need for future decommissioning. The Deepwater segment is poised for higher growth due to the complexities and costs associated with deep-sea operations.
- North Sea (UK & Norway): High concentration of aging infrastructure, stringent regulations, and government support drive market dominance. Market share: xx%. Growth potential: xx% CAGR.
- Gulf of Mexico: Significant growth potential driven by high exploration activity and increasing regulatory focus. Market share: xx%. Growth potential: xx% CAGR.
- Southeast Asia: Emerging market with significant growth potential due to rising energy demand and increasing decommissioning needs. Market share: xx%. Growth potential: xx% CAGR.
- Water Depth Segmentation: Deepwater and Ultra-Deepwater segments experiencing higher growth due to complexity and higher service costs.
Offshore Decommissioning Services Market Product Landscape
The offshore decommissioning services market offers a range of services, including platform removal, well plugging and abandonment, pipeline decommissioning, and waste management. Technological advancements have led to the introduction of innovative tools and techniques, such as remotely operated vehicles (ROVs), autonomous underwater vehicles (AUVs), and advanced robotics, enhancing efficiency, safety, and environmental protection. Unique selling propositions revolve around specialized expertise, advanced technologies, and a strong commitment to environmental sustainability. Performance metrics focus on cost-effectiveness, safety records, and environmental compliance.
Key Drivers, Barriers & Challenges in Offshore Decommissioning Services Market
Key Drivers:
- Aging offshore oil and gas infrastructure necessitating decommissioning.
- Stringent environmental regulations promoting responsible practices.
- Government incentives and funding to support decommissioning projects.
- Technological advancements improving efficiency and cost-effectiveness.
Key Challenges:
- High upfront capital expenditure for specialized equipment and skilled labor.
- Complex regulatory landscape and permitting processes across different jurisdictions.
- Potential supply chain disruptions affecting the availability of specialized materials and equipment.
- Intense competition among service providers leading to price pressure. This has resulted in an average margin reduction of xx% over the past five years.
Emerging Opportunities in Offshore Decommissioning Services Market
- Expanding into renewable energy infrastructure decommissioning.
- Development of innovative and sustainable waste management solutions.
- Leveraging data analytics and AI for optimized decommissioning planning.
- Exploration of new markets in emerging economies with growing energy sectors.
Growth Accelerators in the Offshore Decommissioning Services Market Industry
Technological breakthroughs in robotics and automation, coupled with strategic partnerships between service providers and oil and gas companies, are key growth drivers. Market expansion strategies focusing on emerging markets and the diversification into renewable energy decommissioning present significant opportunities. Improved efficiency and reduction in environmental footprint are additional factors that will further accelerate market growth.
Key Players Shaping the Offshore Decommissioning Services Market Market
- Aker Solutions ASA
- DNV GL
- Heerema Marine Contractors (HMC)
- AF Gruppen S A
- Equinor ASA
- Able UK
- John Wood Group PLC
- DeepOcean Group Holding B V
- TechnipFMC PLC
- Allseas Group
Notable Milestones in Offshore Decommissioning Services Market Sector
- 2021: Introduction of a new robotic system by Aker Solutions ASA significantly improving well-plugging efficiency.
- 2022: DNV GL releases updated guidelines on decommissioning practices.
- 2023: Heerema Marine Contractors (HMC) completes a major platform removal project in the North Sea.
- 2024: John Wood Group PLC wins a large-scale decommissioning contract in the Gulf of Mexico.
In-Depth Offshore Decommissioning Services Market Market Outlook
The offshore decommissioning services market is poised for continued robust growth, driven by a confluence of factors including aging infrastructure, stringent environmental regulations, and technological advancements. Strategic partnerships, expansion into new markets, and diversification into renewable energy infrastructure decommissioning will further unlock market potential. The future holds immense opportunities for companies that embrace innovation, sustainability, and strategic collaborations. A key area for future growth lies in the development of more sustainable decommissioning techniques that minimize environmental impact and reduce disposal costs.
Offshore Decommissioning Services Market Segmentation
-
1. Water Depth
- 1.1. Shallow Water
- 1.2. Deepwater and Ultra-Deepwater
Offshore Decommissioning Services Market Segmentation By Geography
- 1. North America
- 2. Europe
- 3. Asia Pacific
- 4. South America
- 5. Middle East and Africa
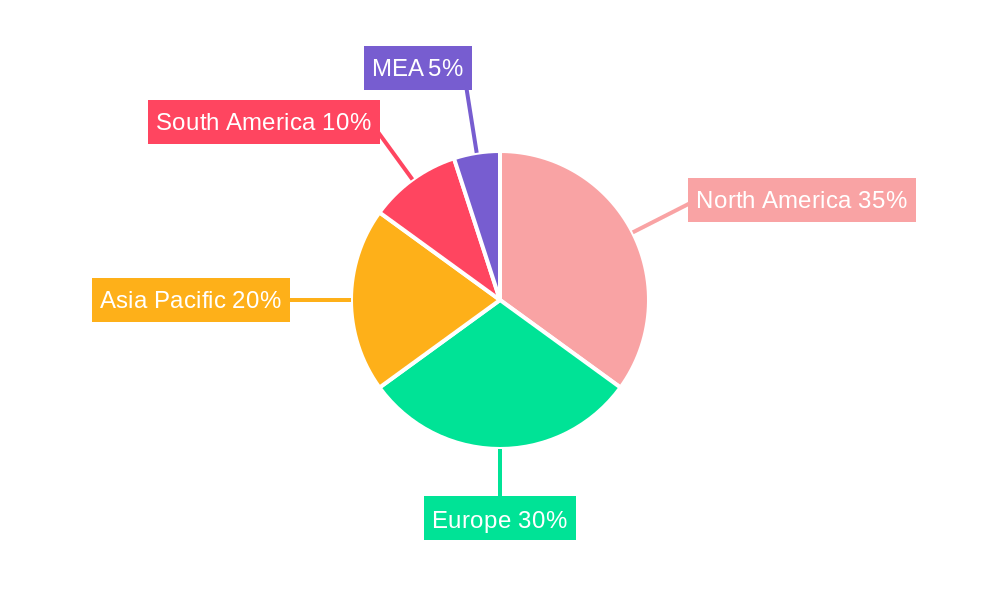
Offshore Decommissioning Services Market Regional Market Share
Geographic Coverage of Offshore Decommissioning Services Market
Offshore Decommissioning Services Market REPORT HIGHLIGHTS
| Aspects | Details |
|---|---|
| Study Period | 2020-2034 |
| Base Year | 2025 |
| Estimated Year | 2026 |
| Forecast Period | 2026-2034 |
| Historical Period | 2020-2025 |
| Growth Rate | CAGR of 6.5% from 2020-2034 |
| Segmentation |
|
Table of Contents
- 1. Introduction
- 1.1. Research Scope
- 1.2. Market Segmentation
- 1.3. Research Objective
- 1.4. Definitions and Assumptions
- 2. Executive Summary
- 2.1. Market Snapshot
- 3. Market Dynamics
- 3.1. Market Drivers
- 3.2. Market Restrains
- 3.3. Market Trends
- 3.4. Market Opportunities
- 4. Market Factor Analysis
- 4.1. Porters Five Forces
- 4.1.1. Bargaining Power of Suppliers
- 4.1.2. Bargaining Power of Buyers
- 4.1.3. Threat of New Entrants
- 4.1.4. Threat of Substitutes
- 4.1.5. Competitive Rivalry
- 4.2. PESTEL analysis
- 4.3. BCG Analysis
- 4.3.1. Stars (High Growth, High Market Share)
- 4.3.2. Cash Cows (Low Growth, High Market Share)
- 4.3.3. Question Mark (High Growth, Low Market Share)
- 4.3.4. Dogs (Low Growth, Low Market Share)
- 4.4. Ansoff Matrix Analysis
- 4.5. Supply Chain Analysis
- 4.6. Regulatory Landscape
- 4.7. Current Market Potential and Opportunity Assessment (TAM–SAM–SOM Framework)
- 4.8. VDR Analyst Note
- 4.1. Porters Five Forces
- 5. Market Analysis, Insights and Forecast 2021-2033
- 5.1. Market Analysis, Insights and Forecast - by Water Depth
- 5.1.1. Shallow Water
- 5.1.2. Deepwater and Ultra-Deepwater
- 5.2. Market Analysis, Insights and Forecast - by Region
- 5.2.1. North America
- 5.2.2. Europe
- 5.2.3. Asia Pacific
- 5.2.4. South America
- 5.2.5. Middle East and Africa
- 5.1. Market Analysis, Insights and Forecast - by Water Depth
- 6. Global Offshore Decommissioning Services Market Analysis, Insights and Forecast, 2021-2033
- 6.1. Market Analysis, Insights and Forecast - by Water Depth
- 6.1.1. Shallow Water
- 6.1.2. Deepwater and Ultra-Deepwater
- 6.1. Market Analysis, Insights and Forecast - by Water Depth
- 7. North America Offshore Decommissioning Services Market Analysis, Insights and Forecast, 2021-2033
- 7.1. Market Analysis, Insights and Forecast - by Water Depth
- 7.1.1. Shallow Water
- 7.1.2. Deepwater and Ultra-Deepwater
- 7.1. Market Analysis, Insights and Forecast - by Water Depth
- 8. Europe Offshore Decommissioning Services Market Analysis, Insights and Forecast, 2021-2033
- 8.1. Market Analysis, Insights and Forecast - by Water Depth
- 8.1.1. Shallow Water
- 8.1.2. Deepwater and Ultra-Deepwater
- 8.1. Market Analysis, Insights and Forecast - by Water Depth
- 9. Asia Pacific Offshore Decommissioning Services Market Analysis, Insights and Forecast, 2021-2033
- 9.1. Market Analysis, Insights and Forecast - by Water Depth
- 9.1.1. Shallow Water
- 9.1.2. Deepwater and Ultra-Deepwater
- 9.1. Market Analysis, Insights and Forecast - by Water Depth
- 10. South America Offshore Decommissioning Services Market Analysis, Insights and Forecast, 2021-2033
- 10.1. Market Analysis, Insights and Forecast - by Water Depth
- 10.1.1. Shallow Water
- 10.1.2. Deepwater and Ultra-Deepwater
- 10.1. Market Analysis, Insights and Forecast - by Water Depth
- 11. Middle East and Africa Offshore Decommissioning Services Market Analysis, Insights and Forecast, 2021-2033
- 11.1. Market Analysis, Insights and Forecast - by Water Depth
- 11.1.1. Shallow Water
- 11.1.2. Deepwater and Ultra-Deepwater
- 11.1. Market Analysis, Insights and Forecast - by Water Depth
- 12. Competitive Analysis
- 12.1. Company Profiles
- 12.1.1 Aker Solutions ASA
- 12.1.1.1. Company Overview
- 12.1.1.2. Products
- 12.1.1.3. Company Financials
- 12.1.1.4. SWOT Analysis
- 12.1.2 DNV GL
- 12.1.2.1. Company Overview
- 12.1.2.2. Products
- 12.1.2.3. Company Financials
- 12.1.2.4. SWOT Analysis
- 12.1.3 Heerema Marine Contractors (HMC)
- 12.1.3.1. Company Overview
- 12.1.3.2. Products
- 12.1.3.3. Company Financials
- 12.1.3.4. SWOT Analysis
- 12.1.4 AF Gruppen S A
- 12.1.4.1. Company Overview
- 12.1.4.2. Products
- 12.1.4.3. Company Financials
- 12.1.4.4. SWOT Analysis
- 12.1.5 Equinor ASA*List Not Exhaustive
- 12.1.5.1. Company Overview
- 12.1.5.2. Products
- 12.1.5.3. Company Financials
- 12.1.5.4. SWOT Analysis
- 12.1.6 Able UK
- 12.1.6.1. Company Overview
- 12.1.6.2. Products
- 12.1.6.3. Company Financials
- 12.1.6.4. SWOT Analysis
- 12.1.7 John Wood Group PLC
- 12.1.7.1. Company Overview
- 12.1.7.2. Products
- 12.1.7.3. Company Financials
- 12.1.7.4. SWOT Analysis
- 12.1.8 DeepOcean Group Holding B V
- 12.1.8.1. Company Overview
- 12.1.8.2. Products
- 12.1.8.3. Company Financials
- 12.1.8.4. SWOT Analysis
- 12.1.9 TechnipFMC PLC
- 12.1.9.1. Company Overview
- 12.1.9.2. Products
- 12.1.9.3. Company Financials
- 12.1.9.4. SWOT Analysis
- 12.1.10 Allseas Group
- 12.1.10.1. Company Overview
- 12.1.10.2. Products
- 12.1.10.3. Company Financials
- 12.1.10.4. SWOT Analysis
- 12.1.1 Aker Solutions ASA
- 12.2. Market Entropy
- 12.2.1 Company's Key Areas Served
- 12.2.2 Recent Developments
- 12.3. Company Market Share Analysis 2025
- 12.3.1 Top 5 Companies Market Share Analysis
- 12.3.2 Top 3 Companies Market Share Analysis
- 12.4. List of Potential Customers
- 13. Research Methodology
List of Figures
- Figure 1: Global Offshore Decommissioning Services Market Revenue Breakdown (billion, %) by Region 2025 & 2033
- Figure 2: North America Offshore Decommissioning Services Market Revenue (billion), by Water Depth 2025 & 2033
- Figure 3: North America Offshore Decommissioning Services Market Revenue Share (%), by Water Depth 2025 & 2033
- Figure 4: North America Offshore Decommissioning Services Market Revenue (billion), by Country 2025 & 2033
- Figure 5: North America Offshore Decommissioning Services Market Revenue Share (%), by Country 2025 & 2033
- Figure 6: Europe Offshore Decommissioning Services Market Revenue (billion), by Water Depth 2025 & 2033
- Figure 7: Europe Offshore Decommissioning Services Market Revenue Share (%), by Water Depth 2025 & 2033
- Figure 8: Europe Offshore Decommissioning Services Market Revenue (billion), by Country 2025 & 2033
- Figure 9: Europe Offshore Decommissioning Services Market Revenue Share (%), by Country 2025 & 2033
- Figure 10: Asia Pacific Offshore Decommissioning Services Market Revenue (billion), by Water Depth 2025 & 2033
- Figure 11: Asia Pacific Offshore Decommissioning Services Market Revenue Share (%), by Water Depth 2025 & 2033
- Figure 12: Asia Pacific Offshore Decommissioning Services Market Revenue (billion), by Country 2025 & 2033
- Figure 13: Asia Pacific Offshore Decommissioning Services Market Revenue Share (%), by Country 2025 & 2033
- Figure 14: South America Offshore Decommissioning Services Market Revenue (billion), by Water Depth 2025 & 2033
- Figure 15: South America Offshore Decommissioning Services Market Revenue Share (%), by Water Depth 2025 & 2033
- Figure 16: South America Offshore Decommissioning Services Market Revenue (billion), by Country 2025 & 2033
- Figure 17: South America Offshore Decommissioning Services Market Revenue Share (%), by Country 2025 & 2033
- Figure 18: Middle East and Africa Offshore Decommissioning Services Market Revenue (billion), by Water Depth 2025 & 2033
- Figure 19: Middle East and Africa Offshore Decommissioning Services Market Revenue Share (%), by Water Depth 2025 & 2033
- Figure 20: Middle East and Africa Offshore Decommissioning Services Market Revenue (billion), by Country 2025 & 2033
- Figure 21: Middle East and Africa Offshore Decommissioning Services Market Revenue Share (%), by Country 2025 & 2033
List of Tables
- Table 1: Global Offshore Decommissioning Services Market Revenue billion Forecast, by Water Depth 2020 & 2033
- Table 2: Global Offshore Decommissioning Services Market Revenue billion Forecast, by Region 2020 & 2033
- Table 3: Global Offshore Decommissioning Services Market Revenue billion Forecast, by Water Depth 2020 & 2033
- Table 4: Global Offshore Decommissioning Services Market Revenue billion Forecast, by Country 2020 & 2033
- Table 5: Global Offshore Decommissioning Services Market Revenue billion Forecast, by Water Depth 2020 & 2033
- Table 6: Global Offshore Decommissioning Services Market Revenue billion Forecast, by Country 2020 & 2033
- Table 7: Global Offshore Decommissioning Services Market Revenue billion Forecast, by Water Depth 2020 & 2033
- Table 8: Global Offshore Decommissioning Services Market Revenue billion Forecast, by Country 2020 & 2033
- Table 9: Global Offshore Decommissioning Services Market Revenue billion Forecast, by Water Depth 2020 & 2033
- Table 10: Global Offshore Decommissioning Services Market Revenue billion Forecast, by Country 2020 & 2033
- Table 11: Global Offshore Decommissioning Services Market Revenue billion Forecast, by Water Depth 2020 & 2033
- Table 12: Global Offshore Decommissioning Services Market Revenue billion Forecast, by Country 2020 & 2033
Frequently Asked Questions
1. What is the projected Compound Annual Growth Rate (CAGR) of the Offshore Decommissioning Services Market?
The projected CAGR is approximately 6.5%.
2. Which companies are prominent players in the Offshore Decommissioning Services Market?
Key companies in the market include Aker Solutions ASA, DNV GL, Heerema Marine Contractors (HMC), AF Gruppen S A, Equinor ASA*List Not Exhaustive, Able UK, John Wood Group PLC, DeepOcean Group Holding B V, TechnipFMC PLC, Allseas Group.
3. What are the main segments of the Offshore Decommissioning Services Market?
The market segments include Water Depth.
4. Can you provide details about the market size?
The market size is estimated to be USD 11.1 billion as of 2022.
5. What are some drivers contributing to market growth?
4.; Increasing Demand for Secure. Sustainable. and Clean Energy.
6. What are the notable trends driving market growth?
Shallow Water to Dominate the Market.
7. Are there any restraints impacting market growth?
4.; High Cost of Production of Biofuels.
8. Can you provide examples of recent developments in the market?
N/A
9. What pricing options are available for accessing the report?
Pricing options include single-user, multi-user, and enterprise licenses priced at USD 4750, USD 5250, and USD 8750 respectively.
10. Is the market size provided in terms of value or volume?
The market size is provided in terms of value, measured in billion.
11. Are there any specific market keywords associated with the report?
Yes, the market keyword associated with the report is "Offshore Decommissioning Services Market," which aids in identifying and referencing the specific market segment covered.
12. How do I determine which pricing option suits my needs best?
The pricing options vary based on user requirements and access needs. Individual users may opt for single-user licenses, while businesses requiring broader access may choose multi-user or enterprise licenses for cost-effective access to the report.
13. Are there any additional resources or data provided in the Offshore Decommissioning Services Market report?
While the report offers comprehensive insights, it's advisable to review the specific contents or supplementary materials provided to ascertain if additional resources or data are available.
14. How can I stay updated on further developments or reports in the Offshore Decommissioning Services Market?
To stay informed about further developments, trends, and reports in the Offshore Decommissioning Services Market, consider subscribing to industry newsletters, following relevant companies and organizations, or regularly checking reputable industry news sources and publications.
Methodology
Step 1 - Identification of Relevant Samples Size from Population Database


Step 2 - Approaches for Defining Global Market Size (Value, Volume* & Price*)

Note*: In applicable scenarios
Step 3 - Data Sources
Primary Research
- Web Analytics
- Survey Reports
- Research Institute
- Latest Research Reports
- Opinion Leaders
Secondary Research
- Annual Reports
- White Paper
- Latest Press Release
- Industry Association
- Paid Database
- Investor Presentations

Step 4 - Data Triangulation
Involves using different sources of information in order to increase the validity of a study
These sources are likely to be stakeholders in a program - participants, other researchers, program staff, other community members, and so on.
Then we put all data in single framework & apply various statistical tools to find out the dynamic on the market.
During the analysis stage, feedback from the stakeholder groups would be compared to determine areas of agreement as well as areas of divergence