
Key Insights
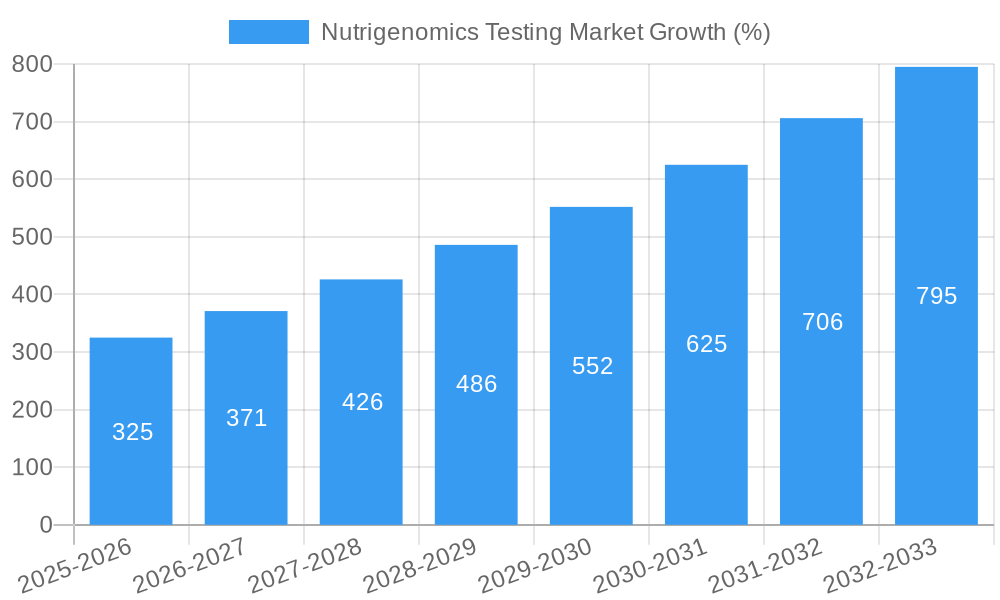
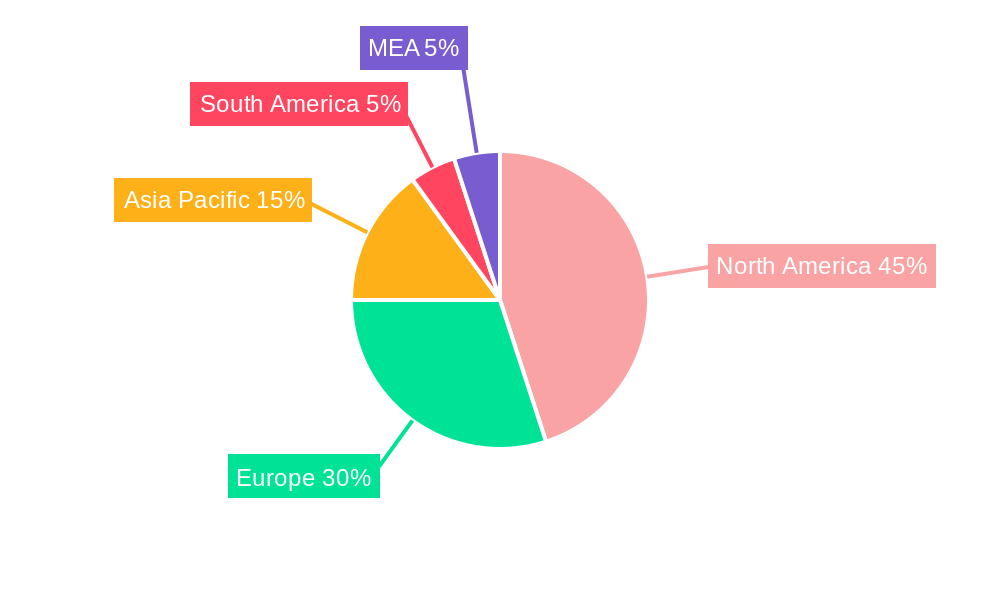
The nutrigenomics testing market is experiencing robust growth, driven by increasing prevalence of chronic diseases like obesity, diabetes, and cardiovascular disease, coupled with rising consumer awareness of personalized healthcare and preventive medicine. The market's Compound Annual Growth Rate (CAGR) of 13.30% from 2019-2033 indicates significant expansion potential. This growth is fueled by advancements in genomics technology, making testing more accessible and affordable. Furthermore, the rising adoption of direct-to-consumer (DTC) testing kits is significantly contributing to market expansion. Major segments within the market include obesity, diabetes, cancer, and cardiovascular disease testing, with obesity and diabetes currently holding the largest market shares due to their high prevalence globally. North America and Europe are currently leading the market, benefiting from well-established healthcare infrastructure and high disposable incomes, but the Asia-Pacific region is poised for substantial growth in the coming years due to increasing healthcare expenditure and rising awareness. While data privacy concerns and the relatively high cost of testing compared to traditional methods present some restraints, the overall market outlook remains overwhelmingly positive, particularly as technological advancements continue to drive down costs and improve accessibility.
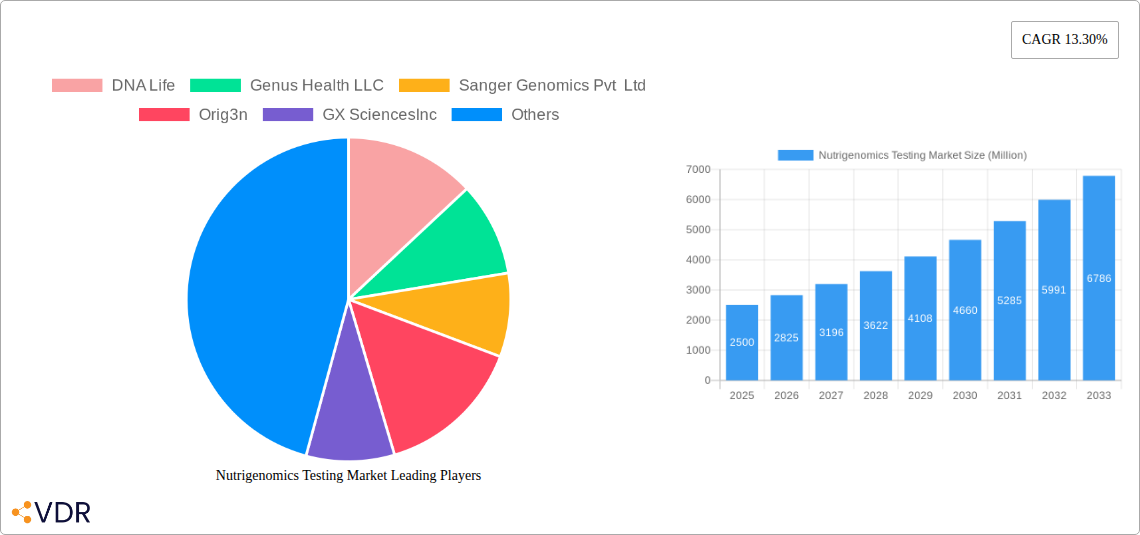
The competitive landscape is characterized by a mix of established players and emerging companies, including DNA Life, Genus Health LLC, Sanger Genomics Pvt Ltd, Orig3n, GX Sciences Inc, Nutrigenomix, Holistic Health, The Gene Box, and Cura Integrative Medicine. These companies are actively involved in developing innovative testing methodologies and expanding their geographic reach. Strategic partnerships, mergers, and acquisitions are likely to shape the competitive landscape further in the coming years. The focus is shifting towards more comprehensive testing solutions that offer personalized dietary and lifestyle recommendations based on individual genetic profiles. This trend is driven by a growing consumer demand for proactive health management and tailored interventions, propelling the continued growth and evolution of the nutrigenomics testing market.
Nutrigenomics Testing Market: A Comprehensive Report (2019-2033)
This comprehensive report provides an in-depth analysis of the Nutrigenomics Testing Market, encompassing market dynamics, growth trends, regional analysis, competitive landscape, and future outlook. The report covers the period from 2019 to 2033, with 2025 as the base year and forecast period spanning 2025-2033. The parent market is the personalized medicine market and the child market is the genetic testing market, both significant sectors influencing the growth of nutrigenomics testing. The market size is projected to reach xx Million by 2033.
Nutrigenomics Testing Market Dynamics & Structure
The Nutrigenomics Testing Market is characterized by moderate concentration, with several key players vying for market share. Technological innovation, particularly in next-generation sequencing (NGS) and bioinformatics, is a primary growth driver. Regulatory frameworks, varying significantly across regions, influence market access and adoption rates. Competitive substitutes include traditional dietary approaches and less sophisticated genetic testing methods. The end-user demographics are expanding beyond early adopters to include a broader range of health-conscious individuals. M&A activity has been relatively low in recent years (xx deals between 2019-2024), but is expected to increase as the market matures.
- Market Concentration: Moderately concentrated, with top 5 players holding approximately xx% market share in 2024.
- Technological Innovation: NGS and advanced bioinformatics are key drivers, reducing costs and improving accuracy.
- Regulatory Landscape: Varying regulations across regions pose challenges to market expansion (e.g., data privacy concerns).
- Competitive Substitutes: Traditional dietary advice and less comprehensive genetic tests present competition.
- End-User Demographics: Expanding beyond early adopters to include broader health-conscious populations.
- M&A Activity: xx deals recorded between 2019 and 2024, indicating potential for future consolidation.
Nutrigenomics Testing Market Growth Trends & Insights
The Nutrigenomics Testing Market has witnessed robust growth over the past five years, expanding at a CAGR of xx% between 2019 and 2024. This growth is driven by increasing awareness of personalized nutrition, rising prevalence of chronic diseases (obesity, diabetes, cardiovascular disease), and technological advancements reducing testing costs and improving accessibility. Market penetration remains relatively low, suggesting significant untapped potential. Consumer behavior shifts towards proactive health management and personalized healthcare further contribute to market expansion. Technological disruptions, such as the development of AI-driven analytical tools, are enhancing the utility and interpretation of nutrigenomics data, fostering faster adoption. We project a CAGR of xx% during the forecast period (2025-2033), reaching a market size of xx Million by 2033.
Dominant Regions, Countries, or Segments in Nutrigenomics Testing Market
North America currently dominates the Nutrigenomics Testing Market, driven by high disposable incomes, early adoption of personalized medicine, and robust healthcare infrastructure. Within applications, the demand for obesity and diabetes testing is particularly strong due to high prevalence rates and increased healthcare spending in these areas. Europe and Asia-Pacific are emerging markets with significant growth potential, although regulatory hurdles and lower healthcare spending currently limit market expansion.
- North America: High adoption rates, robust healthcare infrastructure, high disposable incomes, and strong regulatory support drive market leadership.
- Obesity Segment: High prevalence and focus on personalized weight management strategies fuels significant growth.
- Diabetes Segment: Strong demand due to rising prevalence and need for effective management strategies.
- Europe: Growing market with increasing awareness and investment in personalized medicine, but slower growth due to regulatory complexities.
- Asia-Pacific: High growth potential due to rising health consciousness and increasing healthcare expenditure, but faces challenges related to infrastructure and affordability.
Nutrigenomics Testing Market Product Landscape
The market offers a range of products, from basic single-gene tests to comprehensive panels analyzing multiple genes related to nutrient metabolism and disease risk. Innovations focus on improving accuracy, simplifying sample collection, and providing user-friendly reporting and personalized dietary recommendations. Technological advancements, like advanced algorithms for data interpretation and integration with wearable health trackers, are enhancing the value proposition of these tests. Unique selling propositions include convenience, accuracy, and personalized lifestyle recommendations based on genetic predisposition.
Key Drivers, Barriers & Challenges in Nutrigenomics Testing Market
Key Drivers:
- Increasing awareness of personalized nutrition and its benefits.
- Rising prevalence of chronic diseases like obesity and diabetes.
- Technological advancements reducing cost and improving accuracy.
- Government initiatives promoting preventative healthcare.
Challenges & Restraints:
- High cost of testing remains a barrier to widespread adoption.
- Lack of standardization and regulation across different regions.
- Data privacy and security concerns related to genetic information.
- Competition from traditional dietary advice and other health solutions. This results in a xx% reduction in market growth potential annually.
Emerging Opportunities in Nutrigenomics Testing Market
Untapped markets exist in developing countries with rising health awareness and disposable income. Innovative applications are emerging, such as integrating nutrigenomics testing with telehealth platforms and wearable sensors. Evolving consumer preferences towards holistic wellness and preventative healthcare create opportunities for integrated personalized health solutions combining genetic testing, dietary advice, and lifestyle coaching.
Growth Accelerators in the Nutrigenomics Testing Market Industry
Technological breakthroughs in gene sequencing and data analysis will continue to drive market growth, along with strategic partnerships between testing companies and healthcare providers. Market expansion into new geographical regions with significant unmet needs will fuel future growth. The development of more affordable and accessible testing options will broaden market penetration and drive market expansion.
Key Players Shaping the Nutrigenomics Testing Market Market
- DNA Life
- Genus Health LLC
- Sanger Genomics Pvt Ltd
- Orig3n
- GX Sciences Inc
- Nutrigenomix
- Holistic Health
- The Gene Box
- Cura Integrative Medicine
Notable Milestones in Nutrigenomics Testing Market Sector
- 2020: Launch of a new, more affordable nutrigenomics testing platform by DNA Life.
- 2022: FDA approval of a new nutrigenomics test for diabetes risk assessment.
- 2023: Acquisition of a smaller nutrigenomics company by a major healthcare provider. (Further details on specific acquisitions are not available, denoted by xx)
In-Depth Nutrigenomics Testing Market Market Outlook
The Nutrigenomics Testing Market is poised for significant growth over the next decade, driven by increasing consumer awareness, technological innovation, and expanding healthcare systems. Strategic partnerships and the development of innovative applications will shape the future market landscape. Continued focus on cost reduction and regulatory harmonization will be crucial to unlocking the full potential of this emerging field.
Nutrigenomics Testing Market Segmentation
-
1. Application
- 1.1. Obesity
- 1.2. Diabetes
- 1.3. Cancer
- 1.4. Cardiovascular Disease
Nutrigenomics Testing Market Segmentation By Geography
-
1. North America
- 1.1. United States
- 1.2. Canada
- 1.3. Mexico
-
2. Europe
- 2.1. Germany
- 2.2. United Kingdom
- 2.3. France
- 2.4. Italy
- 2.5. Spain
- 2.6. Rest of Europe
-
3. Asia Pacific
- 3.1. China
- 3.2. Japan
- 3.3. India
- 3.4. Australia
- 3.5. South Korea
- 3.6. Rest of Asia Pacific
- 4. Rest of the World
Nutrigenomics Testing Market REPORT HIGHLIGHTS
| Aspects | Details |
|---|---|
| Study Period | 2019-2033 |
| Base Year | 2024 |
| Estimated Year | 2025 |
| Forecast Period | 2025-2033 |
| Historical Period | 2019-2024 |
| Growth Rate | CAGR of 13.30% from 2019-2033 |
| Segmentation |
|
Table of Contents
- 1. Introduction
- 1.1. Research Scope
- 1.2. Market Segmentation
- 1.3. Research Methodology
- 1.4. Definitions and Assumptions
- 2. Executive Summary
- 2.1. Introduction
- 3. Market Dynamics
- 3.1. Introduction
- 3.2. Market Drivers
- 3.2.1. ; Increasing Prevalence of Lifestyle Disorders; Increasing Popularity for Personalised Diet
- 3.3. Market Restrains
- 3.3.1. ; Stringent Regulatory Framework
- 3.4. Market Trends
- 3.4.1. Obesity Segment is Expected to Exhibhit a Significant Market Growth in the Nutrigenomics Testing Market
- 4. Market Factor Analysis
- 4.1. Porters Five Forces
- 4.2. Supply/Value Chain
- 4.3. PESTEL analysis
- 4.4. Market Entropy
- 4.5. Patent/Trademark Analysis
- 5. Global Nutrigenomics Testing Market Analysis, Insights and Forecast, 2019-2031
- 5.1. Market Analysis, Insights and Forecast - by Application
- 5.1.1. Obesity
- 5.1.2. Diabetes
- 5.1.3. Cancer
- 5.1.4. Cardiovascular Disease
- 5.2. Market Analysis, Insights and Forecast - by Region
- 5.2.1. North America
- 5.2.2. Europe
- 5.2.3. Asia Pacific
- 5.2.4. Rest of the World
- 5.1. Market Analysis, Insights and Forecast - by Application
- 6. North America Nutrigenomics Testing Market Analysis, Insights and Forecast, 2019-2031
- 6.1. Market Analysis, Insights and Forecast - by Application
- 6.1.1. Obesity
- 6.1.2. Diabetes
- 6.1.3. Cancer
- 6.1.4. Cardiovascular Disease
- 6.1. Market Analysis, Insights and Forecast - by Application
- 7. Europe Nutrigenomics Testing Market Analysis, Insights and Forecast, 2019-2031
- 7.1. Market Analysis, Insights and Forecast - by Application
- 7.1.1. Obesity
- 7.1.2. Diabetes
- 7.1.3. Cancer
- 7.1.4. Cardiovascular Disease
- 7.1. Market Analysis, Insights and Forecast - by Application
- 8. Asia Pacific Nutrigenomics Testing Market Analysis, Insights and Forecast, 2019-2031
- 8.1. Market Analysis, Insights and Forecast - by Application
- 8.1.1. Obesity
- 8.1.2. Diabetes
- 8.1.3. Cancer
- 8.1.4. Cardiovascular Disease
- 8.1. Market Analysis, Insights and Forecast - by Application
- 9. Rest of the World Nutrigenomics Testing Market Analysis, Insights and Forecast, 2019-2031
- 9.1. Market Analysis, Insights and Forecast - by Application
- 9.1.1. Obesity
- 9.1.2. Diabetes
- 9.1.3. Cancer
- 9.1.4. Cardiovascular Disease
- 9.1. Market Analysis, Insights and Forecast - by Application
- 10. North America Nutrigenomics Testing Market Analysis, Insights and Forecast, 2019-2031
- 10.1. Market Analysis, Insights and Forecast - By Country/Sub-region
- 10.1.1 United States
- 10.1.2 Canada
- 10.1.3 Mexico
- 11. Europe Nutrigenomics Testing Market Analysis, Insights and Forecast, 2019-2031
- 11.1. Market Analysis, Insights and Forecast - By Country/Sub-region
- 11.1.1 Germany
- 11.1.2 United Kingdom
- 11.1.3 France
- 11.1.4 Spain
- 11.1.5 Italy
- 11.1.6 Spain
- 11.1.7 Belgium
- 11.1.8 Netherland
- 11.1.9 Nordics
- 11.1.10 Rest of Europe
- 12. Asia Pacific Nutrigenomics Testing Market Analysis, Insights and Forecast, 2019-2031
- 12.1. Market Analysis, Insights and Forecast - By Country/Sub-region
- 12.1.1 China
- 12.1.2 Japan
- 12.1.3 India
- 12.1.4 South Korea
- 12.1.5 Southeast Asia
- 12.1.6 Australia
- 12.1.7 Indonesia
- 12.1.8 Phillipes
- 12.1.9 Singapore
- 12.1.10 Thailandc
- 12.1.11 Rest of Asia Pacific
- 13. South America Nutrigenomics Testing Market Analysis, Insights and Forecast, 2019-2031
- 13.1. Market Analysis, Insights and Forecast - By Country/Sub-region
- 13.1.1 Brazil
- 13.1.2 Argentina
- 13.1.3 Peru
- 13.1.4 Chile
- 13.1.5 Colombia
- 13.1.6 Ecuador
- 13.1.7 Venezuela
- 13.1.8 Rest of South America
- 14. MEA Nutrigenomics Testing Market Analysis, Insights and Forecast, 2019-2031
- 14.1. Market Analysis, Insights and Forecast - By Country/Sub-region
- 14.1.1 United Arab Emirates
- 14.1.2 Saudi Arabia
- 14.1.3 South Africa
- 14.1.4 Rest of Middle East and Africa
- 15. Competitive Analysis
- 15.1. Global Market Share Analysis 2024
- 15.2. Company Profiles
- 15.2.1 DNA Life
- 15.2.1.1. Overview
- 15.2.1.2. Products
- 15.2.1.3. SWOT Analysis
- 15.2.1.4. Recent Developments
- 15.2.1.5. Financials (Based on Availability)
- 15.2.2 Genus Health LLC
- 15.2.2.1. Overview
- 15.2.2.2. Products
- 15.2.2.3. SWOT Analysis
- 15.2.2.4. Recent Developments
- 15.2.2.5. Financials (Based on Availability)
- 15.2.3 Sanger Genomics Pvt Ltd
- 15.2.3.1. Overview
- 15.2.3.2. Products
- 15.2.3.3. SWOT Analysis
- 15.2.3.4. Recent Developments
- 15.2.3.5. Financials (Based on Availability)
- 15.2.4 Orig3n
- 15.2.4.1. Overview
- 15.2.4.2. Products
- 15.2.4.3. SWOT Analysis
- 15.2.4.4. Recent Developments
- 15.2.4.5. Financials (Based on Availability)
- 15.2.5 GX SciencesInc
- 15.2.5.1. Overview
- 15.2.5.2. Products
- 15.2.5.3. SWOT Analysis
- 15.2.5.4. Recent Developments
- 15.2.5.5. Financials (Based on Availability)
- 15.2.6 Nutrigenomix
- 15.2.6.1. Overview
- 15.2.6.2. Products
- 15.2.6.3. SWOT Analysis
- 15.2.6.4. Recent Developments
- 15.2.6.5. Financials (Based on Availability)
- 15.2.7 Holistic Health
- 15.2.7.1. Overview
- 15.2.7.2. Products
- 15.2.7.3. SWOT Analysis
- 15.2.7.4. Recent Developments
- 15.2.7.5. Financials (Based on Availability)
- 15.2.8 The Gene Box
- 15.2.8.1. Overview
- 15.2.8.2. Products
- 15.2.8.3. SWOT Analysis
- 15.2.8.4. Recent Developments
- 15.2.8.5. Financials (Based on Availability)
- 15.2.9 Cura Integrative Medicine
- 15.2.9.1. Overview
- 15.2.9.2. Products
- 15.2.9.3. SWOT Analysis
- 15.2.9.4. Recent Developments
- 15.2.9.5. Financials (Based on Availability)
- 15.2.1 DNA Life
List of Figures
- Figure 1: Global Nutrigenomics Testing Market Revenue Breakdown (Million, %) by Region 2024 & 2032
- Figure 2: North America Nutrigenomics Testing Market Revenue (Million), by Country 2024 & 2032
- Figure 3: North America Nutrigenomics Testing Market Revenue Share (%), by Country 2024 & 2032
- Figure 4: Europe Nutrigenomics Testing Market Revenue (Million), by Country 2024 & 2032
- Figure 5: Europe Nutrigenomics Testing Market Revenue Share (%), by Country 2024 & 2032
- Figure 6: Asia Pacific Nutrigenomics Testing Market Revenue (Million), by Country 2024 & 2032
- Figure 7: Asia Pacific Nutrigenomics Testing Market Revenue Share (%), by Country 2024 & 2032
- Figure 8: South America Nutrigenomics Testing Market Revenue (Million), by Country 2024 & 2032
- Figure 9: South America Nutrigenomics Testing Market Revenue Share (%), by Country 2024 & 2032
- Figure 10: MEA Nutrigenomics Testing Market Revenue (Million), by Country 2024 & 2032
- Figure 11: MEA Nutrigenomics Testing Market Revenue Share (%), by Country 2024 & 2032
- Figure 12: North America Nutrigenomics Testing Market Revenue (Million), by Application 2024 & 2032
- Figure 13: North America Nutrigenomics Testing Market Revenue Share (%), by Application 2024 & 2032
- Figure 14: North America Nutrigenomics Testing Market Revenue (Million), by Country 2024 & 2032
- Figure 15: North America Nutrigenomics Testing Market Revenue Share (%), by Country 2024 & 2032
- Figure 16: Europe Nutrigenomics Testing Market Revenue (Million), by Application 2024 & 2032
- Figure 17: Europe Nutrigenomics Testing Market Revenue Share (%), by Application 2024 & 2032
- Figure 18: Europe Nutrigenomics Testing Market Revenue (Million), by Country 2024 & 2032
- Figure 19: Europe Nutrigenomics Testing Market Revenue Share (%), by Country 2024 & 2032
- Figure 20: Asia Pacific Nutrigenomics Testing Market Revenue (Million), by Application 2024 & 2032
- Figure 21: Asia Pacific Nutrigenomics Testing Market Revenue Share (%), by Application 2024 & 2032
- Figure 22: Asia Pacific Nutrigenomics Testing Market Revenue (Million), by Country 2024 & 2032
- Figure 23: Asia Pacific Nutrigenomics Testing Market Revenue Share (%), by Country 2024 & 2032
- Figure 24: Rest of the World Nutrigenomics Testing Market Revenue (Million), by Application 2024 & 2032
- Figure 25: Rest of the World Nutrigenomics Testing Market Revenue Share (%), by Application 2024 & 2032
- Figure 26: Rest of the World Nutrigenomics Testing Market Revenue (Million), by Country 2024 & 2032
- Figure 27: Rest of the World Nutrigenomics Testing Market Revenue Share (%), by Country 2024 & 2032
List of Tables
- Table 1: Global Nutrigenomics Testing Market Revenue Million Forecast, by Region 2019 & 2032
- Table 2: Global Nutrigenomics Testing Market Revenue Million Forecast, by Application 2019 & 2032
- Table 3: Global Nutrigenomics Testing Market Revenue Million Forecast, by Region 2019 & 2032
- Table 4: Global Nutrigenomics Testing Market Revenue Million Forecast, by Country 2019 & 2032
- Table 5: United States Nutrigenomics Testing Market Revenue (Million) Forecast, by Application 2019 & 2032
- Table 6: Canada Nutrigenomics Testing Market Revenue (Million) Forecast, by Application 2019 & 2032
- Table 7: Mexico Nutrigenomics Testing Market Revenue (Million) Forecast, by Application 2019 & 2032
- Table 8: Global Nutrigenomics Testing Market Revenue Million Forecast, by Country 2019 & 2032
- Table 9: Germany Nutrigenomics Testing Market Revenue (Million) Forecast, by Application 2019 & 2032
- Table 10: United Kingdom Nutrigenomics Testing Market Revenue (Million) Forecast, by Application 2019 & 2032
- Table 11: France Nutrigenomics Testing Market Revenue (Million) Forecast, by Application 2019 & 2032
- Table 12: Spain Nutrigenomics Testing Market Revenue (Million) Forecast, by Application 2019 & 2032
- Table 13: Italy Nutrigenomics Testing Market Revenue (Million) Forecast, by Application 2019 & 2032
- Table 14: Spain Nutrigenomics Testing Market Revenue (Million) Forecast, by Application 2019 & 2032
- Table 15: Belgium Nutrigenomics Testing Market Revenue (Million) Forecast, by Application 2019 & 2032
- Table 16: Netherland Nutrigenomics Testing Market Revenue (Million) Forecast, by Application 2019 & 2032
- Table 17: Nordics Nutrigenomics Testing Market Revenue (Million) Forecast, by Application 2019 & 2032
- Table 18: Rest of Europe Nutrigenomics Testing Market Revenue (Million) Forecast, by Application 2019 & 2032
- Table 19: Global Nutrigenomics Testing Market Revenue Million Forecast, by Country 2019 & 2032
- Table 20: China Nutrigenomics Testing Market Revenue (Million) Forecast, by Application 2019 & 2032
- Table 21: Japan Nutrigenomics Testing Market Revenue (Million) Forecast, by Application 2019 & 2032
- Table 22: India Nutrigenomics Testing Market Revenue (Million) Forecast, by Application 2019 & 2032
- Table 23: South Korea Nutrigenomics Testing Market Revenue (Million) Forecast, by Application 2019 & 2032
- Table 24: Southeast Asia Nutrigenomics Testing Market Revenue (Million) Forecast, by Application 2019 & 2032
- Table 25: Australia Nutrigenomics Testing Market Revenue (Million) Forecast, by Application 2019 & 2032
- Table 26: Indonesia Nutrigenomics Testing Market Revenue (Million) Forecast, by Application 2019 & 2032
- Table 27: Phillipes Nutrigenomics Testing Market Revenue (Million) Forecast, by Application 2019 & 2032
- Table 28: Singapore Nutrigenomics Testing Market Revenue (Million) Forecast, by Application 2019 & 2032
- Table 29: Thailandc Nutrigenomics Testing Market Revenue (Million) Forecast, by Application 2019 & 2032
- Table 30: Rest of Asia Pacific Nutrigenomics Testing Market Revenue (Million) Forecast, by Application 2019 & 2032
- Table 31: Global Nutrigenomics Testing Market Revenue Million Forecast, by Country 2019 & 2032
- Table 32: Brazil Nutrigenomics Testing Market Revenue (Million) Forecast, by Application 2019 & 2032
- Table 33: Argentina Nutrigenomics Testing Market Revenue (Million) Forecast, by Application 2019 & 2032
- Table 34: Peru Nutrigenomics Testing Market Revenue (Million) Forecast, by Application 2019 & 2032
- Table 35: Chile Nutrigenomics Testing Market Revenue (Million) Forecast, by Application 2019 & 2032
- Table 36: Colombia Nutrigenomics Testing Market Revenue (Million) Forecast, by Application 2019 & 2032
- Table 37: Ecuador Nutrigenomics Testing Market Revenue (Million) Forecast, by Application 2019 & 2032
- Table 38: Venezuela Nutrigenomics Testing Market Revenue (Million) Forecast, by Application 2019 & 2032
- Table 39: Rest of South America Nutrigenomics Testing Market Revenue (Million) Forecast, by Application 2019 & 2032
- Table 40: Global Nutrigenomics Testing Market Revenue Million Forecast, by Country 2019 & 2032
- Table 41: United Arab Emirates Nutrigenomics Testing Market Revenue (Million) Forecast, by Application 2019 & 2032
- Table 42: Saudi Arabia Nutrigenomics Testing Market Revenue (Million) Forecast, by Application 2019 & 2032
- Table 43: South Africa Nutrigenomics Testing Market Revenue (Million) Forecast, by Application 2019 & 2032
- Table 44: Rest of Middle East and Africa Nutrigenomics Testing Market Revenue (Million) Forecast, by Application 2019 & 2032
- Table 45: Global Nutrigenomics Testing Market Revenue Million Forecast, by Application 2019 & 2032
- Table 46: Global Nutrigenomics Testing Market Revenue Million Forecast, by Country 2019 & 2032
- Table 47: United States Nutrigenomics Testing Market Revenue (Million) Forecast, by Application 2019 & 2032
- Table 48: Canada Nutrigenomics Testing Market Revenue (Million) Forecast, by Application 2019 & 2032
- Table 49: Mexico Nutrigenomics Testing Market Revenue (Million) Forecast, by Application 2019 & 2032
- Table 50: Global Nutrigenomics Testing Market Revenue Million Forecast, by Application 2019 & 2032
- Table 51: Global Nutrigenomics Testing Market Revenue Million Forecast, by Country 2019 & 2032
- Table 52: Germany Nutrigenomics Testing Market Revenue (Million) Forecast, by Application 2019 & 2032
- Table 53: United Kingdom Nutrigenomics Testing Market Revenue (Million) Forecast, by Application 2019 & 2032
- Table 54: France Nutrigenomics Testing Market Revenue (Million) Forecast, by Application 2019 & 2032
- Table 55: Italy Nutrigenomics Testing Market Revenue (Million) Forecast, by Application 2019 & 2032
- Table 56: Spain Nutrigenomics Testing Market Revenue (Million) Forecast, by Application 2019 & 2032
- Table 57: Rest of Europe Nutrigenomics Testing Market Revenue (Million) Forecast, by Application 2019 & 2032
- Table 58: Global Nutrigenomics Testing Market Revenue Million Forecast, by Application 2019 & 2032
- Table 59: Global Nutrigenomics Testing Market Revenue Million Forecast, by Country 2019 & 2032
- Table 60: China Nutrigenomics Testing Market Revenue (Million) Forecast, by Application 2019 & 2032
- Table 61: Japan Nutrigenomics Testing Market Revenue (Million) Forecast, by Application 2019 & 2032
- Table 62: India Nutrigenomics Testing Market Revenue (Million) Forecast, by Application 2019 & 2032
- Table 63: Australia Nutrigenomics Testing Market Revenue (Million) Forecast, by Application 2019 & 2032
- Table 64: South Korea Nutrigenomics Testing Market Revenue (Million) Forecast, by Application 2019 & 2032
- Table 65: Rest of Asia Pacific Nutrigenomics Testing Market Revenue (Million) Forecast, by Application 2019 & 2032
- Table 66: Global Nutrigenomics Testing Market Revenue Million Forecast, by Application 2019 & 2032
- Table 67: Global Nutrigenomics Testing Market Revenue Million Forecast, by Country 2019 & 2032
Frequently Asked Questions
1. What is the projected Compound Annual Growth Rate (CAGR) of the Nutrigenomics Testing Market?
The projected CAGR is approximately 13.30%.
2. Which companies are prominent players in the Nutrigenomics Testing Market?
Key companies in the market include DNA Life, Genus Health LLC, Sanger Genomics Pvt Ltd, Orig3n, GX SciencesInc, Nutrigenomix, Holistic Health, The Gene Box, Cura Integrative Medicine.
3. What are the main segments of the Nutrigenomics Testing Market?
The market segments include Application.
4. Can you provide details about the market size?
The market size is estimated to be USD XX Million as of 2022.
5. What are some drivers contributing to market growth?
; Increasing Prevalence of Lifestyle Disorders; Increasing Popularity for Personalised Diet.
6. What are the notable trends driving market growth?
Obesity Segment is Expected to Exhibhit a Significant Market Growth in the Nutrigenomics Testing Market.
7. Are there any restraints impacting market growth?
; Stringent Regulatory Framework.
8. Can you provide examples of recent developments in the market?
N/A
9. What pricing options are available for accessing the report?
Pricing options include single-user, multi-user, and enterprise licenses priced at USD 4750, USD 5250, and USD 8750 respectively.
10. Is the market size provided in terms of value or volume?
The market size is provided in terms of value, measured in Million.
11. Are there any specific market keywords associated with the report?
Yes, the market keyword associated with the report is "Nutrigenomics Testing Market," which aids in identifying and referencing the specific market segment covered.
12. How do I determine which pricing option suits my needs best?
The pricing options vary based on user requirements and access needs. Individual users may opt for single-user licenses, while businesses requiring broader access may choose multi-user or enterprise licenses for cost-effective access to the report.
13. Are there any additional resources or data provided in the Nutrigenomics Testing Market report?
While the report offers comprehensive insights, it's advisable to review the specific contents or supplementary materials provided to ascertain if additional resources or data are available.
14. How can I stay updated on further developments or reports in the Nutrigenomics Testing Market?
To stay informed about further developments, trends, and reports in the Nutrigenomics Testing Market, consider subscribing to industry newsletters, following relevant companies and organizations, or regularly checking reputable industry news sources and publications.
Methodology
Step 1 - Identification of Relevant Samples Size from Population Database


Step 2 - Approaches for Defining Global Market Size (Value, Volume* & Price*)

Note*: In applicable scenarios
Step 3 - Data Sources
Primary Research
- Web Analytics
- Survey Reports
- Research Institute
- Latest Research Reports
- Opinion Leaders
Secondary Research
- Annual Reports
- White Paper
- Latest Press Release
- Industry Association
- Paid Database
- Investor Presentations

Step 4 - Data Triangulation
Involves using different sources of information in order to increase the validity of a study
These sources are likely to be stakeholders in a program - participants, other researchers, program staff, other community members, and so on.
Then we put all data in single framework & apply various statistical tools to find out the dynamic on the market.
During the analysis stage, feedback from the stakeholder groups would be compared to determine areas of agreement as well as areas of divergence


