

Key Insights
The North Sea decommissioning oil rig market is experiencing robust growth, driven by the aging infrastructure of offshore oil and gas platforms and increasingly stringent environmental regulations. A CAGR exceeding 5% indicates a significant expansion projected through 2033. The market is segmented by water depth (shallow, deepwater, ultra-deepwater), with deepwater and ultra-deepwater segments likely dominating due to the concentration of aging platforms in these areas. Key players like Aker Solutions, DNV GL, and Heerema Marine Contractors are heavily involved, leveraging their expertise in complex decommissioning projects. While the North Sea is the primary focus, the report considers other regions including North America, Europe, Asia-Pacific, South America, and the Middle East & Africa, providing a broader perspective on market opportunities. The high capital expenditure required for decommissioning, coupled with potential technological challenges in dismantling aging structures in harsh marine environments, act as significant restraints. However, government incentives and stricter environmental legislation are counteracting these challenges, propelling the market forward. The European region, particularly the North Sea, currently holds the largest market share, due to the high concentration of aging oil and gas platforms requiring decommissioning. However, growth in other regions with significant offshore oil and gas infrastructure is expected to contribute significantly in the forecast period. The market is further shaped by evolving technological advancements that aim to improve efficiency and minimize environmental impact during the decommissioning process.
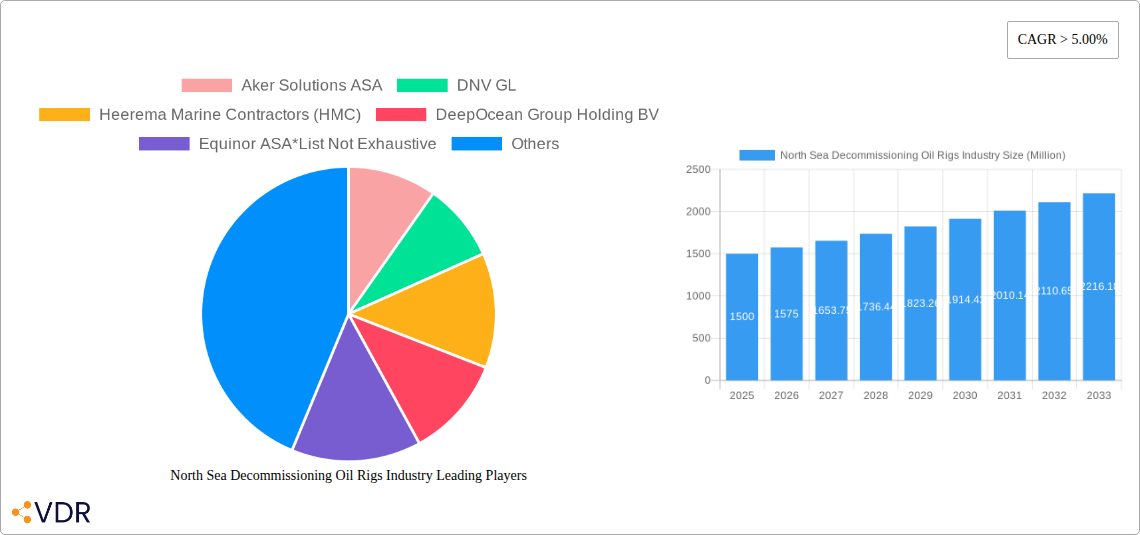
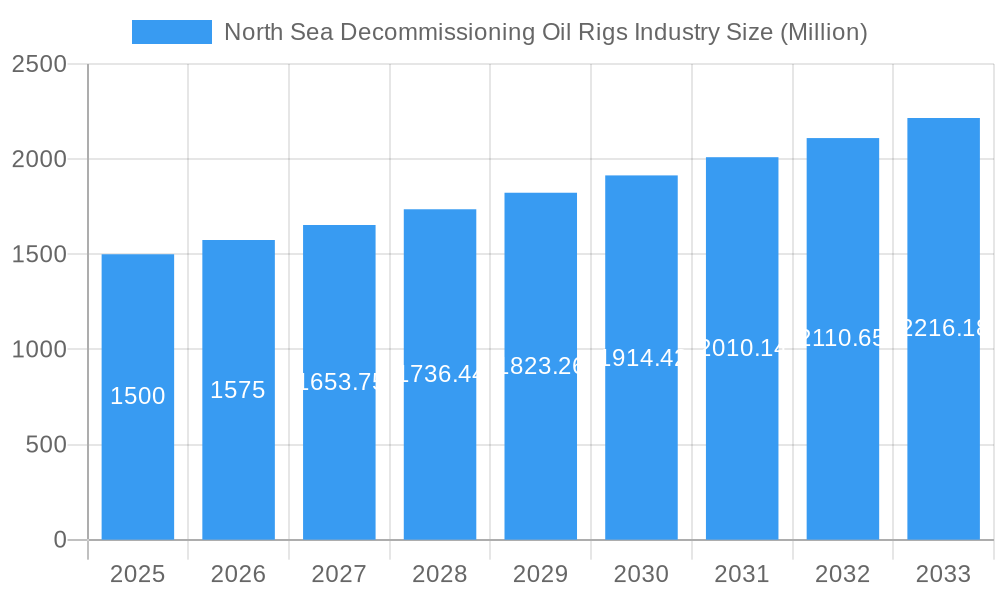
North Sea Decommissioning Oil Rigs Industry Market Size (In Billion)
The North Sea decommissioning market’s future trajectory is optimistic, fueled by ongoing platform retirements and the commitment to responsible environmental stewardship. The ongoing development and adoption of innovative techniques for rig removal, recycling and waste management will be vital in navigating the challenges and capitalizing on market opportunities. Analyzing regional differences in regulatory frameworks and decommissioning practices is critical. North America and the Asia-Pacific region present potential growth avenues, although the European market continues to hold the largest share, driven by the existing infrastructure. Competitive analysis of key players, along with a detailed segmental overview of water depth classifications, provides a clearer understanding of the evolving market landscape and its future potential.
North Sea Decommissioning Oil Rigs Industry Company Market Share
North Sea Decommissioning Oil Rigs Industry Market Report: 2019-2033
This comprehensive report provides a detailed analysis of the North Sea decommissioning oil rigs industry, offering invaluable insights for industry professionals, investors, and strategic planners. The study covers the period 2019-2033, with a focus on the forecast period 2025-2033, using 2025 as the base year. The report segments the market by water depth (shallow water, deepwater, and ultra-deepwater) and analyzes key players such as Aker Solutions ASA, DNV GL, Heerema Marine Contractors (HMC), DeepOcean Group Holding BV, Equinor ASA, Able UK, John Wood Group PLC, TechnipFMC PLC, AF Gruppen SA, and Allseas Group (list not exhaustive). The report's total market value in 2025 is estimated at xx Million.
North Sea Decommissioning Oil Rigs Industry Market Dynamics & Structure
The North Sea decommissioning market exhibits a moderately concentrated structure, with a few large players dominating key segments. Technological innovation, driven by increasing environmental regulations and the need for efficient and cost-effective solutions, is a primary market driver. Stringent regulatory frameworks, including those set by the UK and Norwegian governments, significantly influence operations and investment decisions. The market experiences limited competitive substitution, with specialized expertise and equipment crucial for successful decommissioning projects. End-user demographics primarily consist of oil and gas operators, with a growing involvement of specialized decommissioning contractors. M&A activity has been moderate, with larger players acquiring smaller firms to expand their service offerings and geographical reach. The market in 2025 was estimated at xx Million.
- Market Concentration: Moderately concentrated, with top 5 players holding approximately xx% market share.
- M&A Activity (2019-2024): xx deals completed, with a total value of xx Million.
- Regulatory Landscape: Highly regulated, impacting decommissioning timelines and costs.
- Innovation Barriers: High capital expenditure requirements and technological complexity.
North Sea Decommissioning Oil Rigs Industry Growth Trends & Insights
The North Sea decommissioning market experienced significant growth during the historical period (2019-2024), driven by the aging infrastructure and stricter environmental regulations. The market size is projected to witness substantial expansion during the forecast period (2025-2033), fueled by a large backlog of aging platforms requiring decommissioning. Technological advancements, such as improved remotely operated vehicles (ROVs) and advanced recycling techniques, enhance efficiency and reduce environmental impact. Shifting consumer behavior towards environmentally conscious practices further supports market growth. The Compound Annual Growth Rate (CAGR) for the forecast period is estimated at xx%, reaching a projected market size of xx Million by 2033. Market penetration of advanced technologies is expected to increase from xx% in 2025 to xx% by 2033.
Dominant Regions, Countries, or Segments in North Sea Decommissioning Oil Rigs Industry
The UK sector dominates the North Sea decommissioning market, driven by a large concentration of aging platforms and established decommissioning infrastructure. Deepwater decommissioning projects represent a significant segment, demanding specialized equipment and expertise.
- Key Drivers (UK): High density of aging oil and gas infrastructure, supportive government policies, and established industry expertise.
- Key Drivers (Deepwater): Increasing complexity of deepwater operations, higher decommissioning costs, and the need for advanced technology.
- Market Share (UK): xx% in 2025.
- Growth Potential (Deepwater): xx% CAGR (2025-2033).
North Sea Decommissioning Oil Rigs Industry Product Landscape
The product landscape encompasses a range of services, including platform removal, well plugging and abandonment, subsea decommissioning, and waste management. Recent innovations focus on enhancing efficiency, minimizing environmental impact, and reducing costs. These include advanced robotics, improved recycling technologies, and innovative waste management solutions. Unique selling propositions revolve around specialized expertise, cost-effectiveness, and environmental responsibility. Technological advancements concentrate on automation, remote operations, and data analytics for improved decision-making.
Key Drivers, Barriers & Challenges in North Sea Decommissioning Oil Rigs Industry
Key Drivers: Stringent environmental regulations, aging offshore infrastructure, and government incentives for decommissioning activities are key drivers.
Key Challenges: High decommissioning costs, logistical complexities, technological limitations, and potential supply chain disruptions (estimated impact of xx Million annually on market growth) pose significant challenges. Regulatory uncertainty and permitting processes can also lead to delays and cost overruns.
Emerging Opportunities in North Sea Decommissioning Oil Rigs Industry
Emerging opportunities include the development of innovative recycling technologies, the expansion of decommissioning services into new geographical areas, and the integration of renewable energy solutions during the decommissioning process. The growing emphasis on sustainable practices presents opportunities for environmentally friendly decommissioning techniques. Untapped markets in the reuse and repurposing of decommissioned materials present potential for cost reduction and environmental benefit.
Growth Accelerators in the North Sea Decommissioning Oil Rigs Industry Industry
Technological breakthroughs in robotics, AI, and data analytics are accelerating the efficiency and cost-effectiveness of decommissioning. Strategic partnerships between oil companies, contractors, and technology providers are also driving growth. Furthermore, government initiatives and financial incentives are encouraging investments in the industry.
Key Players Shaping the North Sea Decommissioning Oil Rigs Industry Market
Notable Milestones in North Sea Decommissioning Oil Rigs Industry Sector
- 2021: Introduction of new regulations on waste disposal in the North Sea.
- 2022: Successful completion of a major deepwater platform removal project.
- 2023: Launch of an innovative recycling technology for decommissioned materials.
In-Depth North Sea Decommissioning Oil Rigs Industry Market Outlook
The North Sea decommissioning market is poised for continued growth, driven by a large backlog of aging infrastructure and evolving environmental regulations. Strategic partnerships, technological advancements, and government support will further accelerate market expansion. Opportunities exist in developing sustainable and cost-effective solutions for the growing volume of decommissioning projects. The potential for market expansion in the next decade is significant, driven by technological advancements and increasing regulatory pressure.
North Sea Decommissioning Oil Rigs Industry Segmentation
-
1. Water Depth
- 1.1. Shallow Water
- 1.2. Deepwater and Ultra-deepwater
-
2. Geography
- 2.1. United Kingdom
- 2.2. Norway
- 2.3. Rest of North Sea
North Sea Decommissioning Oil Rigs Industry Segmentation By Geography
- 1. United Kingdom
- 2. Norway
- 3. Rest of North Sea
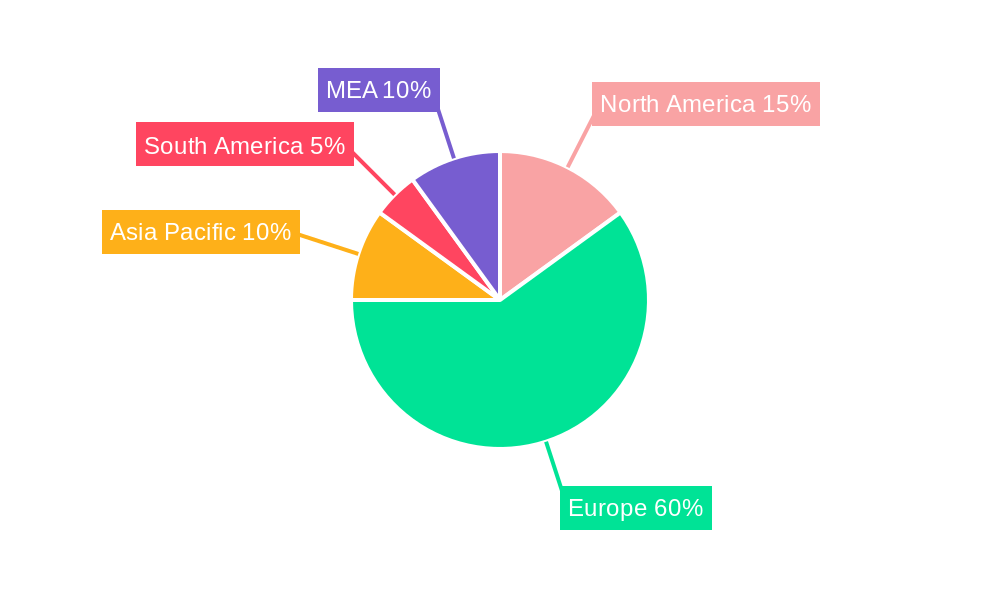
North Sea Decommissioning Oil Rigs Industry Regional Market Share
Geographic Coverage of North Sea Decommissioning Oil Rigs Industry
North Sea Decommissioning Oil Rigs Industry REPORT HIGHLIGHTS
| Aspects | Details |
|---|---|
| Study Period | 2020-2034 |
| Base Year | 2025 |
| Estimated Year | 2026 |
| Forecast Period | 2026-2034 |
| Historical Period | 2020-2025 |
| Growth Rate | CAGR of 8.2% from 2020-2034 |
| Segmentation |
|
Table of Contents
- 1. Introduction
- 1.1. Research Scope
- 1.2. Market Segmentation
- 1.3. Research Objective
- 1.4. Definitions and Assumptions
- 2. Executive Summary
- 2.1. Market Snapshot
- 3. Market Dynamics
- 3.1. Market Drivers
- 3.2. Market Restrains
- 3.3. Market Trends
- 3.4. Market Opportunities
- 4. Market Factor Analysis
- 4.1. Porters Five Forces
- 4.1.1. Bargaining Power of Suppliers
- 4.1.2. Bargaining Power of Buyers
- 4.1.3. Threat of New Entrants
- 4.1.4. Threat of Substitutes
- 4.1.5. Competitive Rivalry
- 4.2. PESTEL analysis
- 4.3. BCG Analysis
- 4.3.1. Stars (High Growth, High Market Share)
- 4.3.2. Cash Cows (Low Growth, High Market Share)
- 4.3.3. Question Mark (High Growth, Low Market Share)
- 4.3.4. Dogs (Low Growth, Low Market Share)
- 4.4. Ansoff Matrix Analysis
- 4.5. Supply Chain Analysis
- 4.6. Regulatory Landscape
- 4.7. Current Market Potential and Opportunity Assessment (TAM–SAM–SOM Framework)
- 4.8. VDR Analyst Note
- 4.1. Porters Five Forces
- 5. Market Analysis, Insights and Forecast 2021-2033
- 5.1. Market Analysis, Insights and Forecast - by Water Depth
- 5.1.1. Shallow Water
- 5.1.2. Deepwater and Ultra-deepwater
- 5.2. Market Analysis, Insights and Forecast - by Geography
- 5.2.1. United Kingdom
- 5.2.2. Norway
- 5.2.3. Rest of North Sea
- 5.3. Market Analysis, Insights and Forecast - by Region
- 5.3.1. United Kingdom
- 5.3.2. Norway
- 5.3.3. Rest of North Sea
- 5.1. Market Analysis, Insights and Forecast - by Water Depth
- 6. Global North Sea Decommissioning Oil Rigs Industry Analysis, Insights and Forecast, 2021-2033
- 6.1. Market Analysis, Insights and Forecast - by Water Depth
- 6.1.1. Shallow Water
- 6.1.2. Deepwater and Ultra-deepwater
- 6.2. Market Analysis, Insights and Forecast - by Geography
- 6.2.1. United Kingdom
- 6.2.2. Norway
- 6.2.3. Rest of North Sea
- 6.1. Market Analysis, Insights and Forecast - by Water Depth
- 7. United Kingdom North Sea Decommissioning Oil Rigs Industry Analysis, Insights and Forecast, 2021-2033
- 7.1. Market Analysis, Insights and Forecast - by Water Depth
- 7.1.1. Shallow Water
- 7.1.2. Deepwater and Ultra-deepwater
- 7.2. Market Analysis, Insights and Forecast - by Geography
- 7.2.1. United Kingdom
- 7.2.2. Norway
- 7.2.3. Rest of North Sea
- 7.1. Market Analysis, Insights and Forecast - by Water Depth
- 8. Norway North Sea Decommissioning Oil Rigs Industry Analysis, Insights and Forecast, 2021-2033
- 8.1. Market Analysis, Insights and Forecast - by Water Depth
- 8.1.1. Shallow Water
- 8.1.2. Deepwater and Ultra-deepwater
- 8.2. Market Analysis, Insights and Forecast - by Geography
- 8.2.1. United Kingdom
- 8.2.2. Norway
- 8.2.3. Rest of North Sea
- 8.1. Market Analysis, Insights and Forecast - by Water Depth
- 9. Rest of North Sea North Sea Decommissioning Oil Rigs Industry Analysis, Insights and Forecast, 2021-2033
- 9.1. Market Analysis, Insights and Forecast - by Water Depth
- 9.1.1. Shallow Water
- 9.1.2. Deepwater and Ultra-deepwater
- 9.2. Market Analysis, Insights and Forecast - by Geography
- 9.2.1. United Kingdom
- 9.2.2. Norway
- 9.2.3. Rest of North Sea
- 9.1. Market Analysis, Insights and Forecast - by Water Depth
- 10. Competitive Analysis
- 10.1. Company Profiles
- 10.1.1 Aker Solutions ASA
- 10.1.1.1. Company Overview
- 10.1.1.2. Products
- 10.1.1.3. Company Financials
- 10.1.1.4. SWOT Analysis
- 10.1.2 DNV GL
- 10.1.2.1. Company Overview
- 10.1.2.2. Products
- 10.1.2.3. Company Financials
- 10.1.2.4. SWOT Analysis
- 10.1.3 Heerema Marine Contractors (HMC)
- 10.1.3.1. Company Overview
- 10.1.3.2. Products
- 10.1.3.3. Company Financials
- 10.1.3.4. SWOT Analysis
- 10.1.4 DeepOcean Group Holding BV
- 10.1.4.1. Company Overview
- 10.1.4.2. Products
- 10.1.4.3. Company Financials
- 10.1.4.4. SWOT Analysis
- 10.1.5 Equinor ASA*List Not Exhaustive
- 10.1.5.1. Company Overview
- 10.1.5.2. Products
- 10.1.5.3. Company Financials
- 10.1.5.4. SWOT Analysis
- 10.1.6 Able UK
- 10.1.6.1. Company Overview
- 10.1.6.2. Products
- 10.1.6.3. Company Financials
- 10.1.6.4. SWOT Analysis
- 10.1.7 John Wood Group PLC
- 10.1.7.1. Company Overview
- 10.1.7.2. Products
- 10.1.7.3. Company Financials
- 10.1.7.4. SWOT Analysis
- 10.1.8 TechnipFMC PLC
- 10.1.8.1. Company Overview
- 10.1.8.2. Products
- 10.1.8.3. Company Financials
- 10.1.8.4. SWOT Analysis
- 10.1.9 AF Gruppen SA
- 10.1.9.1. Company Overview
- 10.1.9.2. Products
- 10.1.9.3. Company Financials
- 10.1.9.4. SWOT Analysis
- 10.1.10 Allseas Group
- 10.1.10.1. Company Overview
- 10.1.10.2. Products
- 10.1.10.3. Company Financials
- 10.1.10.4. SWOT Analysis
- 10.1.1 Aker Solutions ASA
- 10.2. Market Entropy
- 10.2.1 Company's Key Areas Served
- 10.2.2 Recent Developments
- 10.3. Company Market Share Analysis 2025
- 10.3.1 Top 5 Companies Market Share Analysis
- 10.3.2 Top 3 Companies Market Share Analysis
- 10.4. List of Potential Customers
- 11. Research Methodology
List of Figures
- Figure 1: Global North Sea Decommissioning Oil Rigs Industry Revenue Breakdown (undefined, %) by Region 2025 & 2033
- Figure 2: United Kingdom North Sea Decommissioning Oil Rigs Industry Revenue (undefined), by Water Depth 2025 & 2033
- Figure 3: United Kingdom North Sea Decommissioning Oil Rigs Industry Revenue Share (%), by Water Depth 2025 & 2033
- Figure 4: United Kingdom North Sea Decommissioning Oil Rigs Industry Revenue (undefined), by Geography 2025 & 2033
- Figure 5: United Kingdom North Sea Decommissioning Oil Rigs Industry Revenue Share (%), by Geography 2025 & 2033
- Figure 6: United Kingdom North Sea Decommissioning Oil Rigs Industry Revenue (undefined), by Country 2025 & 2033
- Figure 7: United Kingdom North Sea Decommissioning Oil Rigs Industry Revenue Share (%), by Country 2025 & 2033
- Figure 8: Norway North Sea Decommissioning Oil Rigs Industry Revenue (undefined), by Water Depth 2025 & 2033
- Figure 9: Norway North Sea Decommissioning Oil Rigs Industry Revenue Share (%), by Water Depth 2025 & 2033
- Figure 10: Norway North Sea Decommissioning Oil Rigs Industry Revenue (undefined), by Geography 2025 & 2033
- Figure 11: Norway North Sea Decommissioning Oil Rigs Industry Revenue Share (%), by Geography 2025 & 2033
- Figure 12: Norway North Sea Decommissioning Oil Rigs Industry Revenue (undefined), by Country 2025 & 2033
- Figure 13: Norway North Sea Decommissioning Oil Rigs Industry Revenue Share (%), by Country 2025 & 2033
- Figure 14: Rest of North Sea North Sea Decommissioning Oil Rigs Industry Revenue (undefined), by Water Depth 2025 & 2033
- Figure 15: Rest of North Sea North Sea Decommissioning Oil Rigs Industry Revenue Share (%), by Water Depth 2025 & 2033
- Figure 16: Rest of North Sea North Sea Decommissioning Oil Rigs Industry Revenue (undefined), by Geography 2025 & 2033
- Figure 17: Rest of North Sea North Sea Decommissioning Oil Rigs Industry Revenue Share (%), by Geography 2025 & 2033
- Figure 18: Rest of North Sea North Sea Decommissioning Oil Rigs Industry Revenue (undefined), by Country 2025 & 2033
- Figure 19: Rest of North Sea North Sea Decommissioning Oil Rigs Industry Revenue Share (%), by Country 2025 & 2033
List of Tables
- Table 1: Global North Sea Decommissioning Oil Rigs Industry Revenue undefined Forecast, by Water Depth 2020 & 2033
- Table 2: Global North Sea Decommissioning Oil Rigs Industry Revenue undefined Forecast, by Geography 2020 & 2033
- Table 3: Global North Sea Decommissioning Oil Rigs Industry Revenue undefined Forecast, by Region 2020 & 2033
- Table 4: Global North Sea Decommissioning Oil Rigs Industry Revenue undefined Forecast, by Water Depth 2020 & 2033
- Table 5: Global North Sea Decommissioning Oil Rigs Industry Revenue undefined Forecast, by Geography 2020 & 2033
- Table 6: Global North Sea Decommissioning Oil Rigs Industry Revenue undefined Forecast, by Country 2020 & 2033
- Table 7: Global North Sea Decommissioning Oil Rigs Industry Revenue undefined Forecast, by Water Depth 2020 & 2033
- Table 8: Global North Sea Decommissioning Oil Rigs Industry Revenue undefined Forecast, by Geography 2020 & 2033
- Table 9: Global North Sea Decommissioning Oil Rigs Industry Revenue undefined Forecast, by Country 2020 & 2033
- Table 10: Global North Sea Decommissioning Oil Rigs Industry Revenue undefined Forecast, by Water Depth 2020 & 2033
- Table 11: Global North Sea Decommissioning Oil Rigs Industry Revenue undefined Forecast, by Geography 2020 & 2033
- Table 12: Global North Sea Decommissioning Oil Rigs Industry Revenue undefined Forecast, by Country 2020 & 2033
Frequently Asked Questions
1. What is the projected Compound Annual Growth Rate (CAGR) of the North Sea Decommissioning Oil Rigs Industry?
The projected CAGR is approximately 8.2%.
2. Which companies are prominent players in the North Sea Decommissioning Oil Rigs Industry?
Key companies in the market include Aker Solutions ASA, DNV GL, Heerema Marine Contractors (HMC), DeepOcean Group Holding BV, Equinor ASA*List Not Exhaustive, Able UK, John Wood Group PLC, TechnipFMC PLC, AF Gruppen SA, Allseas Group.
3. What are the main segments of the North Sea Decommissioning Oil Rigs Industry?
The market segments include Water Depth, Geography.
4. Can you provide details about the market size?
The market size is estimated to be USD XXX N/A as of 2022.
5. What are some drivers contributing to market growth?
4.; Increasing Demand for Secure. Sustainable. and Clean Energy.
6. What are the notable trends driving market growth?
Shallow Water to Dominate the Market.
7. Are there any restraints impacting market growth?
4.; High Cost of Production of Biofuels.
8. Can you provide examples of recent developments in the market?
N/A
9. What pricing options are available for accessing the report?
Pricing options include single-user, multi-user, and enterprise licenses priced at USD 4750, USD 5250, and USD 8750 respectively.
10. Is the market size provided in terms of value or volume?
The market size is provided in terms of value, measured in N/A.
11. Are there any specific market keywords associated with the report?
Yes, the market keyword associated with the report is "North Sea Decommissioning Oil Rigs Industry," which aids in identifying and referencing the specific market segment covered.
12. How do I determine which pricing option suits my needs best?
The pricing options vary based on user requirements and access needs. Individual users may opt for single-user licenses, while businesses requiring broader access may choose multi-user or enterprise licenses for cost-effective access to the report.
13. Are there any additional resources or data provided in the North Sea Decommissioning Oil Rigs Industry report?
While the report offers comprehensive insights, it's advisable to review the specific contents or supplementary materials provided to ascertain if additional resources or data are available.
14. How can I stay updated on further developments or reports in the North Sea Decommissioning Oil Rigs Industry?
To stay informed about further developments, trends, and reports in the North Sea Decommissioning Oil Rigs Industry, consider subscribing to industry newsletters, following relevant companies and organizations, or regularly checking reputable industry news sources and publications.
Methodology
Step 1 - Identification of Relevant Samples Size from Population Database


Step 2 - Approaches for Defining Global Market Size (Value, Volume* & Price*)

Note*: In applicable scenarios
Step 3 - Data Sources
Primary Research
- Web Analytics
- Survey Reports
- Research Institute
- Latest Research Reports
- Opinion Leaders
Secondary Research
- Annual Reports
- White Paper
- Latest Press Release
- Industry Association
- Paid Database
- Investor Presentations

Step 4 - Data Triangulation
Involves using different sources of information in order to increase the validity of a study
These sources are likely to be stakeholders in a program - participants, other researchers, program staff, other community members, and so on.
Then we put all data in single framework & apply various statistical tools to find out the dynamic on the market.
During the analysis stage, feedback from the stakeholder groups would be compared to determine areas of agreement as well as areas of divergence