

Key Insights
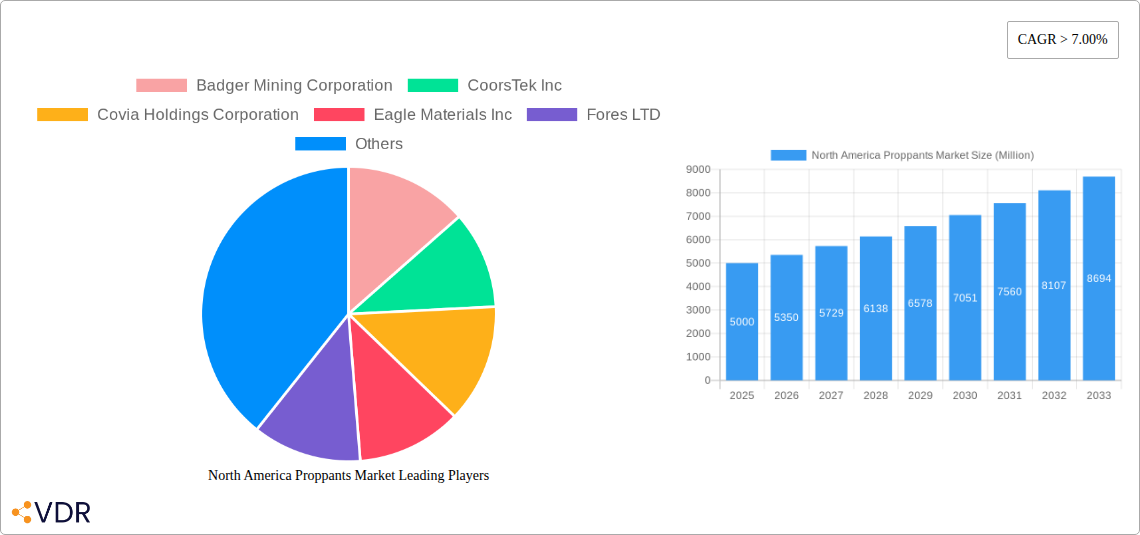
The North America Proppants Market is poised for significant expansion, projected to reach $6.59 billion by 2025. The market is anticipated to grow at a compound annual growth rate (CAGR) of 16.02% through 2033. This robust growth is propelled by the revitalization of North American shale oil and gas production, particularly in key regions such as the Permian and Marcellus basins. Escalating hydraulic fracturing operations, fundamental to unconventional resource extraction, are driving demand for proppants, crucial for sustaining fracture conductivity and optimizing hydrocarbon recovery. Innovations in proppant manufacturing, aimed at improving strength and efficiency, are further accelerating market expansion. While supply chain volatility and fluctuating commodity prices present potential headwinds, the sustained investment in exploration and production, coupled with an increasing focus on energy security, underpins a positive long-term market outlook.
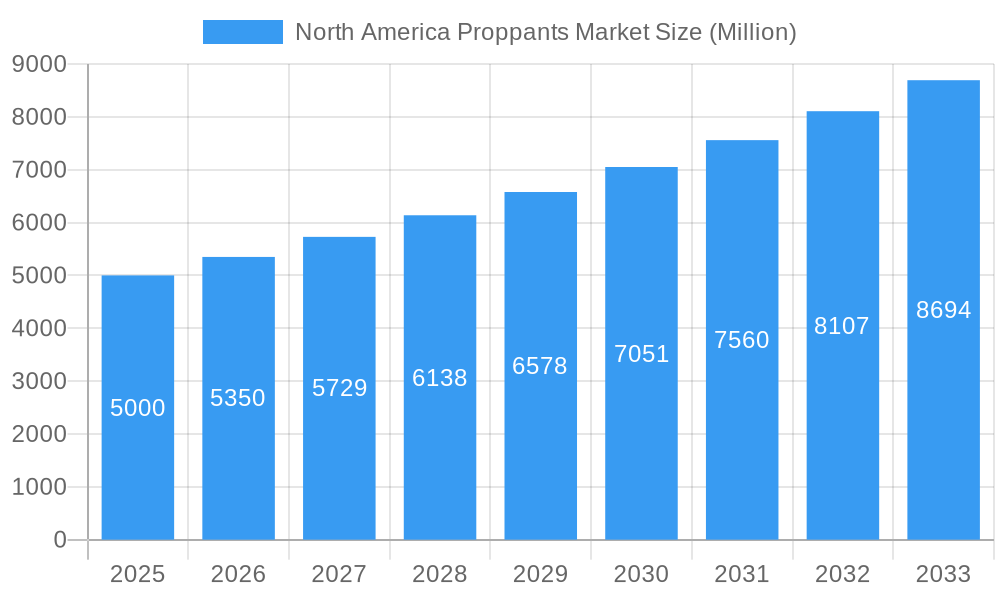
North America Proppants Market Market Size (In Billion)
Market segmentation is primarily categorized by proppant type (sand, ceramic, resin-coated), application (horizontal and vertical drilling), and specific regional markets within North America. Leading industry participants, including Badger Mining Corporation, CoorsTek Inc., and US Silica, are strategically enhancing production capacity and advancing product development to leverage emerging market opportunities. The competitive environment features established leaders and new entrants, fostering intense competition and continuous technological advancement. Regional disparities in shale oil and gas output directly influence proppant demand, with certain areas exhibiting accelerated growth rates. Future market trajectory will be contingent on the sustained pace of oil and gas extraction, evolving government regulations governing energy exploration, and the price stability of oil and natural gas.
North America Proppants Market Company Market Share
North America Proppants Market: A Comprehensive Report (2019-2033)
This comprehensive report provides an in-depth analysis of the North America proppants market, encompassing market dynamics, growth trends, regional segmentation, product landscape, key players, and future outlook. The study period covers 2019-2033, with 2025 as the base and estimated year. This report is crucial for industry professionals, investors, and strategic decision-makers seeking a granular understanding of this vital segment of the oil and gas industry and its parent market, the North American Energy sector. The child market specifically focuses on hydraulic fracturing proppants.
Parent Market: North American Energy Market Child Market: Hydraulic Fracturing Proppants
Market Size (Million Units):
- 2019: xx
- 2020: xx
- 2021: xx
- 2022: xx
- 2023: xx
- 2024: xx
- 2025 (Estimated): xx
- 2033 (Forecast): xx
North America Proppants Market Dynamics & Structure
The North America proppants market exhibits a moderately concentrated structure, with several major players holding significant market share. Technological innovation, primarily focused on enhancing proppant performance and efficiency (e.g., resin-coated proppants), is a key driver. Regulatory frameworks related to environmental protection and waste management influence market dynamics, particularly concerning silica sand extraction and disposal. The market faces competition from alternative well completion technologies, although proppants remain crucial for hydraulic fracturing. End-user demographics are heavily weighted towards oil and gas exploration and production companies, with activity levels directly impacting proppant demand. M&A activity has been notable, with several significant transactions shaping the competitive landscape.
- Market Concentration: Moderately concentrated, with top 5 players holding approximately 60% market share (estimated).
- Technological Innovation: Focus on resin-coated proppants, enhanced strength and conductivity materials.
- Regulatory Framework: Environmental regulations on sand mining and waste disposal.
- Competitive Substitutes: Alternative well completion techniques (e.g., slickwater fracturing).
- End-User Demographics: Primarily oil and gas exploration and production companies.
- M&A Trends: Significant consolidation activity observed in recent years, with approximately xx M&A deals in the past 5 years (estimated). Innovation barriers primarily relate to high R&D costs and regulatory compliance.
North America Proppants Market Growth Trends & Insights
The North America proppants market has experienced significant growth over the past few years, primarily driven by the resurgence of shale gas and oil production. The market size is projected to increase at a Compound Annual Growth Rate (CAGR) of xx% during the forecast period (2025-2033). Adoption rates of advanced proppants, such as resin-coated proppants, have been steadily rising due to their superior performance. Technological disruptions, including the development of more efficient fracturing techniques and improved proppant manufacturing processes, contribute to market expansion. Shifts in consumer behavior towards environmentally sustainable practices are also influencing the market, leading to increased demand for proppants with reduced environmental impact. Market penetration of resin-coated proppants is projected to reach xx% by 2033.
Dominant Regions, Countries, or Segments in North America Proppants Market
The Permian Basin in the United States remains the dominant region for proppant consumption, driven by extensive shale oil and gas production activities. Texas and New Mexico are key states within this basin, benefiting from robust infrastructure, favorable regulatory environments, and abundant resources. The Eagle Ford Shale in Texas also contributes significantly to proppant demand. The Bakken Shale in North Dakota and Montana presents a substantial growth opportunity, although subject to cyclical changes in oil prices.
- Key Drivers: Abundant shale resources, robust oil and gas production activity, existing infrastructure.
- Dominance Factors: High concentration of shale formations, established supply chains, favorable government policies.
- Growth Potential: Continued investment in shale gas and oil production, exploration of new shale formations. Market share for the Permian Basin is estimated at approximately xx%.
North America Proppants Market Product Landscape
The North America proppants market encompasses a range of products, including ceramic proppants, sand proppants, and resin-coated proppants. Resin-coated proppants are gaining traction due to their enhanced strength, conductivity, and ability to withstand high pressures. Technological advancements focus on improving proppant durability, conductivity, and cost-effectiveness. Unique selling propositions often center around superior performance metrics, including higher fracture conductivity and proppant pack integrity.
Key Drivers, Barriers & Challenges in North America Proppants Market
Key Drivers:
- Increased oil and gas production in shale formations.
- Growing adoption of hydraulic fracturing.
- Technological advancements in proppant design and manufacturing.
Key Challenges & Restraints:
- Fluctuations in oil and gas prices impacting demand.
- Environmental concerns related to sand mining and waste disposal. (Estimated xx% reduction in demand due to stricter environmental regulations predicted by 2030).
- Competition from alternative well completion methods.
Emerging Opportunities in North America Proppants Market
- Development of proppants with enhanced environmental sustainability.
- Expansion into unconventional resource plays (e.g., tight gas and oil).
- Increasing demand for higher-performance proppants in complex geological formations.
Growth Accelerators in the North America Proppants Market Industry
Long-term growth in the North America proppants market will be fueled by continued technological innovations, strategic partnerships to optimize supply chains and reduce costs, and expansion into new and emerging markets, specifically those focused on sustainable proppant alternatives.
Key Players Shaping the North America Proppants Market Market
- Badger Mining Corporation
- CoorsTek Inc
- Covia Holdings Corporation
- Eagle Materials Inc
- Fores LTD
- Halliburton
- Hexion
- Hi-Crush
- Imerys
- Preferred Proppants LLC
- Saint-Gobain
- Schlumberger Limited
- Superior Silica Sands (Emerge Energy Services)
- US SILICA
- WAYFINDER
Notable Milestones in North America Proppants Market Sector
- September 2022: Hexion Inc. and Wayfinder Corp partnered to better serve resin-coated proppant users in the Western Canadian Sedimentary Basin.
- October 2021: U.S. Silica announced the exploration of separating its non-oil and gas division.
In-Depth North America Proppants Market Market Outlook
The North America proppants market is poised for continued growth, driven by the increasing demand for oil and gas, along with the ongoing development of innovative proppant technologies. Strategic partnerships and investments in research and development will play a vital role in shaping the future of this market. Companies focusing on sustainability and cost-effective solutions will likely gain a competitive advantage. The market holds significant potential for expansion into emerging shale plays and international markets.
North America Proppants Market Segmentation
-
1. Type
- 1.1. Frac Sand
- 1.2. Resin Coated
- 1.3. Ceramic
-
2. Geography
- 2.1. United States
- 2.2. Canada
- 2.3. Mexico
North America Proppants Market Segmentation By Geography
- 1. United States
- 2. Canada
- 3. Mexico
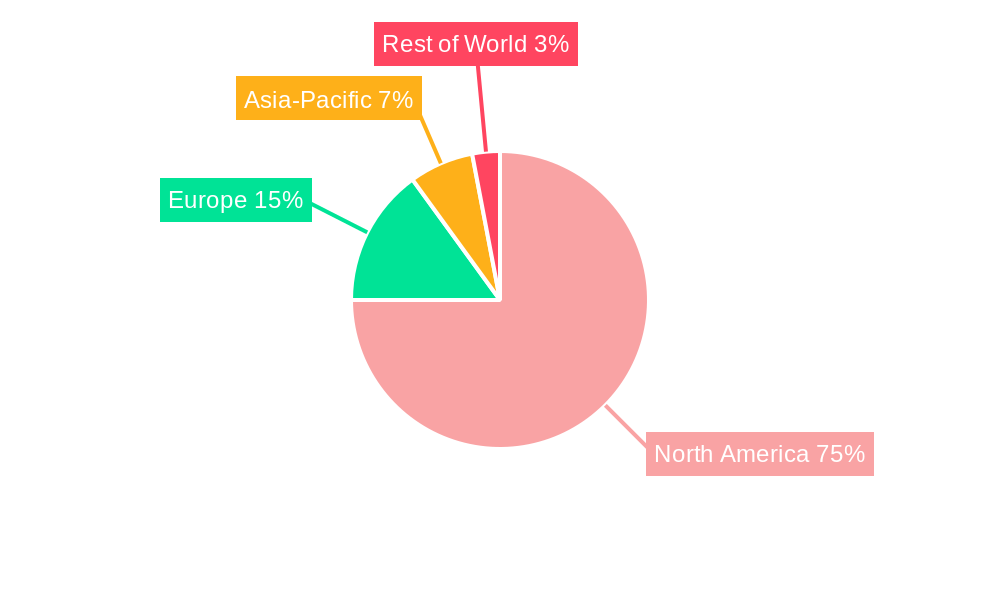
North America Proppants Market Regional Market Share
Geographic Coverage of North America Proppants Market
North America Proppants Market REPORT HIGHLIGHTS
| Aspects | Details |
|---|---|
| Study Period | 2020-2034 |
| Base Year | 2025 |
| Estimated Year | 2026 |
| Forecast Period | 2026-2034 |
| Historical Period | 2020-2025 |
| Growth Rate | CAGR of 16.02% from 2020-2034 |
| Segmentation |
|
Table of Contents
- 1. Introduction
- 1.1. Research Scope
- 1.2. Market Segmentation
- 1.3. Research Objective
- 1.4. Definitions and Assumptions
- 2. Executive Summary
- 2.1. Market Snapshot
- 3. Market Dynamics
- 3.1. Market Drivers
- 3.2. Market Restrains
- 3.3. Market Trends
- 3.4. Market Opportunities
- 4. Market Factor Analysis
- 4.1. Porters Five Forces
- 4.1.1. Bargaining Power of Suppliers
- 4.1.2. Bargaining Power of Buyers
- 4.1.3. Threat of New Entrants
- 4.1.4. Threat of Substitutes
- 4.1.5. Competitive Rivalry
- 4.2. PESTEL analysis
- 4.3. BCG Analysis
- 4.3.1. Stars (High Growth, High Market Share)
- 4.3.2. Cash Cows (Low Growth, High Market Share)
- 4.3.3. Question Mark (High Growth, Low Market Share)
- 4.3.4. Dogs (Low Growth, Low Market Share)
- 4.4. Ansoff Matrix Analysis
- 4.5. Supply Chain Analysis
- 4.6. Regulatory Landscape
- 4.7. Current Market Potential and Opportunity Assessment (TAM–SAM–SOM Framework)
- 4.8. VDR Analyst Note
- 4.1. Porters Five Forces
- 5. Market Analysis, Insights and Forecast 2021-2033
- 5.1. Market Analysis, Insights and Forecast - by Type
- 5.1.1. Frac Sand
- 5.1.2. Resin Coated
- 5.1.3. Ceramic
- 5.2. Market Analysis, Insights and Forecast - by Geography
- 5.2.1. United States
- 5.2.2. Canada
- 5.2.3. Mexico
- 5.3. Market Analysis, Insights and Forecast - by Region
- 5.3.1. United States
- 5.3.2. Canada
- 5.3.3. Mexico
- 5.1. Market Analysis, Insights and Forecast - by Type
- 6. Global North America Proppants Market Analysis, Insights and Forecast, 2021-2033
- 6.1. Market Analysis, Insights and Forecast - by Type
- 6.1.1. Frac Sand
- 6.1.2. Resin Coated
- 6.1.3. Ceramic
- 6.2. Market Analysis, Insights and Forecast - by Geography
- 6.2.1. United States
- 6.2.2. Canada
- 6.2.3. Mexico
- 6.1. Market Analysis, Insights and Forecast - by Type
- 7. United States North America Proppants Market Analysis, Insights and Forecast, 2021-2033
- 7.1. Market Analysis, Insights and Forecast - by Type
- 7.1.1. Frac Sand
- 7.1.2. Resin Coated
- 7.1.3. Ceramic
- 7.2. Market Analysis, Insights and Forecast - by Geography
- 7.2.1. United States
- 7.2.2. Canada
- 7.2.3. Mexico
- 7.1. Market Analysis, Insights and Forecast - by Type
- 8. Canada North America Proppants Market Analysis, Insights and Forecast, 2021-2033
- 8.1. Market Analysis, Insights and Forecast - by Type
- 8.1.1. Frac Sand
- 8.1.2. Resin Coated
- 8.1.3. Ceramic
- 8.2. Market Analysis, Insights and Forecast - by Geography
- 8.2.1. United States
- 8.2.2. Canada
- 8.2.3. Mexico
- 8.1. Market Analysis, Insights and Forecast - by Type
- 9. Mexico North America Proppants Market Analysis, Insights and Forecast, 2021-2033
- 9.1. Market Analysis, Insights and Forecast - by Type
- 9.1.1. Frac Sand
- 9.1.2. Resin Coated
- 9.1.3. Ceramic
- 9.2. Market Analysis, Insights and Forecast - by Geography
- 9.2.1. United States
- 9.2.2. Canada
- 9.2.3. Mexico
- 9.1. Market Analysis, Insights and Forecast - by Type
- 10. Competitive Analysis
- 10.1. Company Profiles
- 10.1.1 Badger Mining Corporation
- 10.1.1.1. Company Overview
- 10.1.1.2. Products
- 10.1.1.3. Company Financials
- 10.1.1.4. SWOT Analysis
- 10.1.2 CoorsTek Inc
- 10.1.2.1. Company Overview
- 10.1.2.2. Products
- 10.1.2.3. Company Financials
- 10.1.2.4. SWOT Analysis
- 10.1.3 Covia Holdings Corporation
- 10.1.3.1. Company Overview
- 10.1.3.2. Products
- 10.1.3.3. Company Financials
- 10.1.3.4. SWOT Analysis
- 10.1.4 Eagle Materials Inc
- 10.1.4.1. Company Overview
- 10.1.4.2. Products
- 10.1.4.3. Company Financials
- 10.1.4.4. SWOT Analysis
- 10.1.5 Fores LTD
- 10.1.5.1. Company Overview
- 10.1.5.2. Products
- 10.1.5.3. Company Financials
- 10.1.5.4. SWOT Analysis
- 10.1.6 Halliburton
- 10.1.6.1. Company Overview
- 10.1.6.2. Products
- 10.1.6.3. Company Financials
- 10.1.6.4. SWOT Analysis
- 10.1.7 Hexion
- 10.1.7.1. Company Overview
- 10.1.7.2. Products
- 10.1.7.3. Company Financials
- 10.1.7.4. SWOT Analysis
- 10.1.8 Hi-Crush
- 10.1.8.1. Company Overview
- 10.1.8.2. Products
- 10.1.8.3. Company Financials
- 10.1.8.4. SWOT Analysis
- 10.1.9 Imerys
- 10.1.9.1. Company Overview
- 10.1.9.2. Products
- 10.1.9.3. Company Financials
- 10.1.9.4. SWOT Analysis
- 10.1.10 Preferred Proppants LLC
- 10.1.10.1. Company Overview
- 10.1.10.2. Products
- 10.1.10.3. Company Financials
- 10.1.10.4. SWOT Analysis
- 10.1.11 Saint-Gobain
- 10.1.11.1. Company Overview
- 10.1.11.2. Products
- 10.1.11.3. Company Financials
- 10.1.11.4. SWOT Analysis
- 10.1.12 Schlumberger Limited
- 10.1.12.1. Company Overview
- 10.1.12.2. Products
- 10.1.12.3. Company Financials
- 10.1.12.4. SWOT Analysis
- 10.1.13 Superior Silica Sands (Emerge Energy Services)
- 10.1.13.1. Company Overview
- 10.1.13.2. Products
- 10.1.13.3. Company Financials
- 10.1.13.4. SWOT Analysis
- 10.1.14 US SILICA
- 10.1.14.1. Company Overview
- 10.1.14.2. Products
- 10.1.14.3. Company Financials
- 10.1.14.4. SWOT Analysis
- 10.1.15 WAYFINDER*List Not Exhaustive
- 10.1.15.1. Company Overview
- 10.1.15.2. Products
- 10.1.15.3. Company Financials
- 10.1.15.4. SWOT Analysis
- 10.1.1 Badger Mining Corporation
- 10.2. Market Entropy
- 10.2.1 Company's Key Areas Served
- 10.2.2 Recent Developments
- 10.3. Company Market Share Analysis 2025
- 10.3.1 Top 5 Companies Market Share Analysis
- 10.3.2 Top 3 Companies Market Share Analysis
- 10.4. List of Potential Customers
- 11. Research Methodology
List of Figures
- Figure 1: Global North America Proppants Market Revenue Breakdown (billion, %) by Region 2025 & 2033
- Figure 2: United States North America Proppants Market Revenue (billion), by Type 2025 & 2033
- Figure 3: United States North America Proppants Market Revenue Share (%), by Type 2025 & 2033
- Figure 4: United States North America Proppants Market Revenue (billion), by Geography 2025 & 2033
- Figure 5: United States North America Proppants Market Revenue Share (%), by Geography 2025 & 2033
- Figure 6: United States North America Proppants Market Revenue (billion), by Country 2025 & 2033
- Figure 7: United States North America Proppants Market Revenue Share (%), by Country 2025 & 2033
- Figure 8: Canada North America Proppants Market Revenue (billion), by Type 2025 & 2033
- Figure 9: Canada North America Proppants Market Revenue Share (%), by Type 2025 & 2033
- Figure 10: Canada North America Proppants Market Revenue (billion), by Geography 2025 & 2033
- Figure 11: Canada North America Proppants Market Revenue Share (%), by Geography 2025 & 2033
- Figure 12: Canada North America Proppants Market Revenue (billion), by Country 2025 & 2033
- Figure 13: Canada North America Proppants Market Revenue Share (%), by Country 2025 & 2033
- Figure 14: Mexico North America Proppants Market Revenue (billion), by Type 2025 & 2033
- Figure 15: Mexico North America Proppants Market Revenue Share (%), by Type 2025 & 2033
- Figure 16: Mexico North America Proppants Market Revenue (billion), by Geography 2025 & 2033
- Figure 17: Mexico North America Proppants Market Revenue Share (%), by Geography 2025 & 2033
- Figure 18: Mexico North America Proppants Market Revenue (billion), by Country 2025 & 2033
- Figure 19: Mexico North America Proppants Market Revenue Share (%), by Country 2025 & 2033
List of Tables
- Table 1: Global North America Proppants Market Revenue billion Forecast, by Type 2020 & 2033
- Table 2: Global North America Proppants Market Revenue billion Forecast, by Geography 2020 & 2033
- Table 3: Global North America Proppants Market Revenue billion Forecast, by Region 2020 & 2033
- Table 4: Global North America Proppants Market Revenue billion Forecast, by Type 2020 & 2033
- Table 5: Global North America Proppants Market Revenue billion Forecast, by Geography 2020 & 2033
- Table 6: Global North America Proppants Market Revenue billion Forecast, by Country 2020 & 2033
- Table 7: Global North America Proppants Market Revenue billion Forecast, by Type 2020 & 2033
- Table 8: Global North America Proppants Market Revenue billion Forecast, by Geography 2020 & 2033
- Table 9: Global North America Proppants Market Revenue billion Forecast, by Country 2020 & 2033
- Table 10: Global North America Proppants Market Revenue billion Forecast, by Type 2020 & 2033
- Table 11: Global North America Proppants Market Revenue billion Forecast, by Geography 2020 & 2033
- Table 12: Global North America Proppants Market Revenue billion Forecast, by Country 2020 & 2033
Frequently Asked Questions
1. What is the projected Compound Annual Growth Rate (CAGR) of the North America Proppants Market?
The projected CAGR is approximately 16.02%.
2. Which companies are prominent players in the North America Proppants Market?
Key companies in the market include Badger Mining Corporation, CoorsTek Inc, Covia Holdings Corporation, Eagle Materials Inc, Fores LTD, Halliburton, Hexion, Hi-Crush, Imerys, Preferred Proppants LLC, Saint-Gobain, Schlumberger Limited, Superior Silica Sands (Emerge Energy Services), US SILICA, WAYFINDER*List Not Exhaustive.
3. What are the main segments of the North America Proppants Market?
The market segments include Type, Geography.
4. Can you provide details about the market size?
The market size is estimated to be USD 6.59 billion as of 2022.
5. What are some drivers contributing to market growth?
Improvements in Fracking Technology; Increasing Usage of Frac Sand (Quantity per Well); Increasing Shale Gas Production Activities.
6. What are the notable trends driving market growth?
Frac Sand to Dominate the Market.
7. Are there any restraints impacting market growth?
Improvements in Fracking Technology; Increasing Usage of Frac Sand (Quantity per Well); Increasing Shale Gas Production Activities.
8. Can you provide examples of recent developments in the market?
In September 2022, Hexion Inc. and Wayfinder Corp partnered to better serve resin-coated proppant users in the Western Canadian Sedimentary Basin. This strategic partnership joined Hexion's leading resin and chemical expertise with Wayfinder's new state-of-the-art manufacturing facility and logistics network.
9. What pricing options are available for accessing the report?
Pricing options include single-user, multi-user, and enterprise licenses priced at USD 4750, USD 5250, and USD 8750 respectively.
10. Is the market size provided in terms of value or volume?
The market size is provided in terms of value, measured in billion.
11. Are there any specific market keywords associated with the report?
Yes, the market keyword associated with the report is "North America Proppants Market," which aids in identifying and referencing the specific market segment covered.
12. How do I determine which pricing option suits my needs best?
The pricing options vary based on user requirements and access needs. Individual users may opt for single-user licenses, while businesses requiring broader access may choose multi-user or enterprise licenses for cost-effective access to the report.
13. Are there any additional resources or data provided in the North America Proppants Market report?
While the report offers comprehensive insights, it's advisable to review the specific contents or supplementary materials provided to ascertain if additional resources or data are available.
14. How can I stay updated on further developments or reports in the North America Proppants Market?
To stay informed about further developments, trends, and reports in the North America Proppants Market, consider subscribing to industry newsletters, following relevant companies and organizations, or regularly checking reputable industry news sources and publications.
Methodology
Step 1 - Identification of Relevant Samples Size from Population Database


Step 2 - Approaches for Defining Global Market Size (Value, Volume* & Price*)

Note*: In applicable scenarios
Step 3 - Data Sources
Primary Research
- Web Analytics
- Survey Reports
- Research Institute
- Latest Research Reports
- Opinion Leaders
Secondary Research
- Annual Reports
- White Paper
- Latest Press Release
- Industry Association
- Paid Database
- Investor Presentations

Step 4 - Data Triangulation
Involves using different sources of information in order to increase the validity of a study
These sources are likely to be stakeholders in a program - participants, other researchers, program staff, other community members, and so on.
Then we put all data in single framework & apply various statistical tools to find out the dynamic on the market.
During the analysis stage, feedback from the stakeholder groups would be compared to determine areas of agreement as well as areas of divergence