

Key Insights
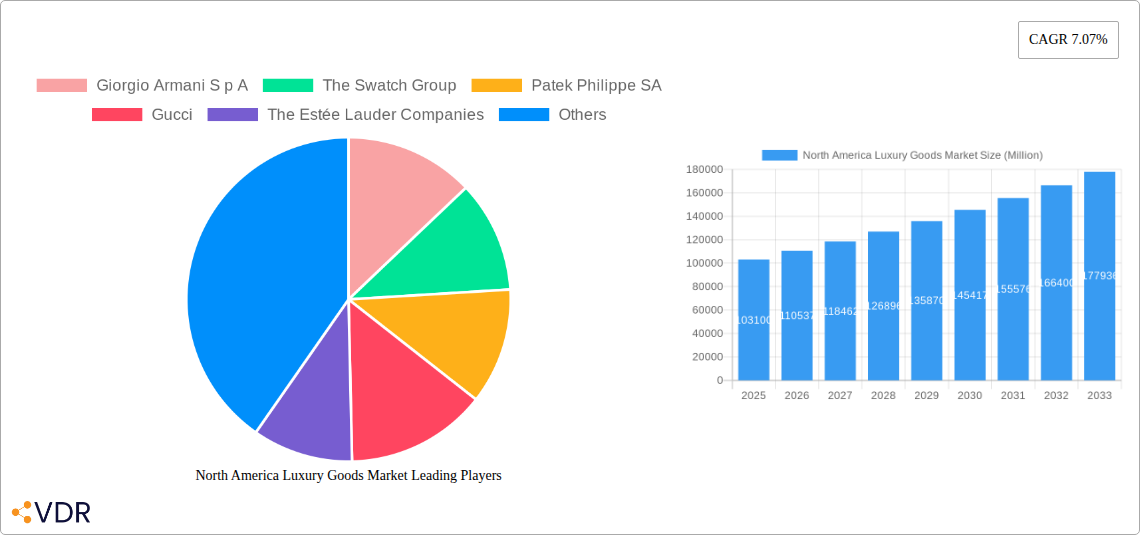
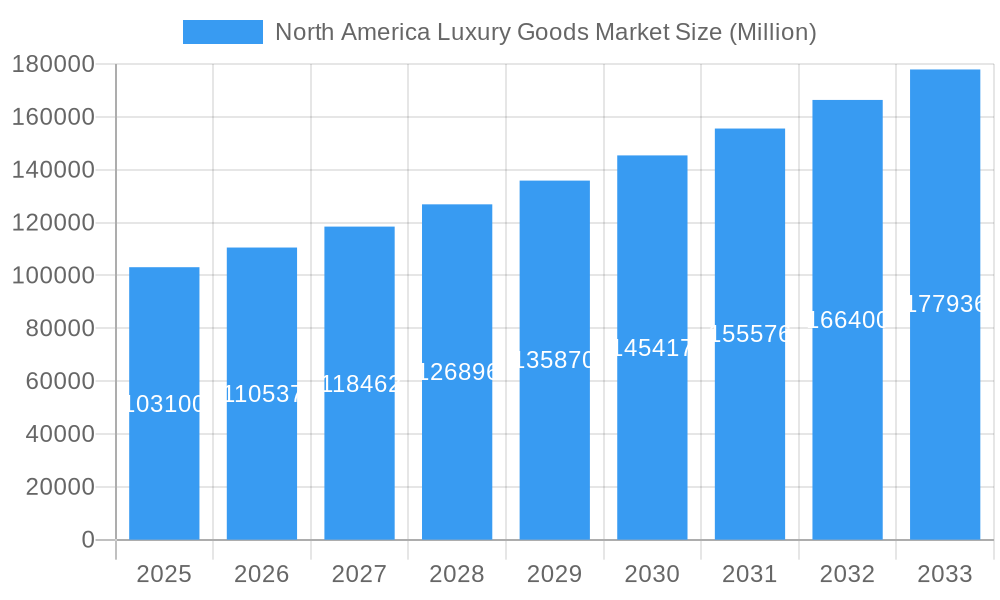
The North American luxury goods market, valued at $103.10 billion in 2025, is projected to experience robust growth, exhibiting a Compound Annual Growth Rate (CAGR) of 7.07% from 2025 to 2033. This expansion is fueled by several key factors. A rising high-net-worth individual (HNWI) population within the United States, Canada, and Mexico, coupled with increased disposable income and a growing preference for aspirational purchases, significantly contributes to market growth. Furthermore, the burgeoning e-commerce sector and the strategic omnichannel approaches adopted by luxury brands are expanding market reach and enhancing customer experience. The market's segmentation, encompassing diverse product categories like clothing and apparel, footwear, bags, jewelry, watches, and other luxury items, along with various distribution channels including single-branded stores, multi-brand stores, and thriving online platforms, provides substantial avenues for growth and market diversification. Brand loyalty and the enduring appeal of established luxury houses, combined with the emergence of innovative and digitally savvy luxury brands, contribute to market dynamism.
North America Luxury Goods Market Market Size (In Billion)
However, macroeconomic factors such as inflation and potential economic downturns pose potential restraints. Fluctuations in currency exchange rates can also impact import/export dynamics and pricing strategies within the market. Competitive pressures, including the emergence of counterfeit goods and the need to maintain brand exclusivity, present ongoing challenges. Successfully navigating these challenges will require luxury brands to focus on personalized customer experiences, robust supply chain management, and innovative marketing strategies to maintain market share and attract new customers in this highly competitive yet lucrative market. The geographic distribution across the United States, Canada, and Mexico reveals significant market potential with the United States representing the largest segment, due to its large affluent population and established luxury consumer culture.
North America Luxury Goods Market Company Market Share
North America Luxury Goods Market: A Comprehensive Report (2019-2033)
This in-depth report provides a comprehensive analysis of the North America luxury goods market, covering the period from 2019 to 2033. It delves into market dynamics, growth trends, dominant segments, and key players, offering invaluable insights for industry professionals, investors, and strategic decision-makers. The report leverages extensive market research and data analysis to forecast market growth and identify lucrative opportunities within this dynamic sector. The total market size is projected to reach xx Million units by 2033.
North America Luxury Goods Market Dynamics & Structure
This section analyzes the competitive landscape, technological advancements, regulatory environment, and consumer behavior shaping the North America luxury goods market. The market is characterized by a high degree of concentration, with leading players such as LVMH Moët Hennessy Louis Vuitton, Kering Group, and Richemont holding significant market share. Technological innovation, particularly in personalized experiences and e-commerce, is a key driver. However, regulatory changes and evolving consumer preferences present both opportunities and challenges.
- Market Concentration: Highly concentrated, with top 10 players holding approximately xx% market share in 2024.
- Technological Innovation: Focus on personalized experiences, omnichannel strategies, and sustainable practices.
- Regulatory Framework: Tariffs, import regulations, and labeling requirements impacting market dynamics.
- Competitive Substitutes: Rise of affordable luxury and pre-owned luxury goods impacting demand for premium brands.
- End-User Demographics: Affluent millennials and Gen Z are shaping luxury consumption patterns.
- M&A Trends: Significant increase in mergers and acquisitions activity over the past five years, with xx deals recorded between 2019 and 2024.
North America Luxury Goods Market Growth Trends & Insights
The North America luxury goods market experienced substantial growth between 2019 and 2024, driven by factors such as rising disposable incomes, increasing demand for premium products, and the expansion of e-commerce. The market is projected to exhibit a Compound Annual Growth Rate (CAGR) of xx% during the forecast period (2025-2033), reaching xx Million units by 2033. Consumer preferences are shifting towards personalized experiences, sustainable practices, and digital channels. Technological disruptions, such as the metaverse and augmented reality, are creating new opportunities for luxury brands to engage with consumers.
Dominant Regions, Countries, or Segments in North America Luxury Goods Market
The United States is the dominant market for luxury goods in North America, accounting for approximately xx% of the total market value in 2024. Within the United States, major metropolitan areas such as New York, Los Angeles, and Miami are key growth centers. Single-branded stores maintain the largest share of the distribution channel, reflecting the importance of brand exclusivity and customer experience. The high-growth segment is Watches with a market share of xx% in 2024.
- By Distribution Channel: Single-branded stores dominate with xx% market share in 2024, followed by multi-brand stores and online stores.
- By Country: The United States holds the largest market share (xx%), followed by Canada and Mexico.
- By Type: Watches and Jewelry segments show strong growth potential due to higher profit margins and exclusive appeal.
North America Luxury Goods Market Product Landscape
Luxury goods in North America encompass a wide range of products, including clothing and apparel, footwear, bags, jewelry, watches, and other accessories. Product innovation focuses on material quality, craftsmanship, and design. Brands constantly refine their product offerings to meet evolving customer preferences, incorporating sustainable materials and incorporating technological advancements to enhance the customer experience. Unique selling propositions center around brand heritage, exclusivity, and exceptional craftsmanship.
Key Drivers, Barriers & Challenges in North America Luxury Goods Market
Key Drivers:
- Rising disposable incomes among high-net-worth individuals.
- Growing preference for premium and exclusive products.
- Expansion of e-commerce and omnichannel strategies.
Key Challenges:
- Economic uncertainty and potential recessions.
- Counterfeit products and intellectual property theft.
- Supply chain disruptions affecting product availability.
Emerging Opportunities in North America Luxury Goods Market
- Growth of personalized luxury experiences and bespoke services.
- Expansion into new markets and underserved demographics.
- Integration of technology and augmented reality to enhance brand engagement.
Growth Accelerators in the North America Luxury Goods Market Industry
Strategic partnerships and collaborations between luxury brands and technology companies can drive market expansion and product innovation. The growing adoption of sustainable and ethical practices enhances brand appeal. Expansion into experiential retail and personalized customer services represents another significant growth opportunity.
Key Players Shaping the North America Luxury Goods Market Market
Notable Milestones in North America Luxury Goods Market Sector
- September 2022: Hermès opens a large flagship store in New York City, signaling a continued commitment to the North American market.
- July 2022: Louis Vuitton opens its first men's store in California, demonstrating a focus on expanding its reach in the US.
- March 2022: Kering Eyewear’s acquisition of Maui Jim, Inc. expands its portfolio and market share in the eyewear segment.
In-Depth North America Luxury Goods Market Outlook
The North America luxury goods market is poised for continued growth, driven by a confluence of factors, including rising affluence, increasing demand for personalized experiences, and technological advancements that are reshaping consumer interactions with luxury brands. Strategic partnerships, omnichannel expansion, and sustainability initiatives will play a pivotal role in shaping the market's future. The market's potential is significant, with ample room for innovation and growth across various segments and distribution channels.
North America Luxury Goods Market Segmentation
-
1. Type
- 1.1. Clothing and Apparel
- 1.2. Footwear
- 1.3. Bags
- 1.4. Jewelry
- 1.5. Watches
- 1.6. Other Types
-
2. Distribution Channel
- 2.1. Single-branded Stores
- 2.2. Multi-brand Stores
- 2.3. Online Stores
- 2.4. Other Distribution Channels
North America Luxury Goods Market Segmentation By Geography
-
1. North America
- 1.1. United States
- 1.2. Canada
- 1.3. Mexico
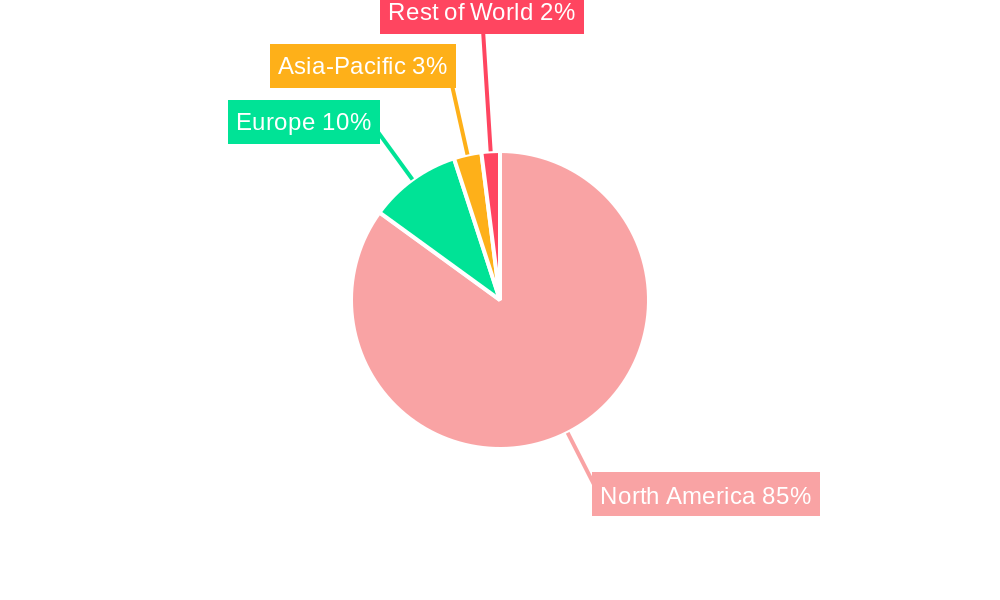
North America Luxury Goods Market Regional Market Share
Geographic Coverage of North America Luxury Goods Market
North America Luxury Goods Market REPORT HIGHLIGHTS
| Aspects | Details |
|---|---|
| Study Period | 2020-2034 |
| Base Year | 2025 |
| Estimated Year | 2026 |
| Forecast Period | 2026-2034 |
| Historical Period | 2020-2025 |
| Growth Rate | CAGR of 7.07% from 2020-2034 |
| Segmentation |
|
Table of Contents
- 1. Introduction
- 1.1. Research Scope
- 1.2. Market Segmentation
- 1.3. Research Objective
- 1.4. Definitions and Assumptions
- 2. Executive Summary
- 2.1. Market Snapshot
- 3. Market Dynamics
- 3.1. Market Drivers
- 3.2. Market Restrains
- 3.3. Market Trends
- 3.4. Market Opportunities
- 4. Market Factor Analysis
- 4.1. Porters Five Forces
- 4.1.1. Bargaining Power of Suppliers
- 4.1.2. Bargaining Power of Buyers
- 4.1.3. Threat of New Entrants
- 4.1.4. Threat of Substitutes
- 4.1.5. Competitive Rivalry
- 4.2. PESTEL analysis
- 4.3. BCG Analysis
- 4.3.1. Stars (High Growth, High Market Share)
- 4.3.2. Cash Cows (Low Growth, High Market Share)
- 4.3.3. Question Mark (High Growth, Low Market Share)
- 4.3.4. Dogs (Low Growth, Low Market Share)
- 4.4. Ansoff Matrix Analysis
- 4.5. Supply Chain Analysis
- 4.6. Regulatory Landscape
- 4.7. Current Market Potential and Opportunity Assessment (TAM–SAM–SOM Framework)
- 4.8. VDR Analyst Note
- 4.1. Porters Five Forces
- 5. Market Analysis, Insights and Forecast 2021-2033
- 5.1. Market Analysis, Insights and Forecast - by Type
- 5.1.1. Clothing and Apparel
- 5.1.2. Footwear
- 5.1.3. Bags
- 5.1.4. Jewelry
- 5.1.5. Watches
- 5.1.6. Other Types
- 5.2. Market Analysis, Insights and Forecast - by Distribution Channel
- 5.2.1. Single-branded Stores
- 5.2.2. Multi-brand Stores
- 5.2.3. Online Stores
- 5.2.4. Other Distribution Channels
- 5.3. Market Analysis, Insights and Forecast - by Region
- 5.3.1. North America
- 5.1. Market Analysis, Insights and Forecast - by Type
- 6. North America Luxury Goods Market Analysis, Insights and Forecast, 2021-2033
- 6.1. Market Analysis, Insights and Forecast - by Type
- 6.1.1. Clothing and Apparel
- 6.1.2. Footwear
- 6.1.3. Bags
- 6.1.4. Jewelry
- 6.1.5. Watches
- 6.1.6. Other Types
- 6.2. Market Analysis, Insights and Forecast - by Distribution Channel
- 6.2.1. Single-branded Stores
- 6.2.2. Multi-brand Stores
- 6.2.3. Online Stores
- 6.2.4. Other Distribution Channels
- 6.1. Market Analysis, Insights and Forecast - by Type
- 7. Competitive Analysis
- 7.1. Company Profiles
- 7.1.1 Giorgio Armani S p A
- 7.1.1.1. Company Overview
- 7.1.1.2. Products
- 7.1.1.3. Company Financials
- 7.1.1.4. SWOT Analysis
- 7.1.2 The Swatch Group
- 7.1.2.1. Company Overview
- 7.1.2.2. Products
- 7.1.2.3. Company Financials
- 7.1.2.4. SWOT Analysis
- 7.1.3 Patek Philippe SA
- 7.1.3.1. Company Overview
- 7.1.3.2. Products
- 7.1.3.3. Company Financials
- 7.1.3.4. SWOT Analysis
- 7.1.4 Gucci
- 7.1.4.1. Company Overview
- 7.1.4.2. Products
- 7.1.4.3. Company Financials
- 7.1.4.4. SWOT Analysis
- 7.1.5 The Estée Lauder Companies
- 7.1.5.1. Company Overview
- 7.1.5.2. Products
- 7.1.5.3. Company Financials
- 7.1.5.4. SWOT Analysis
- 7.1.6 Richemont*List Not Exhaustive
- 7.1.6.1. Company Overview
- 7.1.6.2. Products
- 7.1.6.3. Company Financials
- 7.1.6.4. SWOT Analysis
- 7.1.7 Rolex SA
- 7.1.7.1. Company Overview
- 7.1.7.2. Products
- 7.1.7.3. Company Financials
- 7.1.7.4. SWOT Analysis
- 7.1.8 Kering Group
- 7.1.8.1. Company Overview
- 7.1.8.2. Products
- 7.1.8.3. Company Financials
- 7.1.8.4. SWOT Analysis
- 7.1.9 Hermès International S A
- 7.1.9.1. Company Overview
- 7.1.9.2. Products
- 7.1.9.3. Company Financials
- 7.1.9.4. SWOT Analysis
- 7.1.10 LVMH Moët Hennessy Louis Vuitton
- 7.1.10.1. Company Overview
- 7.1.10.2. Products
- 7.1.10.3. Company Financials
- 7.1.10.4. SWOT Analysis
- 7.1.1 Giorgio Armani S p A
- 7.2. Market Entropy
- 7.2.1 Company's Key Areas Served
- 7.2.2 Recent Developments
- 7.3. Company Market Share Analysis 2025
- 7.3.1 Top 5 Companies Market Share Analysis
- 7.3.2 Top 3 Companies Market Share Analysis
- 7.4. List of Potential Customers
- 8. Research Methodology
List of Figures
- Figure 1: North America Luxury Goods Market Revenue Breakdown (Million, %) by Product 2025 & 2033
- Figure 2: North America Luxury Goods Market Share (%) by Company 2025
List of Tables
- Table 1: North America Luxury Goods Market Revenue Million Forecast, by Type 2020 & 2033
- Table 2: North America Luxury Goods Market Volume K Units Forecast, by Type 2020 & 2033
- Table 3: North America Luxury Goods Market Revenue Million Forecast, by Distribution Channel 2020 & 2033
- Table 4: North America Luxury Goods Market Volume K Units Forecast, by Distribution Channel 2020 & 2033
- Table 5: North America Luxury Goods Market Revenue Million Forecast, by Region 2020 & 2033
- Table 6: North America Luxury Goods Market Volume K Units Forecast, by Region 2020 & 2033
- Table 7: North America Luxury Goods Market Revenue Million Forecast, by Type 2020 & 2033
- Table 8: North America Luxury Goods Market Volume K Units Forecast, by Type 2020 & 2033
- Table 9: North America Luxury Goods Market Revenue Million Forecast, by Distribution Channel 2020 & 2033
- Table 10: North America Luxury Goods Market Volume K Units Forecast, by Distribution Channel 2020 & 2033
- Table 11: North America Luxury Goods Market Revenue Million Forecast, by Country 2020 & 2033
- Table 12: North America Luxury Goods Market Volume K Units Forecast, by Country 2020 & 2033
- Table 13: United States North America Luxury Goods Market Revenue (Million) Forecast, by Application 2020 & 2033
- Table 14: United States North America Luxury Goods Market Volume (K Units) Forecast, by Application 2020 & 2033
- Table 15: Canada North America Luxury Goods Market Revenue (Million) Forecast, by Application 2020 & 2033
- Table 16: Canada North America Luxury Goods Market Volume (K Units) Forecast, by Application 2020 & 2033
- Table 17: Mexico North America Luxury Goods Market Revenue (Million) Forecast, by Application 2020 & 2033
- Table 18: Mexico North America Luxury Goods Market Volume (K Units) Forecast, by Application 2020 & 2033
Frequently Asked Questions
1. What is the projected Compound Annual Growth Rate (CAGR) of the North America Luxury Goods Market?
The projected CAGR is approximately 7.07%.
2. Which companies are prominent players in the North America Luxury Goods Market?
Key companies in the market include Giorgio Armani S p A, The Swatch Group, Patek Philippe SA, Gucci, The Estée Lauder Companies, Richemont*List Not Exhaustive, Rolex SA, Kering Group, Hermès International S A, LVMH Moët Hennessy Louis Vuitton.
3. What are the main segments of the North America Luxury Goods Market?
The market segments include Type, Distribution Channel.
4. Can you provide details about the market size?
The market size is estimated to be USD 103.10 Million as of 2022.
5. What are some drivers contributing to market growth?
Demand for Smartwatches; Popularity of Luxury Watches.
6. What are the notable trends driving market growth?
Rising Number of High-Net-Worth Individuals in the Region.
7. Are there any restraints impacting market growth?
Presence of Fake Brands in the Market.
8. Can you provide examples of recent developments in the market?
In September 2022, at 706 Madison Avenue in the tony shopping corridor of New York, Hermès opened one of its largest flagship stores in the world.
9. What pricing options are available for accessing the report?
Pricing options include single-user, multi-user, and enterprise licenses priced at USD 4750, USD 4950, and USD 6800 respectively.
10. Is the market size provided in terms of value or volume?
The market size is provided in terms of value, measured in Million and volume, measured in K Units.
11. Are there any specific market keywords associated with the report?
Yes, the market keyword associated with the report is "North America Luxury Goods Market," which aids in identifying and referencing the specific market segment covered.
12. How do I determine which pricing option suits my needs best?
The pricing options vary based on user requirements and access needs. Individual users may opt for single-user licenses, while businesses requiring broader access may choose multi-user or enterprise licenses for cost-effective access to the report.
13. Are there any additional resources or data provided in the North America Luxury Goods Market report?
While the report offers comprehensive insights, it's advisable to review the specific contents or supplementary materials provided to ascertain if additional resources or data are available.
14. How can I stay updated on further developments or reports in the North America Luxury Goods Market?
To stay informed about further developments, trends, and reports in the North America Luxury Goods Market, consider subscribing to industry newsletters, following relevant companies and organizations, or regularly checking reputable industry news sources and publications.
Methodology
Step 1 - Identification of Relevant Samples Size from Population Database


Step 2 - Approaches for Defining Global Market Size (Value, Volume* & Price*)

Note*: In applicable scenarios
Step 3 - Data Sources
Primary Research
- Web Analytics
- Survey Reports
- Research Institute
- Latest Research Reports
- Opinion Leaders
Secondary Research
- Annual Reports
- White Paper
- Latest Press Release
- Industry Association
- Paid Database
- Investor Presentations

Step 4 - Data Triangulation
Involves using different sources of information in order to increase the validity of a study
These sources are likely to be stakeholders in a program - participants, other researchers, program staff, other community members, and so on.
Then we put all data in single framework & apply various statistical tools to find out the dynamic on the market.
During the analysis stage, feedback from the stakeholder groups would be compared to determine areas of agreement as well as areas of divergence