

Key Insights
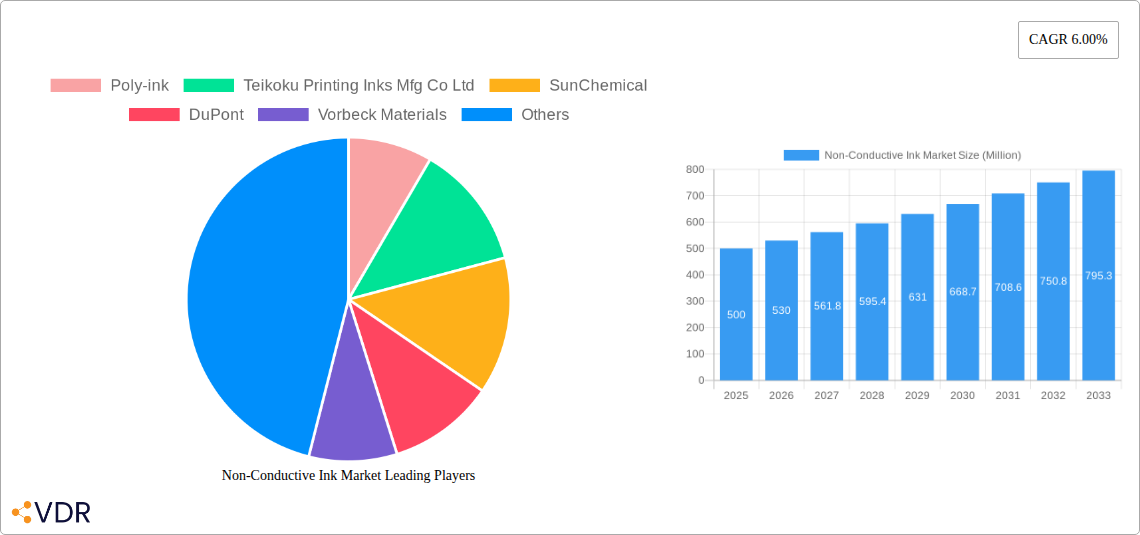
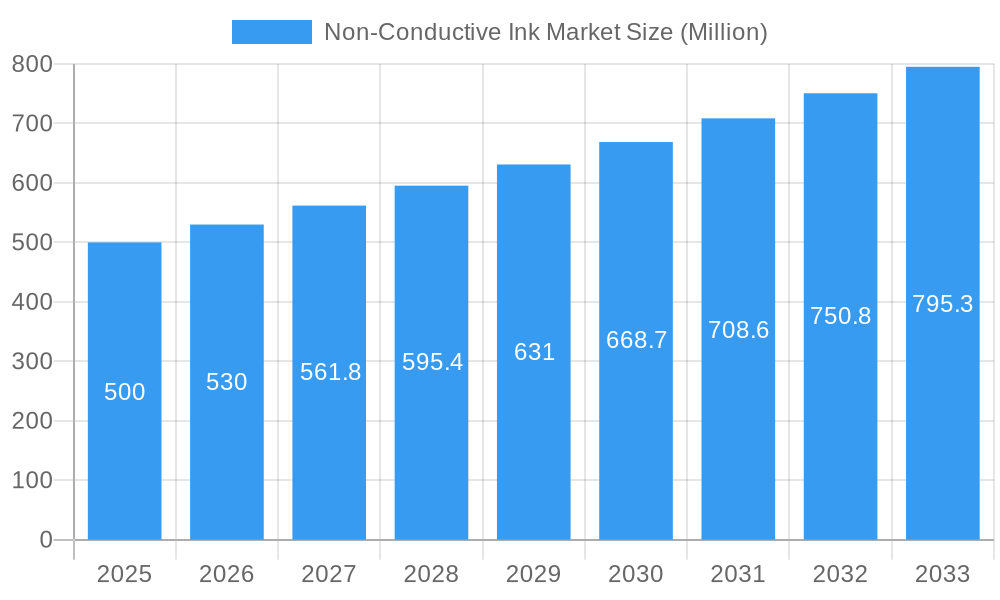
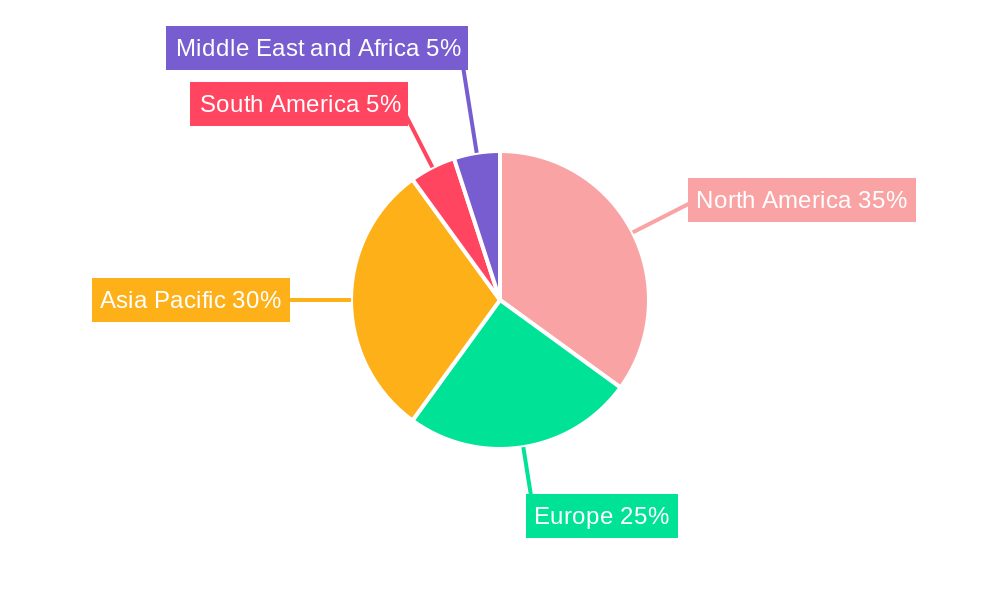
The Non-Conductive Ink market, valued at approximately $500 million in 2025, is projected to experience robust growth, exhibiting a Compound Annual Growth Rate (CAGR) of 6% from 2025 to 2033. This expansion is fueled by several key drivers. The surging demand for advanced electronics, particularly in the photovoltaic panel and printed circuit board (PCB) sectors, is a primary catalyst. Increasing adoption of LED lighting technology further contributes to market growth, as non-conductive inks play a crucial role in LED packaging. Technological advancements leading to improved ink formulations with enhanced durability, flexibility, and printing capabilities are also stimulating market expansion. The market is segmented by substrate type (acrylic, ceramic, glass) and application (photovoltaic panels, printed circuit boards, LED packaging). Acrylic substrates currently dominate due to their cost-effectiveness and suitability for various applications. However, the demand for ceramic and glass substrates is anticipated to grow steadily, driven by the need for higher temperature resistance and improved performance in demanding environments. Geographic growth is expected to be broad, with North America and Asia-Pacific representing the largest market shares, driven by established manufacturing bases and technological innovation in these regions.
Non-Conductive Ink Market Market Size (In Million)
Despite this positive outlook, the market faces certain restraints. Fluctuations in raw material prices, especially those related to resins and pigments, can impact profitability. The stringent regulatory environment concerning the environmental impact of ink manufacturing and disposal also poses a challenge. Furthermore, the emergence of alternative technologies and the intensifying competition among established players necessitate continuous innovation and strategic adaptation for market success. Despite these challenges, the long-term outlook remains optimistic, driven by the ongoing growth of the electronics industry and advancements in materials science, promising sustained growth for the non-conductive ink market in the coming years.
Non-Conductive Ink Market Company Market Share
Non-Conductive Ink Market Report: 2019-2033
This comprehensive report provides a detailed analysis of the Non-Conductive Ink market, encompassing market dynamics, growth trends, regional segmentation, product landscape, key players, and future outlook. The study covers the historical period (2019-2024), base year (2025), and forecast period (2025-2033), offering valuable insights for industry professionals, investors, and stakeholders. The parent market is the specialty inks market and the child market is the electronics and packaging ink segments.
Non-Conductive Ink Market Market Dynamics & Structure
The Non-Conductive Ink market is characterized by a moderately concentrated landscape, with key players like Poly-ink, Teikoku Printing Inks Mfg Co Ltd, SunChemical, and DuPont holding significant market share (xx%). Technological innovation, particularly in materials science and printing techniques, is a primary growth driver. Stringent environmental regulations regarding volatile organic compounds (VOCs) are shaping product development towards greener alternatives. Competitive substitutes include traditional coatings and insulators; however, the superior performance and versatility of non-conductive inks are driving adoption. The market is witnessing a gradual shift towards high-precision printing applications, particularly in electronics. M&A activity has been relatively modest in recent years, with xx major deals recorded between 2019 and 2024, primarily focused on expanding product portfolios and geographical reach.
- Market Concentration: Moderately concentrated (xx% held by top 5 players)
- Technological Innovation: Focus on improved dielectric strength, UV resistance, and processability.
- Regulatory Framework: Growing emphasis on VOC reduction and environmental compliance.
- Competitive Substitutes: Traditional coatings and insulating materials.
- End-User Demographics: Strong demand from electronics and packaging industries.
- M&A Trends: Relatively low activity, with xx major deals between 2019-2024.
Non-Conductive Ink Market Growth Trends & Insights
The Non-Conductive Ink market exhibited a CAGR of xx% during the historical period (2019-2024) and is projected to grow at a CAGR of xx% during the forecast period (2025-2033), reaching a market size of xx million units by 2033. This growth is driven by increasing demand from the electronics industry, particularly in printed circuit boards (PCBs) and photovoltaic panels. The adoption of advanced printing technologies, such as inkjet and screen printing, is further boosting market penetration. Consumer preference for miniaturized and high-performance electronic devices is creating a sustained demand for high-quality non-conductive inks. Technological disruptions, such as the emergence of new ink formulations with enhanced properties, are shaping the competitive landscape. The market is experiencing a gradual shift towards water-based and UV-curable inks due to their environmental friendliness and faster curing times.
Dominant Regions, Countries, or Segments in Non-Conductive Ink Market
The Asia-Pacific region is currently the dominant market for non-conductive inks, driven by robust growth in the electronics manufacturing sector in countries like China, South Korea, and Japan. The high concentration of electronics manufacturing facilities in this region, coupled with supportive government policies, is a key driver. Within the substrate types, the glass segment currently holds the largest market share (xx%), owing to its extensive use in LED packaging and photovoltaic applications. In terms of application, the printed circuit board (PCB) panel segment is leading in terms of volume and revenue, reflecting the expanding electronics industry.
- Key Drivers (Asia-Pacific): Large electronics manufacturing base, supportive government policies, growing consumer electronics demand.
- Key Drivers (Glass Substrate): Wide application in LED packaging and photovoltaic panels.
- Key Drivers (PCB Application): Expansion of the electronics industry, demand for high-precision printing.
Non-Conductive Ink Market Product Landscape
Non-conductive inks are available in various formulations, including UV-curable, water-based, and solvent-based options. Key performance metrics include dielectric strength, viscosity, adhesion, and chemical resistance. Recent innovations focus on enhancing these properties to meet the stringent requirements of advanced electronic applications. Unique selling propositions include improved printability, faster curing times, and enhanced durability. Technological advancements include the incorporation of nanomaterials to improve electrical insulation and mechanical strength.
Key Drivers, Barriers & Challenges in Non-Conductive Ink Market
Key Drivers: Growing demand from electronics manufacturing, increasing adoption of advanced printing technologies, stringent environmental regulations driving development of eco-friendly inks.
Key Challenges: High raw material costs, intense competition from established players, concerns about long-term durability and reliability in harsh environments. Supply chain disruptions, particularly for specialized raw materials, pose a significant challenge, impacting production timelines and potentially leading to price increases (estimated xx% increase in 2024).
Emerging Opportunities in Non-Conductive Ink Market
Emerging opportunities include the expansion into new applications, such as flexible electronics and bioelectronics. The increasing demand for high-performance, environmentally friendly inks presents significant growth potential. Untapped markets in developing economies offer considerable scope for market expansion. The development of specialized inks for specific applications, such as medical devices and sensors, is another key opportunity.
Growth Accelerators in the Non-Conductive Ink Market Industry
Technological breakthroughs in ink formulation and printing technologies are key growth accelerators. Strategic partnerships between ink manufacturers and equipment providers are facilitating the adoption of advanced printing techniques. Expanding into new applications and geographic markets is driving long-term growth.
Key Players Shaping the Non-Conductive Ink Market Market
- Poly-ink
- Teikoku Printing Inks Mfg Co Ltd
- SunChemical
- DuPont
- Vorbeck Materials
- Applied Ink Solutions
- Henkel Corporation
- Creative Materials Inc
- Nagase America LLC
- NovaCentrix
Notable Milestones in Non-Conductive Ink Market Sector
- 2021: Launch of a new UV-curable non-conductive ink with enhanced dielectric strength by SunChemical.
- 2022: Acquisition of a smaller ink manufacturer by DuPont to expand its product portfolio.
- 2023: Introduction of a water-based non-conductive ink with improved environmental profile by Poly-ink.
In-Depth Non-Conductive Ink Market Market Outlook
The Non-Conductive Ink market is poised for significant growth in the coming years, driven by technological advancements, increasing demand from electronics and packaging industries, and expanding applications in emerging sectors. Strategic partnerships, investments in R&D, and expansion into new markets will be crucial for players to capitalize on the market potential. The development of sustainable and high-performance inks will be a key focus area.
Non-Conductive Ink Market Segmentation
-
1. Substrate Type
- 1.1. Acrylic
- 1.2. Ceramic
- 1.3. Glass
-
2. Application
- 2.1. Photovoltaic Panels
- 2.2. Printed Circuit Board Panels
- 2.3. LED Packaging
Non-Conductive Ink Market Segmentation By Geography
-
1. Asia Pacific
- 1.1. China
- 1.2. India
- 1.3. Japan
- 1.4. South Korea
- 1.5. Rest of Asia Pacific
-
2. North America
- 2.1. United States
- 2.2. Canada
- 2.3. Mexico
-
3. Europe
- 3.1. Germany
- 3.2. United Kingdom
- 3.3. France
- 3.4. Italy
- 3.5. Rest of Europe
-
4. South America
- 4.1. Brazil
- 4.2. Argentina
- 4.3. Rest of South America
-
5. Middle East and Africa
- 5.1. Saudi Arabia
- 5.2. South Africa
- 5.3. Rest of Middle East and Africa
Non-Conductive Ink Market Regional Market Share
Geographic Coverage of Non-Conductive Ink Market
Non-Conductive Ink Market REPORT HIGHLIGHTS
| Aspects | Details |
|---|---|
| Study Period | 2020-2034 |
| Base Year | 2025 |
| Estimated Year | 2026 |
| Forecast Period | 2026-2034 |
| Historical Period | 2020-2025 |
| Growth Rate | CAGR of 6.00% from 2020-2034 |
| Segmentation |
|
Table of Contents
- 1. Introduction
- 1.1. Research Scope
- 1.2. Market Segmentation
- 1.3. Research Objective
- 1.4. Definitions and Assumptions
- 2. Executive Summary
- 2.1. Market Snapshot
- 3. Market Dynamics
- 3.1. Market Drivers
- 3.2. Market Restrains
- 3.3. Market Trends
- 3.4. Market Opportunities
- 4. Market Factor Analysis
- 4.1. Porters Five Forces
- 4.1.1. Bargaining Power of Suppliers
- 4.1.2. Bargaining Power of Buyers
- 4.1.3. Threat of New Entrants
- 4.1.4. Threat of Substitutes
- 4.1.5. Competitive Rivalry
- 4.2. PESTEL analysis
- 4.3. BCG Analysis
- 4.3.1. Stars (High Growth, High Market Share)
- 4.3.2. Cash Cows (Low Growth, High Market Share)
- 4.3.3. Question Mark (High Growth, Low Market Share)
- 4.3.4. Dogs (Low Growth, Low Market Share)
- 4.4. Ansoff Matrix Analysis
- 4.5. Supply Chain Analysis
- 4.6. Regulatory Landscape
- 4.7. Current Market Potential and Opportunity Assessment (TAM–SAM–SOM Framework)
- 4.8. VDR Analyst Note
- 4.1. Porters Five Forces
- 5. Market Analysis, Insights and Forecast 2021-2033
- 5.1. Market Analysis, Insights and Forecast - by Substrate Type
- 5.1.1. Acrylic
- 5.1.2. Ceramic
- 5.1.3. Glass
- 5.2. Market Analysis, Insights and Forecast - by Application
- 5.2.1. Photovoltaic Panels
- 5.2.2. Printed Circuit Board Panels
- 5.2.3. LED Packaging
- 5.3. Market Analysis, Insights and Forecast - by Region
- 5.3.1. Asia Pacific
- 5.3.2. North America
- 5.3.3. Europe
- 5.3.4. South America
- 5.3.5. Middle East and Africa
- 5.1. Market Analysis, Insights and Forecast - by Substrate Type
- 6. Global Non-Conductive Ink Market Analysis, Insights and Forecast, 2021-2033
- 6.1. Market Analysis, Insights and Forecast - by Substrate Type
- 6.1.1. Acrylic
- 6.1.2. Ceramic
- 6.1.3. Glass
- 6.2. Market Analysis, Insights and Forecast - by Application
- 6.2.1. Photovoltaic Panels
- 6.2.2. Printed Circuit Board Panels
- 6.2.3. LED Packaging
- 6.1. Market Analysis, Insights and Forecast - by Substrate Type
- 7. Asia Pacific Non-Conductive Ink Market Analysis, Insights and Forecast, 2021-2033
- 7.1. Market Analysis, Insights and Forecast - by Substrate Type
- 7.1.1. Acrylic
- 7.1.2. Ceramic
- 7.1.3. Glass
- 7.2. Market Analysis, Insights and Forecast - by Application
- 7.2.1. Photovoltaic Panels
- 7.2.2. Printed Circuit Board Panels
- 7.2.3. LED Packaging
- 7.1. Market Analysis, Insights and Forecast - by Substrate Type
- 8. North America Non-Conductive Ink Market Analysis, Insights and Forecast, 2021-2033
- 8.1. Market Analysis, Insights and Forecast - by Substrate Type
- 8.1.1. Acrylic
- 8.1.2. Ceramic
- 8.1.3. Glass
- 8.2. Market Analysis, Insights and Forecast - by Application
- 8.2.1. Photovoltaic Panels
- 8.2.2. Printed Circuit Board Panels
- 8.2.3. LED Packaging
- 8.1. Market Analysis, Insights and Forecast - by Substrate Type
- 9. Europe Non-Conductive Ink Market Analysis, Insights and Forecast, 2021-2033
- 9.1. Market Analysis, Insights and Forecast - by Substrate Type
- 9.1.1. Acrylic
- 9.1.2. Ceramic
- 9.1.3. Glass
- 9.2. Market Analysis, Insights and Forecast - by Application
- 9.2.1. Photovoltaic Panels
- 9.2.2. Printed Circuit Board Panels
- 9.2.3. LED Packaging
- 9.1. Market Analysis, Insights and Forecast - by Substrate Type
- 10. South America Non-Conductive Ink Market Analysis, Insights and Forecast, 2021-2033
- 10.1. Market Analysis, Insights and Forecast - by Substrate Type
- 10.1.1. Acrylic
- 10.1.2. Ceramic
- 10.1.3. Glass
- 10.2. Market Analysis, Insights and Forecast - by Application
- 10.2.1. Photovoltaic Panels
- 10.2.2. Printed Circuit Board Panels
- 10.2.3. LED Packaging
- 10.1. Market Analysis, Insights and Forecast - by Substrate Type
- 11. Middle East and Africa Non-Conductive Ink Market Analysis, Insights and Forecast, 2021-2033
- 11.1. Market Analysis, Insights and Forecast - by Substrate Type
- 11.1.1. Acrylic
- 11.1.2. Ceramic
- 11.1.3. Glass
- 11.2. Market Analysis, Insights and Forecast - by Application
- 11.2.1. Photovoltaic Panels
- 11.2.2. Printed Circuit Board Panels
- 11.2.3. LED Packaging
- 11.1. Market Analysis, Insights and Forecast - by Substrate Type
- 12. Competitive Analysis
- 12.1. Company Profiles
- 12.1.1 Poly-ink
- 12.1.1.1. Company Overview
- 12.1.1.2. Products
- 12.1.1.3. Company Financials
- 12.1.1.4. SWOT Analysis
- 12.1.2 Teikoku Printing Inks Mfg Co Ltd
- 12.1.2.1. Company Overview
- 12.1.2.2. Products
- 12.1.2.3. Company Financials
- 12.1.2.4. SWOT Analysis
- 12.1.3 SunChemical
- 12.1.3.1. Company Overview
- 12.1.3.2. Products
- 12.1.3.3. Company Financials
- 12.1.3.4. SWOT Analysis
- 12.1.4 DuPont
- 12.1.4.1. Company Overview
- 12.1.4.2. Products
- 12.1.4.3. Company Financials
- 12.1.4.4. SWOT Analysis
- 12.1.5 Vorbeck Materials
- 12.1.5.1. Company Overview
- 12.1.5.2. Products
- 12.1.5.3. Company Financials
- 12.1.5.4. SWOT Analysis
- 12.1.6 Applied Ink Solutions
- 12.1.6.1. Company Overview
- 12.1.6.2. Products
- 12.1.6.3. Company Financials
- 12.1.6.4. SWOT Analysis
- 12.1.7 Henkel Corporation
- 12.1.7.1. Company Overview
- 12.1.7.2. Products
- 12.1.7.3. Company Financials
- 12.1.7.4. SWOT Analysis
- 12.1.8 Creative Materials Inc
- 12.1.8.1. Company Overview
- 12.1.8.2. Products
- 12.1.8.3. Company Financials
- 12.1.8.4. SWOT Analysis
- 12.1.9 Nagase America LLC
- 12.1.9.1. Company Overview
- 12.1.9.2. Products
- 12.1.9.3. Company Financials
- 12.1.9.4. SWOT Analysis
- 12.1.10 NovaCentrix
- 12.1.10.1. Company Overview
- 12.1.10.2. Products
- 12.1.10.3. Company Financials
- 12.1.10.4. SWOT Analysis
- 12.1.1 Poly-ink
- 12.2. Market Entropy
- 12.2.1 Company's Key Areas Served
- 12.2.2 Recent Developments
- 12.3. Company Market Share Analysis 2025
- 12.3.1 Top 5 Companies Market Share Analysis
- 12.3.2 Top 3 Companies Market Share Analysis
- 12.4. List of Potential Customers
- 13. Research Methodology
List of Figures
- Figure 1: Global Non-Conductive Ink Market Revenue Breakdown (Million, %) by Region 2025 & 2033
- Figure 2: Global Non-Conductive Ink Market Volume Breakdown (K Tons, %) by Region 2025 & 2033
- Figure 3: Asia Pacific Non-Conductive Ink Market Revenue (Million), by Substrate Type 2025 & 2033
- Figure 4: Asia Pacific Non-Conductive Ink Market Volume (K Tons), by Substrate Type 2025 & 2033
- Figure 5: Asia Pacific Non-Conductive Ink Market Revenue Share (%), by Substrate Type 2025 & 2033
- Figure 6: Asia Pacific Non-Conductive Ink Market Volume Share (%), by Substrate Type 2025 & 2033
- Figure 7: Asia Pacific Non-Conductive Ink Market Revenue (Million), by Application 2025 & 2033
- Figure 8: Asia Pacific Non-Conductive Ink Market Volume (K Tons), by Application 2025 & 2033
- Figure 9: Asia Pacific Non-Conductive Ink Market Revenue Share (%), by Application 2025 & 2033
- Figure 10: Asia Pacific Non-Conductive Ink Market Volume Share (%), by Application 2025 & 2033
- Figure 11: Asia Pacific Non-Conductive Ink Market Revenue (Million), by Country 2025 & 2033
- Figure 12: Asia Pacific Non-Conductive Ink Market Volume (K Tons), by Country 2025 & 2033
- Figure 13: Asia Pacific Non-Conductive Ink Market Revenue Share (%), by Country 2025 & 2033
- Figure 14: Asia Pacific Non-Conductive Ink Market Volume Share (%), by Country 2025 & 2033
- Figure 15: North America Non-Conductive Ink Market Revenue (Million), by Substrate Type 2025 & 2033
- Figure 16: North America Non-Conductive Ink Market Volume (K Tons), by Substrate Type 2025 & 2033
- Figure 17: North America Non-Conductive Ink Market Revenue Share (%), by Substrate Type 2025 & 2033
- Figure 18: North America Non-Conductive Ink Market Volume Share (%), by Substrate Type 2025 & 2033
- Figure 19: North America Non-Conductive Ink Market Revenue (Million), by Application 2025 & 2033
- Figure 20: North America Non-Conductive Ink Market Volume (K Tons), by Application 2025 & 2033
- Figure 21: North America Non-Conductive Ink Market Revenue Share (%), by Application 2025 & 2033
- Figure 22: North America Non-Conductive Ink Market Volume Share (%), by Application 2025 & 2033
- Figure 23: North America Non-Conductive Ink Market Revenue (Million), by Country 2025 & 2033
- Figure 24: North America Non-Conductive Ink Market Volume (K Tons), by Country 2025 & 2033
- Figure 25: North America Non-Conductive Ink Market Revenue Share (%), by Country 2025 & 2033
- Figure 26: North America Non-Conductive Ink Market Volume Share (%), by Country 2025 & 2033
- Figure 27: Europe Non-Conductive Ink Market Revenue (Million), by Substrate Type 2025 & 2033
- Figure 28: Europe Non-Conductive Ink Market Volume (K Tons), by Substrate Type 2025 & 2033
- Figure 29: Europe Non-Conductive Ink Market Revenue Share (%), by Substrate Type 2025 & 2033
- Figure 30: Europe Non-Conductive Ink Market Volume Share (%), by Substrate Type 2025 & 2033
- Figure 31: Europe Non-Conductive Ink Market Revenue (Million), by Application 2025 & 2033
- Figure 32: Europe Non-Conductive Ink Market Volume (K Tons), by Application 2025 & 2033
- Figure 33: Europe Non-Conductive Ink Market Revenue Share (%), by Application 2025 & 2033
- Figure 34: Europe Non-Conductive Ink Market Volume Share (%), by Application 2025 & 2033
- Figure 35: Europe Non-Conductive Ink Market Revenue (Million), by Country 2025 & 2033
- Figure 36: Europe Non-Conductive Ink Market Volume (K Tons), by Country 2025 & 2033
- Figure 37: Europe Non-Conductive Ink Market Revenue Share (%), by Country 2025 & 2033
- Figure 38: Europe Non-Conductive Ink Market Volume Share (%), by Country 2025 & 2033
- Figure 39: South America Non-Conductive Ink Market Revenue (Million), by Substrate Type 2025 & 2033
- Figure 40: South America Non-Conductive Ink Market Volume (K Tons), by Substrate Type 2025 & 2033
- Figure 41: South America Non-Conductive Ink Market Revenue Share (%), by Substrate Type 2025 & 2033
- Figure 42: South America Non-Conductive Ink Market Volume Share (%), by Substrate Type 2025 & 2033
- Figure 43: South America Non-Conductive Ink Market Revenue (Million), by Application 2025 & 2033
- Figure 44: South America Non-Conductive Ink Market Volume (K Tons), by Application 2025 & 2033
- Figure 45: South America Non-Conductive Ink Market Revenue Share (%), by Application 2025 & 2033
- Figure 46: South America Non-Conductive Ink Market Volume Share (%), by Application 2025 & 2033
- Figure 47: South America Non-Conductive Ink Market Revenue (Million), by Country 2025 & 2033
- Figure 48: South America Non-Conductive Ink Market Volume (K Tons), by Country 2025 & 2033
- Figure 49: South America Non-Conductive Ink Market Revenue Share (%), by Country 2025 & 2033
- Figure 50: South America Non-Conductive Ink Market Volume Share (%), by Country 2025 & 2033
- Figure 51: Middle East and Africa Non-Conductive Ink Market Revenue (Million), by Substrate Type 2025 & 2033
- Figure 52: Middle East and Africa Non-Conductive Ink Market Volume (K Tons), by Substrate Type 2025 & 2033
- Figure 53: Middle East and Africa Non-Conductive Ink Market Revenue Share (%), by Substrate Type 2025 & 2033
- Figure 54: Middle East and Africa Non-Conductive Ink Market Volume Share (%), by Substrate Type 2025 & 2033
- Figure 55: Middle East and Africa Non-Conductive Ink Market Revenue (Million), by Application 2025 & 2033
- Figure 56: Middle East and Africa Non-Conductive Ink Market Volume (K Tons), by Application 2025 & 2033
- Figure 57: Middle East and Africa Non-Conductive Ink Market Revenue Share (%), by Application 2025 & 2033
- Figure 58: Middle East and Africa Non-Conductive Ink Market Volume Share (%), by Application 2025 & 2033
- Figure 59: Middle East and Africa Non-Conductive Ink Market Revenue (Million), by Country 2025 & 2033
- Figure 60: Middle East and Africa Non-Conductive Ink Market Volume (K Tons), by Country 2025 & 2033
- Figure 61: Middle East and Africa Non-Conductive Ink Market Revenue Share (%), by Country 2025 & 2033
- Figure 62: Middle East and Africa Non-Conductive Ink Market Volume Share (%), by Country 2025 & 2033
List of Tables
- Table 1: Global Non-Conductive Ink Market Revenue Million Forecast, by Substrate Type 2020 & 2033
- Table 2: Global Non-Conductive Ink Market Volume K Tons Forecast, by Substrate Type 2020 & 2033
- Table 3: Global Non-Conductive Ink Market Revenue Million Forecast, by Application 2020 & 2033
- Table 4: Global Non-Conductive Ink Market Volume K Tons Forecast, by Application 2020 & 2033
- Table 5: Global Non-Conductive Ink Market Revenue Million Forecast, by Region 2020 & 2033
- Table 6: Global Non-Conductive Ink Market Volume K Tons Forecast, by Region 2020 & 2033
- Table 7: Global Non-Conductive Ink Market Revenue Million Forecast, by Substrate Type 2020 & 2033
- Table 8: Global Non-Conductive Ink Market Volume K Tons Forecast, by Substrate Type 2020 & 2033
- Table 9: Global Non-Conductive Ink Market Revenue Million Forecast, by Application 2020 & 2033
- Table 10: Global Non-Conductive Ink Market Volume K Tons Forecast, by Application 2020 & 2033
- Table 11: Global Non-Conductive Ink Market Revenue Million Forecast, by Country 2020 & 2033
- Table 12: Global Non-Conductive Ink Market Volume K Tons Forecast, by Country 2020 & 2033
- Table 13: China Non-Conductive Ink Market Revenue (Million) Forecast, by Application 2020 & 2033
- Table 14: China Non-Conductive Ink Market Volume (K Tons) Forecast, by Application 2020 & 2033
- Table 15: India Non-Conductive Ink Market Revenue (Million) Forecast, by Application 2020 & 2033
- Table 16: India Non-Conductive Ink Market Volume (K Tons) Forecast, by Application 2020 & 2033
- Table 17: Japan Non-Conductive Ink Market Revenue (Million) Forecast, by Application 2020 & 2033
- Table 18: Japan Non-Conductive Ink Market Volume (K Tons) Forecast, by Application 2020 & 2033
- Table 19: South Korea Non-Conductive Ink Market Revenue (Million) Forecast, by Application 2020 & 2033
- Table 20: South Korea Non-Conductive Ink Market Volume (K Tons) Forecast, by Application 2020 & 2033
- Table 21: Rest of Asia Pacific Non-Conductive Ink Market Revenue (Million) Forecast, by Application 2020 & 2033
- Table 22: Rest of Asia Pacific Non-Conductive Ink Market Volume (K Tons) Forecast, by Application 2020 & 2033
- Table 23: Global Non-Conductive Ink Market Revenue Million Forecast, by Substrate Type 2020 & 2033
- Table 24: Global Non-Conductive Ink Market Volume K Tons Forecast, by Substrate Type 2020 & 2033
- Table 25: Global Non-Conductive Ink Market Revenue Million Forecast, by Application 2020 & 2033
- Table 26: Global Non-Conductive Ink Market Volume K Tons Forecast, by Application 2020 & 2033
- Table 27: Global Non-Conductive Ink Market Revenue Million Forecast, by Country 2020 & 2033
- Table 28: Global Non-Conductive Ink Market Volume K Tons Forecast, by Country 2020 & 2033
- Table 29: United States Non-Conductive Ink Market Revenue (Million) Forecast, by Application 2020 & 2033
- Table 30: United States Non-Conductive Ink Market Volume (K Tons) Forecast, by Application 2020 & 2033
- Table 31: Canada Non-Conductive Ink Market Revenue (Million) Forecast, by Application 2020 & 2033
- Table 32: Canada Non-Conductive Ink Market Volume (K Tons) Forecast, by Application 2020 & 2033
- Table 33: Mexico Non-Conductive Ink Market Revenue (Million) Forecast, by Application 2020 & 2033
- Table 34: Mexico Non-Conductive Ink Market Volume (K Tons) Forecast, by Application 2020 & 2033
- Table 35: Global Non-Conductive Ink Market Revenue Million Forecast, by Substrate Type 2020 & 2033
- Table 36: Global Non-Conductive Ink Market Volume K Tons Forecast, by Substrate Type 2020 & 2033
- Table 37: Global Non-Conductive Ink Market Revenue Million Forecast, by Application 2020 & 2033
- Table 38: Global Non-Conductive Ink Market Volume K Tons Forecast, by Application 2020 & 2033
- Table 39: Global Non-Conductive Ink Market Revenue Million Forecast, by Country 2020 & 2033
- Table 40: Global Non-Conductive Ink Market Volume K Tons Forecast, by Country 2020 & 2033
- Table 41: Germany Non-Conductive Ink Market Revenue (Million) Forecast, by Application 2020 & 2033
- Table 42: Germany Non-Conductive Ink Market Volume (K Tons) Forecast, by Application 2020 & 2033
- Table 43: United Kingdom Non-Conductive Ink Market Revenue (Million) Forecast, by Application 2020 & 2033
- Table 44: United Kingdom Non-Conductive Ink Market Volume (K Tons) Forecast, by Application 2020 & 2033
- Table 45: France Non-Conductive Ink Market Revenue (Million) Forecast, by Application 2020 & 2033
- Table 46: France Non-Conductive Ink Market Volume (K Tons) Forecast, by Application 2020 & 2033
- Table 47: Italy Non-Conductive Ink Market Revenue (Million) Forecast, by Application 2020 & 2033
- Table 48: Italy Non-Conductive Ink Market Volume (K Tons) Forecast, by Application 2020 & 2033
- Table 49: Rest of Europe Non-Conductive Ink Market Revenue (Million) Forecast, by Application 2020 & 2033
- Table 50: Rest of Europe Non-Conductive Ink Market Volume (K Tons) Forecast, by Application 2020 & 2033
- Table 51: Global Non-Conductive Ink Market Revenue Million Forecast, by Substrate Type 2020 & 2033
- Table 52: Global Non-Conductive Ink Market Volume K Tons Forecast, by Substrate Type 2020 & 2033
- Table 53: Global Non-Conductive Ink Market Revenue Million Forecast, by Application 2020 & 2033
- Table 54: Global Non-Conductive Ink Market Volume K Tons Forecast, by Application 2020 & 2033
- Table 55: Global Non-Conductive Ink Market Revenue Million Forecast, by Country 2020 & 2033
- Table 56: Global Non-Conductive Ink Market Volume K Tons Forecast, by Country 2020 & 2033
- Table 57: Brazil Non-Conductive Ink Market Revenue (Million) Forecast, by Application 2020 & 2033
- Table 58: Brazil Non-Conductive Ink Market Volume (K Tons) Forecast, by Application 2020 & 2033
- Table 59: Argentina Non-Conductive Ink Market Revenue (Million) Forecast, by Application 2020 & 2033
- Table 60: Argentina Non-Conductive Ink Market Volume (K Tons) Forecast, by Application 2020 & 2033
- Table 61: Rest of South America Non-Conductive Ink Market Revenue (Million) Forecast, by Application 2020 & 2033
- Table 62: Rest of South America Non-Conductive Ink Market Volume (K Tons) Forecast, by Application 2020 & 2033
- Table 63: Global Non-Conductive Ink Market Revenue Million Forecast, by Substrate Type 2020 & 2033
- Table 64: Global Non-Conductive Ink Market Volume K Tons Forecast, by Substrate Type 2020 & 2033
- Table 65: Global Non-Conductive Ink Market Revenue Million Forecast, by Application 2020 & 2033
- Table 66: Global Non-Conductive Ink Market Volume K Tons Forecast, by Application 2020 & 2033
- Table 67: Global Non-Conductive Ink Market Revenue Million Forecast, by Country 2020 & 2033
- Table 68: Global Non-Conductive Ink Market Volume K Tons Forecast, by Country 2020 & 2033
- Table 69: Saudi Arabia Non-Conductive Ink Market Revenue (Million) Forecast, by Application 2020 & 2033
- Table 70: Saudi Arabia Non-Conductive Ink Market Volume (K Tons) Forecast, by Application 2020 & 2033
- Table 71: South Africa Non-Conductive Ink Market Revenue (Million) Forecast, by Application 2020 & 2033
- Table 72: South Africa Non-Conductive Ink Market Volume (K Tons) Forecast, by Application 2020 & 2033
- Table 73: Rest of Middle East and Africa Non-Conductive Ink Market Revenue (Million) Forecast, by Application 2020 & 2033
- Table 74: Rest of Middle East and Africa Non-Conductive Ink Market Volume (K Tons) Forecast, by Application 2020 & 2033
Frequently Asked Questions
1. What is the projected Compound Annual Growth Rate (CAGR) of the Non-Conductive Ink Market?
The projected CAGR is approximately 6.00%.
2. Which companies are prominent players in the Non-Conductive Ink Market?
Key companies in the market include Poly-ink, Teikoku Printing Inks Mfg Co Ltd, SunChemical, DuPont, Vorbeck Materials, Applied Ink Solutions, Henkel Corporation, Creative Materials Inc, Nagase America LLC, NovaCentrix.
3. What are the main segments of the Non-Conductive Ink Market?
The market segments include Substrate Type, Application.
4. Can you provide details about the market size?
The market size is estimated to be USD XX Million as of 2022.
5. What are some drivers contributing to market growth?
; Increasing Demand for Printed Circuit Boards; Growing Electronic and Electrical Industry.
6. What are the notable trends driving market growth?
Increasing Demand for Printed Circuit Boards.
7. Are there any restraints impacting market growth?
; Fluctuation in Raw Material Pricing; Unfavorable Conditions Arising Due to COVID-19 Outbreak.
8. Can you provide examples of recent developments in the market?
N/A
9. What pricing options are available for accessing the report?
Pricing options include single-user, multi-user, and enterprise licenses priced at USD 4750, USD 5250, and USD 8750 respectively.
10. Is the market size provided in terms of value or volume?
The market size is provided in terms of value, measured in Million and volume, measured in K Tons.
11. Are there any specific market keywords associated with the report?
Yes, the market keyword associated with the report is "Non-Conductive Ink Market," which aids in identifying and referencing the specific market segment covered.
12. How do I determine which pricing option suits my needs best?
The pricing options vary based on user requirements and access needs. Individual users may opt for single-user licenses, while businesses requiring broader access may choose multi-user or enterprise licenses for cost-effective access to the report.
13. Are there any additional resources or data provided in the Non-Conductive Ink Market report?
While the report offers comprehensive insights, it's advisable to review the specific contents or supplementary materials provided to ascertain if additional resources or data are available.
14. How can I stay updated on further developments or reports in the Non-Conductive Ink Market?
To stay informed about further developments, trends, and reports in the Non-Conductive Ink Market, consider subscribing to industry newsletters, following relevant companies and organizations, or regularly checking reputable industry news sources and publications.
Methodology
Step 1 - Identification of Relevant Samples Size from Population Database


Step 2 - Approaches for Defining Global Market Size (Value, Volume* & Price*)

Note*: In applicable scenarios
Step 3 - Data Sources
Primary Research
- Web Analytics
- Survey Reports
- Research Institute
- Latest Research Reports
- Opinion Leaders
Secondary Research
- Annual Reports
- White Paper
- Latest Press Release
- Industry Association
- Paid Database
- Investor Presentations

Step 4 - Data Triangulation
Involves using different sources of information in order to increase the validity of a study
These sources are likely to be stakeholders in a program - participants, other researchers, program staff, other community members, and so on.
Then we put all data in single framework & apply various statistical tools to find out the dynamic on the market.
During the analysis stage, feedback from the stakeholder groups would be compared to determine areas of agreement as well as areas of divergence