

Key Insights
The airport non-aeronautical revenue sector is projected to experience robust expansion, driven by a projected CAGR of 14.75%. This significant growth is fueled by increasing global air passenger traffic, directly correlating with higher demand for ancillary services. Airports are actively diversifying revenue streams through investments in enhanced retail, food and beverage, and car rental services, aiming to improve passenger satisfaction and revenue. Technological advancements in operational efficiency, such as improved baggage handling systems, also contribute to market expansion. While external economic factors may present temporary challenges, the sector demonstrates strong growth potential.
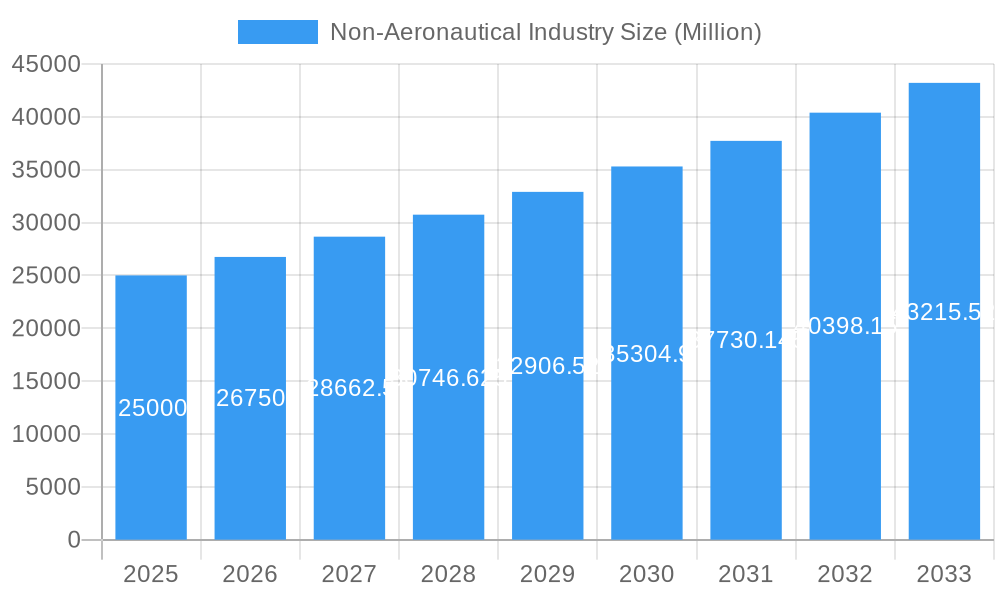
Non-Aeronautical Industry Market Size (In Billion)
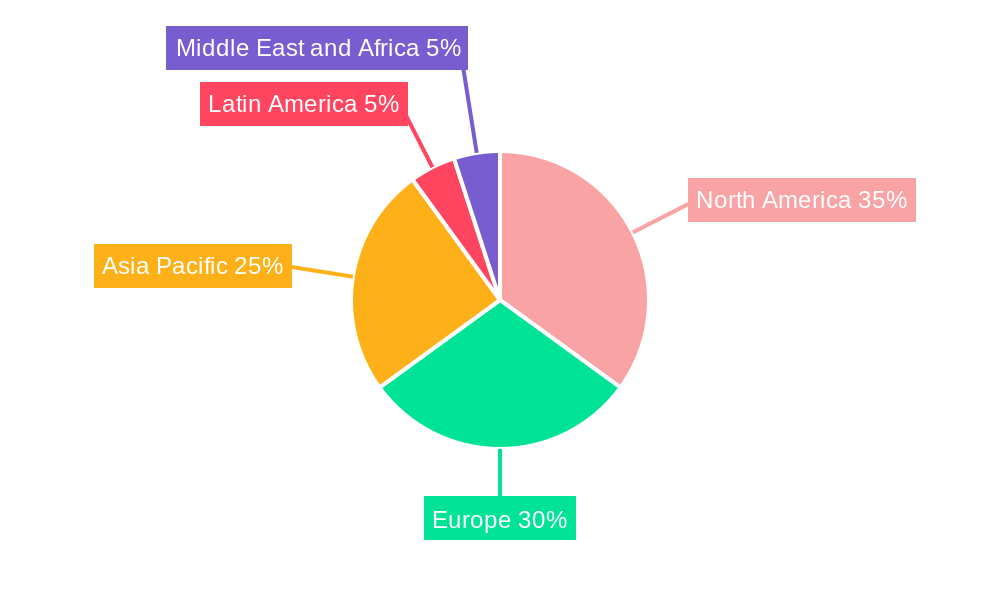
The global market is anticipated to reach $9.17 billion by 2025, with North America and Europe currently dominating market share. However, the Asia-Pacific region is expected to witness substantial growth due to rapid economic development and rising air travel demand. Key market players, including Airports de Paris SA, AENA SME SA, and Fraport Group, are investing in infrastructure and service enhancements. The forecast period of 2025-2033 will likely see continued emphasis on passenger experience through innovative offerings and efficient operational strategies, requiring strategic planning and investment by airport operators to capitalize on this burgeoning market opportunity.
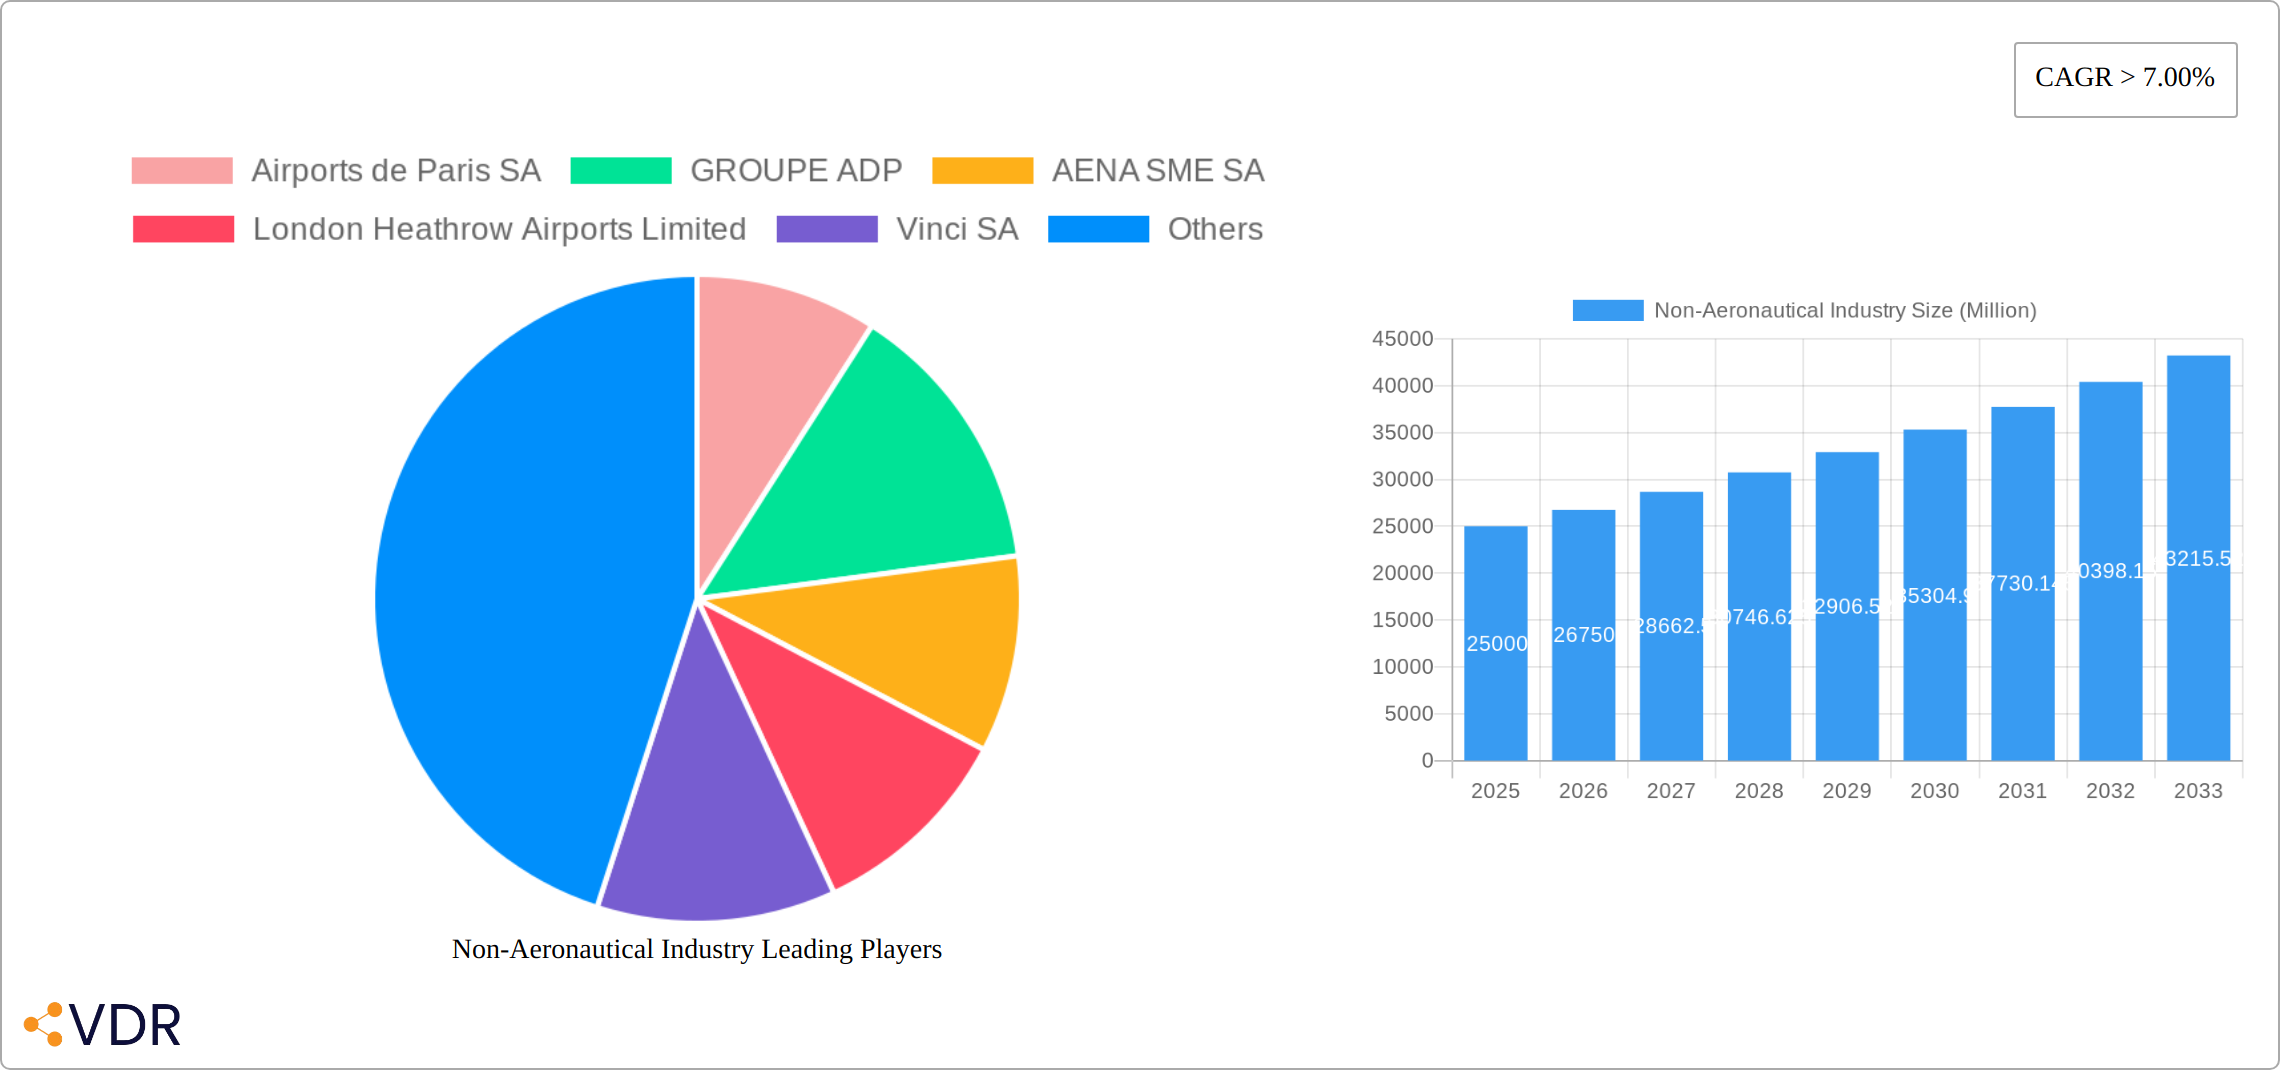
Non-Aeronautical Industry Company Market Share
Non-Aeronautical Revenue Generation at Airports: A Comprehensive Market Report (2019-2033)
This comprehensive report provides an in-depth analysis of the Non-Aeronautical Industry market, encompassing its dynamics, growth trends, dominant players, and future outlook. The study period covers 2019-2033, with a base year of 2025 and a forecast period of 2025-2033. The report segments the market by services, providing granular insights into Food Services, Car Rentals, Baggage Handling Systems, and Other Services. The parent market is the Airport industry and the child markets are the various services offered within airports. This report is invaluable for airport operators, investors, and businesses operating within the non-aeronautical sector. Total market value is projected at xx Million in 2025.
Non-Aeronautical Industry Market Dynamics & Structure
This section analyzes the competitive landscape, technological advancements, regulatory influences, and market trends within the non-aeronautical sector of the airport industry from 2019-2024. The market exhibits moderate concentration, with a few large players holding significant market share, while numerous smaller businesses compete in specialized segments.
- Market Concentration: The top 5 players (Airports de Paris SA, GROUPE ADP, AENA SME SA, London Heathrow Airports Limited, Vinci SA) collectively held an estimated 40% market share in 2024.
- Technological Innovation: Self-service kiosks, automated baggage handling, and AI-powered customer service systems are driving innovation. However, high implementation costs and integration challenges pose barriers.
- Regulatory Framework: Government regulations concerning concessions, security, and environmental standards significantly impact market dynamics. Variations in regulations across regions create complexities.
- Competitive Substitutes: E-commerce and online services offer competitive alternatives for some non-aeronautical offerings, notably retail and food delivery.
- End-User Demographics: Growing air travel demand, particularly in emerging economies, fuels the growth of non-aeronautical revenue streams. Shifting demographics impact consumer preferences and purchasing behavior.
- M&A Trends: The period 2019-2024 witnessed xx M&A deals, primarily focused on expanding service offerings and geographic reach. Consolidation is expected to continue.
Non-Aeronautical Industry Growth Trends & Insights
The non-aeronautical revenue segment of the airport industry is experiencing robust growth, fueled by a confluence of factors. The global surge in air travel, coupled with a significant shift towards higher passenger spending on non-aeronautical services, is a primary driver. This trend is amplified by advancements in airport digital infrastructure, creating enhanced customer experiences and stimulating spending across food & beverage, retail, and other ancillary services. While the COVID-19 pandemic caused a temporary downturn, the market has demonstrated a strong recovery and continued expansion. We project a Compound Annual Growth Rate (CAGR) of 5% for the period 2019-2024, escalating to a projected CAGR of 6% from 2025-2033. Market penetration of non-aeronautical revenue as a percentage of total airport revenue is forecast to reach [Insert Projected Percentage]% by 2033. This growth is further propelled by evolving consumer behavior, with a notable shift towards experience-driven purchases. Personalized services and loyalty programs are emerging as key differentiators and growth catalysts within the sector.
Dominant Regions, Countries, or Segments in Non-Aeronautical Industry
North America and Europe currently dominate the non-aeronautical market, owing to high air passenger traffic and established infrastructure. However, Asia-Pacific is experiencing the fastest growth, driven by rapid economic development and expanding aviation networks.
- Food Services: This segment is the largest revenue generator, benefiting from high passenger volumes and diversified offerings. North America holds the largest market share, fueled by a strong café culture and robust food and beverage offerings within airports.
- Car Rentals: Europe is a leading region for car rentals at airports, owing to well-established infrastructure and high tourist traffic.
- Baggage Handling Systems: Technology advancements and increased automation drive growth in this segment, with North America and Europe leading in adoption.
- Other Services: This category encompasses retail, lounges, and other services, with growth driven by factors such as increasing passenger spend and airport modernization efforts. Asia Pacific shows significant growth potential due to the expanding middle class and increasing disposable income.
Non-Aeronautical Industry Product Landscape
The non-aeronautical landscape showcases a wide range of products and services, encompassing advanced baggage handling systems with automated sorting and tracking capabilities, digital payment systems, self-service kiosks for check-in and baggage drop, and personalized retail offerings leveraging data analytics for targeted marketing. These products are designed to enhance efficiency, improve the passenger experience and maximize revenue generation for airports.
Key Drivers, Barriers & Challenges in Non-Aeronautical Industry
Key Drivers: The expansion of the non-aeronautical sector is driven by several key factors including a rising number of air passengers globally, substantial investments in airport modernization programs, and the ongoing integration of innovative technologies. Government initiatives focused on promoting tourism and bolstering infrastructure development further accelerate market expansion. The increasing adoption of contactless technologies and personalized marketing strategies also contribute to growth.
Challenges: Despite the positive growth trajectory, the non-aeronautical industry faces several challenges. Economic downturns can significantly impact consumer spending, while security concerns and intense competition among service providers create ongoing pressure. The need for continuous technological upgrades to maintain competitiveness and enhance the passenger experience represents a significant investment. Supply chain disruptions and labor shortages pose operational and profitability risks. These factors are estimated to cause a [Insert Projected Percentage]% reduction in growth in 2026. Additionally, adapting to evolving passenger expectations and maintaining a balance between revenue generation and passenger satisfaction remain crucial ongoing challenges.
Emerging Opportunities in Non-Aeronautical Industry
Significant untapped market potential exists in developing economies, presenting lucrative opportunities for expansion. The integration of advanced technologies such as Artificial Intelligence (AI) and the Internet of Things (IoT) offers substantial potential for enhanced service delivery, improved operational efficiency, and increased revenue generation. The focus on creating personalized and seamless passenger journeys, coupled with a growing emphasis on sustainable and environmentally conscious practices, represents key areas of focus for future growth and differentiation.
Growth Accelerators in the Non-Aeronautical Industry Industry
Strategic partnerships between airport operators and service providers are accelerating growth. Technological breakthroughs are further driving innovation and efficiency improvements. Expansion into new markets and diversification of service offerings are key strategies for sustained growth.
Key Players Shaping the Non-Aeronautical Industry Market
- Airports de Paris SA
- GROUPE ADP
- AENA SME SA
- London Heathrow Airports Limited
- Vinci SA
- Fraport Group
- Korea Airports Corporation
- Airports of Thailand Plc
- Airport Authority Hong Kong
- Japan Airport Terminal Co Ltd
Notable Milestones in Non-Aeronautical Industry Sector
- 2021: Several airports implemented enhanced digital health protocols, influencing passenger flow and service offerings.
- 2022: Significant investments were made in sustainable infrastructure and operations across the industry.
- 2023: Several major airport operators partnered with technology companies to integrate AI-driven solutions.
- 2024: Expansion of contactless payment options and self-service technologies were widely adopted.
In-Depth Non-Aeronautical Industry Market Outlook
The non-aeronautical sector is poised for continued growth, driven by technological innovation, increasing air travel, and a focus on enhanced passenger experiences. Strategic investments in infrastructure and technology, coupled with a focus on sustainability, will be crucial for realizing the full market potential. The market is expected to reach xx Million by 2033, representing significant opportunities for both established players and new entrants.
Non-Aeronautical Industry Segmentation
-
1. Services
- 1.1. Food Services
- 1.2. Car Rentals
- 1.3. Baggage Handling Systems
- 1.4. Other Services
Non-Aeronautical Industry Segmentation By Geography
-
1. North America
- 1.1. United States
- 1.2. Canada
-
2. Europe
- 2.1. Germany
- 2.2. United Kingdom
- 2.3. France
- 2.4. Russia
- 2.5. Rest of Europe
-
3. Asia Pacific
- 3.1. India
- 3.2. China
- 3.3. Japan
- 3.4. Rest of Asia Pacific
-
4. Latin America
- 4.1. Brazil
- 4.2. Rest of Latin America
-
5. Middle East and Africa
- 5.1. United Arab Emirates
- 5.2. Saudi Arabia
- 5.3. South Africa
- 5.4. Rest of Middle East and Africa
Non-Aeronautical Industry Regional Market Share
Geographic Coverage of Non-Aeronautical Industry
Non-Aeronautical Industry REPORT HIGHLIGHTS
| Aspects | Details |
|---|---|
| Study Period | 2020-2034 |
| Base Year | 2025 |
| Estimated Year | 2026 |
| Forecast Period | 2026-2034 |
| Historical Period | 2020-2025 |
| Growth Rate | CAGR of 14.75% from 2020-2034 |
| Segmentation |
|
Table of Contents
- 1. Introduction
- 1.1. Research Scope
- 1.2. Market Segmentation
- 1.3. Research Objective
- 1.4. Definitions and Assumptions
- 2. Executive Summary
- 2.1. Market Snapshot
- 3. Market Dynamics
- 3.1. Market Drivers
- 3.2. Market Restrains
- 3.3. Market Trends
- 3.4. Market Opportunities
- 4. Market Factor Analysis
- 4.1. Porters Five Forces
- 4.1.1. Bargaining Power of Suppliers
- 4.1.2. Bargaining Power of Buyers
- 4.1.3. Threat of New Entrants
- 4.1.4. Threat of Substitutes
- 4.1.5. Competitive Rivalry
- 4.2. PESTEL analysis
- 4.3. BCG Analysis
- 4.3.1. Stars (High Growth, High Market Share)
- 4.3.2. Cash Cows (Low Growth, High Market Share)
- 4.3.3. Question Mark (High Growth, Low Market Share)
- 4.3.4. Dogs (Low Growth, Low Market Share)
- 4.4. Ansoff Matrix Analysis
- 4.5. Supply Chain Analysis
- 4.6. Regulatory Landscape
- 4.7. Current Market Potential and Opportunity Assessment (TAM–SAM–SOM Framework)
- 4.8. VDR Analyst Note
- 4.1. Porters Five Forces
- 5. Market Analysis, Insights and Forecast 2021-2033
- 5.1. Market Analysis, Insights and Forecast - by Services
- 5.1.1. Food Services
- 5.1.2. Car Rentals
- 5.1.3. Baggage Handling Systems
- 5.1.4. Other Services
- 5.2. Market Analysis, Insights and Forecast - by Region
- 5.2.1. North America
- 5.2.2. Europe
- 5.2.3. Asia Pacific
- 5.2.4. Latin America
- 5.2.5. Middle East and Africa
- 5.1. Market Analysis, Insights and Forecast - by Services
- 6. Global Non-Aeronautical Industry Analysis, Insights and Forecast, 2021-2033
- 6.1. Market Analysis, Insights and Forecast - by Services
- 6.1.1. Food Services
- 6.1.2. Car Rentals
- 6.1.3. Baggage Handling Systems
- 6.1.4. Other Services
- 6.1. Market Analysis, Insights and Forecast - by Services
- 7. North America Non-Aeronautical Industry Analysis, Insights and Forecast, 2021-2033
- 7.1. Market Analysis, Insights and Forecast - by Services
- 7.1.1. Food Services
- 7.1.2. Car Rentals
- 7.1.3. Baggage Handling Systems
- 7.1.4. Other Services
- 7.1. Market Analysis, Insights and Forecast - by Services
- 8. Europe Non-Aeronautical Industry Analysis, Insights and Forecast, 2021-2033
- 8.1. Market Analysis, Insights and Forecast - by Services
- 8.1.1. Food Services
- 8.1.2. Car Rentals
- 8.1.3. Baggage Handling Systems
- 8.1.4. Other Services
- 8.1. Market Analysis, Insights and Forecast - by Services
- 9. Asia Pacific Non-Aeronautical Industry Analysis, Insights and Forecast, 2021-2033
- 9.1. Market Analysis, Insights and Forecast - by Services
- 9.1.1. Food Services
- 9.1.2. Car Rentals
- 9.1.3. Baggage Handling Systems
- 9.1.4. Other Services
- 9.1. Market Analysis, Insights and Forecast - by Services
- 10. Latin America Non-Aeronautical Industry Analysis, Insights and Forecast, 2021-2033
- 10.1. Market Analysis, Insights and Forecast - by Services
- 10.1.1. Food Services
- 10.1.2. Car Rentals
- 10.1.3. Baggage Handling Systems
- 10.1.4. Other Services
- 10.1. Market Analysis, Insights and Forecast - by Services
- 11. Middle East and Africa Non-Aeronautical Industry Analysis, Insights and Forecast, 2021-2033
- 11.1. Market Analysis, Insights and Forecast - by Services
- 11.1.1. Food Services
- 11.1.2. Car Rentals
- 11.1.3. Baggage Handling Systems
- 11.1.4. Other Services
- 11.1. Market Analysis, Insights and Forecast - by Services
- 12. Competitive Analysis
- 12.1. Company Profiles
- 12.1.1 Airports de Paris SA
- 12.1.1.1. Company Overview
- 12.1.1.2. Products
- 12.1.1.3. Company Financials
- 12.1.1.4. SWOT Analysis
- 12.1.2 GROUPE ADP
- 12.1.2.1. Company Overview
- 12.1.2.2. Products
- 12.1.2.3. Company Financials
- 12.1.2.4. SWOT Analysis
- 12.1.3 AENA SME SA
- 12.1.3.1. Company Overview
- 12.1.3.2. Products
- 12.1.3.3. Company Financials
- 12.1.3.4. SWOT Analysis
- 12.1.4 London Heathrow Airports Limited
- 12.1.4.1. Company Overview
- 12.1.4.2. Products
- 12.1.4.3. Company Financials
- 12.1.4.4. SWOT Analysis
- 12.1.5 Vinci SA
- 12.1.5.1. Company Overview
- 12.1.5.2. Products
- 12.1.5.3. Company Financials
- 12.1.5.4. SWOT Analysis
- 12.1.6 Fraport Group
- 12.1.6.1. Company Overview
- 12.1.6.2. Products
- 12.1.6.3. Company Financials
- 12.1.6.4. SWOT Analysis
- 12.1.7 Korea Airports Cor
- 12.1.7.1. Company Overview
- 12.1.7.2. Products
- 12.1.7.3. Company Financials
- 12.1.7.4. SWOT Analysis
- 12.1.8 Airports of Thailand Plc
- 12.1.8.1. Company Overview
- 12.1.8.2. Products
- 12.1.8.3. Company Financials
- 12.1.8.4. SWOT Analysis
- 12.1.9 Airport Authority Hong Kong
- 12.1.9.1. Company Overview
- 12.1.9.2. Products
- 12.1.9.3. Company Financials
- 12.1.9.4. SWOT Analysis
- 12.1.10 Japan Airport Terminal Co Ltd
- 12.1.10.1. Company Overview
- 12.1.10.2. Products
- 12.1.10.3. Company Financials
- 12.1.10.4. SWOT Analysis
- 12.1.1 Airports de Paris SA
- 12.2. Market Entropy
- 12.2.1 Company's Key Areas Served
- 12.2.2 Recent Developments
- 12.3. Company Market Share Analysis 2025
- 12.3.1 Top 5 Companies Market Share Analysis
- 12.3.2 Top 3 Companies Market Share Analysis
- 12.4. List of Potential Customers
- 13. Research Methodology
List of Figures
- Figure 1: Global Non-Aeronautical Industry Revenue Breakdown (billion, %) by Region 2025 & 2033
- Figure 2: North America Non-Aeronautical Industry Revenue (billion), by Services 2025 & 2033
- Figure 3: North America Non-Aeronautical Industry Revenue Share (%), by Services 2025 & 2033
- Figure 4: North America Non-Aeronautical Industry Revenue (billion), by Country 2025 & 2033
- Figure 5: North America Non-Aeronautical Industry Revenue Share (%), by Country 2025 & 2033
- Figure 6: Europe Non-Aeronautical Industry Revenue (billion), by Services 2025 & 2033
- Figure 7: Europe Non-Aeronautical Industry Revenue Share (%), by Services 2025 & 2033
- Figure 8: Europe Non-Aeronautical Industry Revenue (billion), by Country 2025 & 2033
- Figure 9: Europe Non-Aeronautical Industry Revenue Share (%), by Country 2025 & 2033
- Figure 10: Asia Pacific Non-Aeronautical Industry Revenue (billion), by Services 2025 & 2033
- Figure 11: Asia Pacific Non-Aeronautical Industry Revenue Share (%), by Services 2025 & 2033
- Figure 12: Asia Pacific Non-Aeronautical Industry Revenue (billion), by Country 2025 & 2033
- Figure 13: Asia Pacific Non-Aeronautical Industry Revenue Share (%), by Country 2025 & 2033
- Figure 14: Latin America Non-Aeronautical Industry Revenue (billion), by Services 2025 & 2033
- Figure 15: Latin America Non-Aeronautical Industry Revenue Share (%), by Services 2025 & 2033
- Figure 16: Latin America Non-Aeronautical Industry Revenue (billion), by Country 2025 & 2033
- Figure 17: Latin America Non-Aeronautical Industry Revenue Share (%), by Country 2025 & 2033
- Figure 18: Middle East and Africa Non-Aeronautical Industry Revenue (billion), by Services 2025 & 2033
- Figure 19: Middle East and Africa Non-Aeronautical Industry Revenue Share (%), by Services 2025 & 2033
- Figure 20: Middle East and Africa Non-Aeronautical Industry Revenue (billion), by Country 2025 & 2033
- Figure 21: Middle East and Africa Non-Aeronautical Industry Revenue Share (%), by Country 2025 & 2033
List of Tables
- Table 1: Global Non-Aeronautical Industry Revenue billion Forecast, by Services 2020 & 2033
- Table 2: Global Non-Aeronautical Industry Revenue billion Forecast, by Region 2020 & 2033
- Table 3: Global Non-Aeronautical Industry Revenue billion Forecast, by Services 2020 & 2033
- Table 4: Global Non-Aeronautical Industry Revenue billion Forecast, by Country 2020 & 2033
- Table 5: United States Non-Aeronautical Industry Revenue (billion) Forecast, by Application 2020 & 2033
- Table 6: Canada Non-Aeronautical Industry Revenue (billion) Forecast, by Application 2020 & 2033
- Table 7: Global Non-Aeronautical Industry Revenue billion Forecast, by Services 2020 & 2033
- Table 8: Global Non-Aeronautical Industry Revenue billion Forecast, by Country 2020 & 2033
- Table 9: Germany Non-Aeronautical Industry Revenue (billion) Forecast, by Application 2020 & 2033
- Table 10: United Kingdom Non-Aeronautical Industry Revenue (billion) Forecast, by Application 2020 & 2033
- Table 11: France Non-Aeronautical Industry Revenue (billion) Forecast, by Application 2020 & 2033
- Table 12: Russia Non-Aeronautical Industry Revenue (billion) Forecast, by Application 2020 & 2033
- Table 13: Rest of Europe Non-Aeronautical Industry Revenue (billion) Forecast, by Application 2020 & 2033
- Table 14: Global Non-Aeronautical Industry Revenue billion Forecast, by Services 2020 & 2033
- Table 15: Global Non-Aeronautical Industry Revenue billion Forecast, by Country 2020 & 2033
- Table 16: India Non-Aeronautical Industry Revenue (billion) Forecast, by Application 2020 & 2033
- Table 17: China Non-Aeronautical Industry Revenue (billion) Forecast, by Application 2020 & 2033
- Table 18: Japan Non-Aeronautical Industry Revenue (billion) Forecast, by Application 2020 & 2033
- Table 19: Rest of Asia Pacific Non-Aeronautical Industry Revenue (billion) Forecast, by Application 2020 & 2033
- Table 20: Global Non-Aeronautical Industry Revenue billion Forecast, by Services 2020 & 2033
- Table 21: Global Non-Aeronautical Industry Revenue billion Forecast, by Country 2020 & 2033
- Table 22: Brazil Non-Aeronautical Industry Revenue (billion) Forecast, by Application 2020 & 2033
- Table 23: Rest of Latin America Non-Aeronautical Industry Revenue (billion) Forecast, by Application 2020 & 2033
- Table 24: Global Non-Aeronautical Industry Revenue billion Forecast, by Services 2020 & 2033
- Table 25: Global Non-Aeronautical Industry Revenue billion Forecast, by Country 2020 & 2033
- Table 26: United Arab Emirates Non-Aeronautical Industry Revenue (billion) Forecast, by Application 2020 & 2033
- Table 27: Saudi Arabia Non-Aeronautical Industry Revenue (billion) Forecast, by Application 2020 & 2033
- Table 28: South Africa Non-Aeronautical Industry Revenue (billion) Forecast, by Application 2020 & 2033
- Table 29: Rest of Middle East and Africa Non-Aeronautical Industry Revenue (billion) Forecast, by Application 2020 & 2033
Frequently Asked Questions
1. What is the projected Compound Annual Growth Rate (CAGR) of the Non-Aeronautical Industry?
The projected CAGR is approximately 14.75%.
2. Which companies are prominent players in the Non-Aeronautical Industry?
Key companies in the market include Airports de Paris SA, GROUPE ADP, AENA SME SA, London Heathrow Airports Limited, Vinci SA, Fraport Group, Korea Airports Cor, Airports of Thailand Plc, Airport Authority Hong Kong, Japan Airport Terminal Co Ltd.
3. What are the main segments of the Non-Aeronautical Industry?
The market segments include Services.
4. Can you provide details about the market size?
The market size is estimated to be USD 9.17 billion as of 2022.
5. What are some drivers contributing to market growth?
N/A
6. What are the notable trends driving market growth?
Ground Handling Systems Will Showcase Significant Growth During the Forecast Period.
7. Are there any restraints impacting market growth?
N/A
8. Can you provide examples of recent developments in the market?
N/A
9. What pricing options are available for accessing the report?
Pricing options include single-user, multi-user, and enterprise licenses priced at USD 4750, USD 5250, and USD 8750 respectively.
10. Is the market size provided in terms of value or volume?
The market size is provided in terms of value, measured in billion.
11. Are there any specific market keywords associated with the report?
Yes, the market keyword associated with the report is "Non-Aeronautical Industry," which aids in identifying and referencing the specific market segment covered.
12. How do I determine which pricing option suits my needs best?
The pricing options vary based on user requirements and access needs. Individual users may opt for single-user licenses, while businesses requiring broader access may choose multi-user or enterprise licenses for cost-effective access to the report.
13. Are there any additional resources or data provided in the Non-Aeronautical Industry report?
While the report offers comprehensive insights, it's advisable to review the specific contents or supplementary materials provided to ascertain if additional resources or data are available.
14. How can I stay updated on further developments or reports in the Non-Aeronautical Industry?
To stay informed about further developments, trends, and reports in the Non-Aeronautical Industry, consider subscribing to industry newsletters, following relevant companies and organizations, or regularly checking reputable industry news sources and publications.
Methodology
Step 1 - Identification of Relevant Samples Size from Population Database


Step 2 - Approaches for Defining Global Market Size (Value, Volume* & Price*)

Note*: In applicable scenarios
Step 3 - Data Sources
Primary Research
- Web Analytics
- Survey Reports
- Research Institute
- Latest Research Reports
- Opinion Leaders
Secondary Research
- Annual Reports
- White Paper
- Latest Press Release
- Industry Association
- Paid Database
- Investor Presentations

Step 4 - Data Triangulation
Involves using different sources of information in order to increase the validity of a study
These sources are likely to be stakeholders in a program - participants, other researchers, program staff, other community members, and so on.
Then we put all data in single framework & apply various statistical tools to find out the dynamic on the market.
During the analysis stage, feedback from the stakeholder groups would be compared to determine areas of agreement as well as areas of divergence