Key Insights
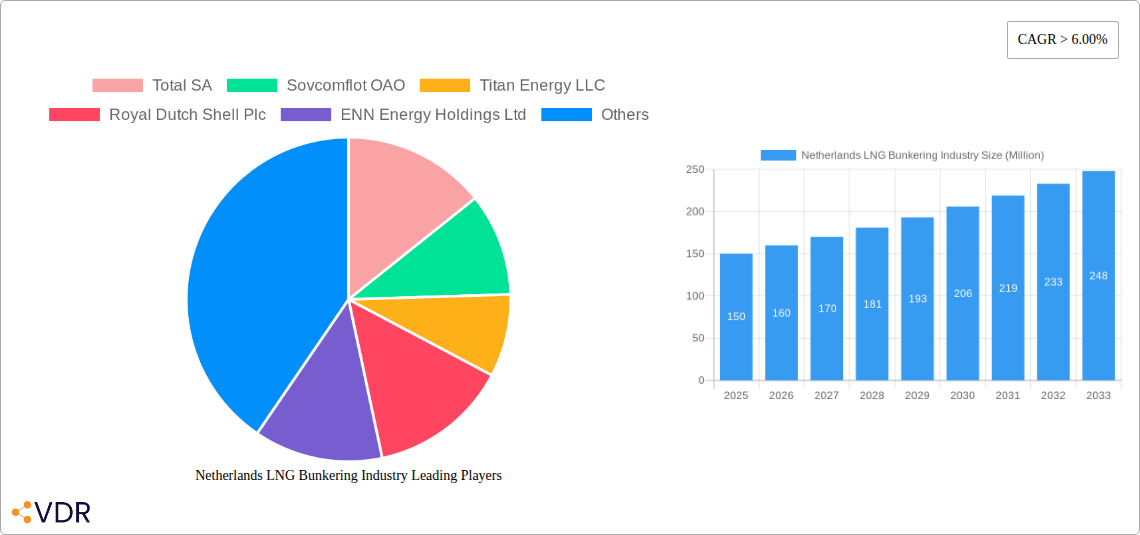
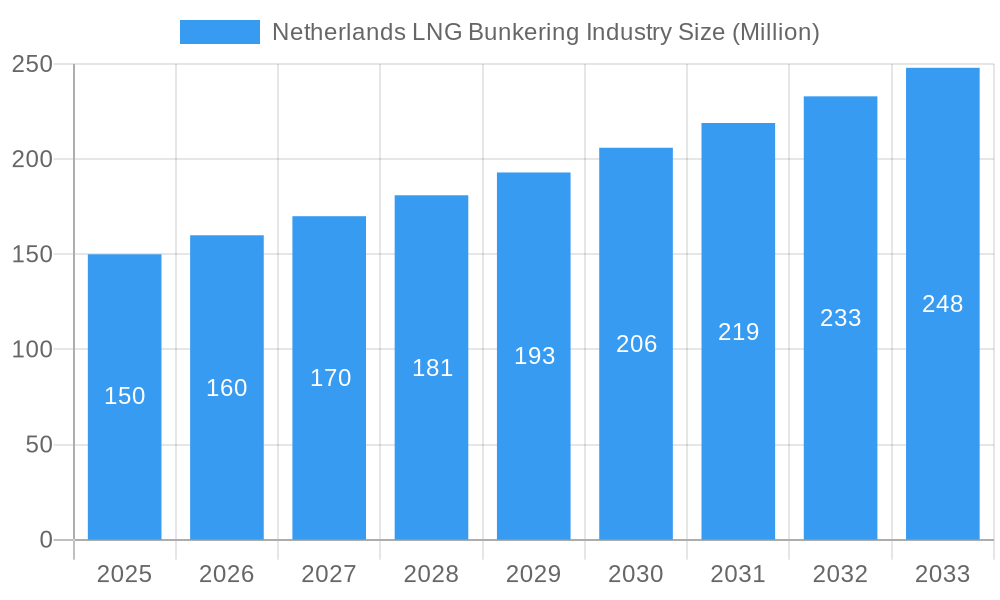
The Netherlands LNG bunkering market is poised for significant expansion, with an estimated market size of €2.33 billion by the base year 2025. The market is projected to grow at a compound annual growth rate (CAGR) of 46.6%. This robust growth is primarily attributed to stringent environmental regulations mandating reduced greenhouse gas emissions in shipping, positioning LNG as a leading alternative to conventional heavy fuel oil. The Netherlands' strategic advantage as a major European port, coupled with supportive government policies for sustainable shipping fuel infrastructure, further propels market growth. Enhanced availability of LNG bunkering facilities solidifies its role as a key regional fueling hub. Increasing adoption of LNG-powered vessels by tanker and container fleet operators also contributes to rising demand.
Netherlands LNG Bunkering Industry Market Size (In Billion)
Market segmentation highlights contributions from both LNG and Liquefied Biomethane (LBM) product categories. While LNG currently leads, LBM's market share is expected to rise with improved production and availability driven by sustainability imperatives. Leading market participants, including TotalEnergies, Sovcomflot, and Shell, are actively expanding their LNG bunkering infrastructure in the Netherlands. Intensifying competition is anticipated to drive pricing advancements and technological innovation. However, initial high infrastructure investment costs and natural gas price volatility may present short-term challenges, though the long-term market outlook remains highly favorable.
Netherlands LNG Bunkering Industry Company Market Share
Netherlands LNG Bunkering Industry: A Comprehensive Market Report (2019-2033)
This in-depth report provides a comprehensive analysis of the Netherlands LNG bunkering industry, encompassing market dynamics, growth trends, key players, and future outlook. It leverages extensive data analysis to provide crucial insights for industry professionals, investors, and strategic decision-makers. The report covers the period from 2019 to 2033, with a focus on the base year 2025 and a forecast period of 2025-2033. The analysis covers both the parent market (maritime fuel bunkering) and the child market (LNG bunkering in Netherlands). Market values are presented in millions of units.
Keywords: Netherlands LNG bunkering, LNG bunkering market, maritime fuel, liquefied natural gas, liquefied biomethane, LBM, Amsterdam port, Rotterdam port, Antwerp port, shipping fuel, bunkering industry, maritime transportation, sustainable shipping, LNG supply chain, Titan LNG, Royal Dutch Shell, Total SA, Engie.
Netherlands LNG Bunkering Industry Market Dynamics & Structure
The Netherlands LNG bunkering market exhibits a moderately concentrated structure, with key players like Royal Dutch Shell Plc, Total SA, and Engie SA holding significant market share. Technological innovation, driven by the need for cleaner shipping fuels and stricter environmental regulations, is a major driver. The regulatory framework, including EU emissions directives, plays a crucial role in shaping market growth. Competition from traditional marine fuels (heavy fuel oil) remains a significant challenge, although the increasing adoption of LNG is gradually shifting the competitive landscape. End-user demographics are evolving with a growing emphasis on environmentally conscious shipping companies. M&A activity in the sector, while not exceptionally high, shows strategic moves by larger players to consolidate market positions and access new technologies. The historical period (2019-2024) shows a xx% growth rate, with xx% market share held by the top three companies. The estimated market size in 2025 is projected to be xx million, with a forecast of xx million by 2033.
- Market Concentration: Moderately concentrated, with top 3 players holding approximately xx% market share in 2024.
- Technological Innovation: Driven by emission reduction targets and advancements in LNG bunkering technology.
- Regulatory Framework: Stringent EU regulations incentivize LNG adoption.
- Competitive Substitutes: Heavy fuel oil remains a major competitor.
- M&A Activity: Moderate level of consolidation through strategic acquisitions.
- Innovation Barriers: High initial capital investment for infrastructure development.
Netherlands LNG Bunkering Industry Growth Trends & Insights
The Netherlands LNG bunkering market has witnessed significant growth in recent years, driven by increasing environmental concerns and supportive government policies. The adoption rate of LNG as a marine fuel has steadily increased, especially among the tanker fleet segment. Technological disruptions, such as the development of more efficient LNG bunkering vessels and improved storage technology, have further accelerated market expansion. Shifts in consumer behavior towards sustainable shipping practices have also positively impacted demand. The Compound Annual Growth Rate (CAGR) during the historical period (2019-2024) was xx%, while market penetration reached approximately xx% by 2024. The forecast period (2025-2033) projects a CAGR of xx%, leading to a considerable increase in market size and further penetration in various shipping segments. Specific details on market size evolution and adoption rates across different segments will be further analyzed in the report.
Dominant Regions, Countries, or Segments in Netherlands LNG Bunkering Industry
The Port of Rotterdam, being a major European shipping hub, dominates the Netherlands LNG bunkering market. Amsterdam and other key ports also contribute significantly. Within end-user segments, the tanker fleet currently shows the highest adoption rate of LNG, driven by stringent emissions regulations and the economic viability of LNG as a fuel. The growth of the LNG bunkering market is further accelerated by policies promoting sustainable shipping practices and incentives for LNG adoption. Growth potential lies in expanding adoption across the container fleet, bulk & general cargo fleet, ferries & OSV segments. The LBM segment is emerging as a strong contributor, further boosting growth.
- Key Drivers:
- Stringent environmental regulations in the EU.
- Government incentives for LNG adoption.
- Development of advanced LNG bunkering infrastructure.
- Growing preference for sustainable shipping solutions.
- Dominance Factors:
- Port of Rotterdam's strategic location and infrastructure.
- High adoption rate among tanker fleets.
- Strong support from governmental policies.
Netherlands LNG Bunkering Industry Product Landscape
The product landscape encompasses primarily Liquefied Natural Gas (LNG) and the emerging Liquefied Biomethane (LBM) segment. Technological advancements focus on improving LNG storage and bunkering efficiency, reducing emissions, and enhancing safety. LBM offers a further step towards sustainable shipping solutions by utilizing renewable biogas. The unique selling proposition of LNG and LBM lies in their reduced greenhouse gas emissions compared to traditional marine fuels.
Key Drivers, Barriers & Challenges in Netherlands LNG Bunkering Industry
Key Drivers: Growing environmental concerns and stricter regulations are pushing the adoption of cleaner fuels like LNG. Technological advancements in LNG bunkering technology and infrastructure are making the transition more efficient and cost-effective. Government support through incentives and subsidies further accelerate market growth.
Key Challenges: High initial investment costs for LNG bunkering infrastructure remain a barrier. Limited availability of LBM, despite its potential, poses a challenge. Competition from existing fuels and the price volatility of LNG are also significant considerations. The report will further quantify these challenges, illustrating their impact on market expansion.
Emerging Opportunities in Netherlands LNG Bunkering Industry
Expansion into smaller ports and coastal areas presents a significant opportunity. The increasing demand for LBM provides a pathway to further reduce emissions and support sustainable practices. Technological advancements, such as the development of more efficient and cost-effective bunkering solutions, will open new market segments.
Growth Accelerators in the Netherlands LNG Bunkering Industry Industry
Technological breakthroughs, particularly in LBM production and LNG bunkering equipment, will further accelerate market growth. Strategic partnerships between energy companies and shipping lines are crucial for seamless integration and broader adoption. Market expansion strategies targeting underserved shipping segments can drive future growth.
Key Players Shaping the Netherlands LNG Bunkering Industry Market
- Total SA
- Sovcomflot OAO
- Titan Energy LLC
- Royal Dutch Shell Plc
- ENN Energy Holdings Ltd
- Houpu Clean Energy Co Ltd
- Engie SA *List Not Exhaustive
Notable Milestones in Netherlands LNG Bunkering Industry Sector
- July 2022: Titan LNG expands its fleet with a fifth LNG bunkering vessel, boosting LNG supply in ARA and Zeebrugge ports.
- October 2022: Titan LNG announces plans to produce 200,000 tonnes of LBM per year in the Port of Amsterdam, signifying a significant step towards sustainable bunkering.
In-Depth Netherlands LNG Bunkering Industry Market Outlook
The Netherlands LNG bunkering market holds significant potential for future growth, driven by continued advancements in technology, supportive government policies, and increasing awareness of environmental sustainability in the maritime sector. Strategic partnerships and investments in infrastructure will play key roles in unlocking this potential, especially with the expansion of LBM production and adoption. The market is poised for significant expansion over the forecast period, with substantial opportunities for players who can adapt to changing market dynamics and technological advancements.
Netherlands LNG Bunkering Industry Segmentation
-
1. End-User
- 1.1. Tanker Fleet
- 1.2. Container Fleet
- 1.3. Bulk & General Cargo Fleet
- 1.4. Ferries & OSV
- 1.5. Others
Netherlands LNG Bunkering Industry Segmentation By Geography
- 1. Netherlands
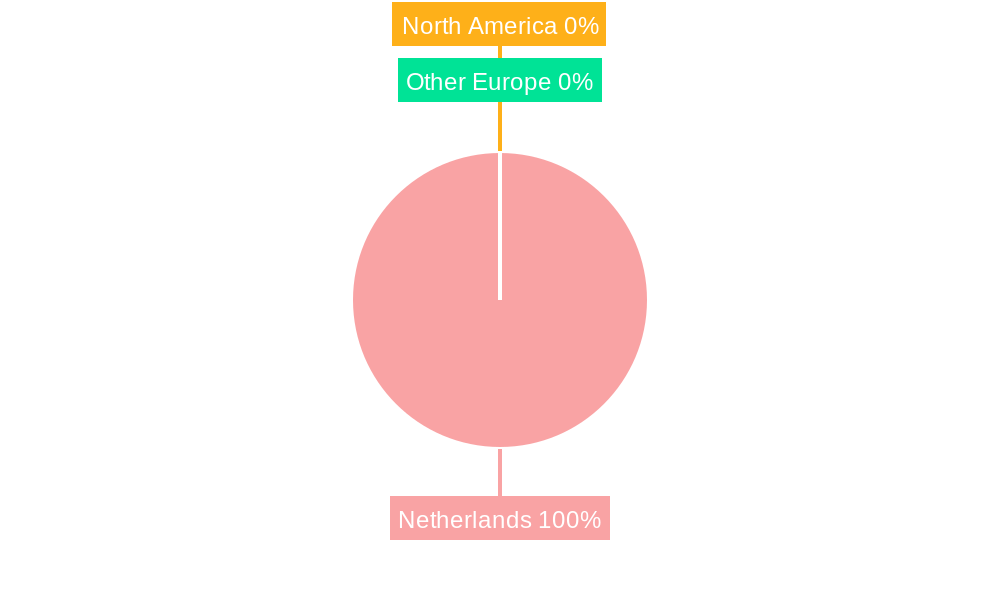
Netherlands LNG Bunkering Industry Regional Market Share
Geographic Coverage of Netherlands LNG Bunkering Industry
Netherlands LNG Bunkering Industry REPORT HIGHLIGHTS
| Aspects | Details |
|---|---|
| Study Period | 2020-2034 |
| Base Year | 2025 |
| Estimated Year | 2026 |
| Forecast Period | 2026-2034 |
| Historical Period | 2020-2025 |
| Growth Rate | CAGR of 46.6% from 2020-2034 |
| Segmentation |
|
Table of Contents
- 1. Introduction
- 1.1. Research Scope
- 1.2. Market Segmentation
- 1.3. Research Methodology
- 1.4. Definitions and Assumptions
- 2. Executive Summary
- 2.1. Introduction
- 3. Market Dynamics
- 3.1. Introduction
- 3.2. Market Drivers
- 3.2.1. 4.; Increasing Offshore Exploration and Production Activities4.; Development of Offshore Wind Energy
- 3.3. Market Restrains
- 3.3.1. 4.; Rising Demand for Dynamic Positioning (DP) Drilling Rigs
- 3.4. Market Trends
- 3.4.1. Ferries & OSV to Dominate the Market
- 4. Market Factor Analysis
- 4.1. Porters Five Forces
- 4.2. Supply/Value Chain
- 4.3. PESTEL analysis
- 4.4. Market Entropy
- 4.5. Patent/Trademark Analysis
- 5. Netherlands LNG Bunkering Industry Analysis, Insights and Forecast, 2020-2032
- 5.1. Market Analysis, Insights and Forecast - by End-User
- 5.1.1. Tanker Fleet
- 5.1.2. Container Fleet
- 5.1.3. Bulk & General Cargo Fleet
- 5.1.4. Ferries & OSV
- 5.1.5. Others
- 5.2. Market Analysis, Insights and Forecast - by Region
- 5.2.1. Netherlands
- 5.1. Market Analysis, Insights and Forecast - by End-User
- 6. Competitive Analysis
- 6.1. Market Share Analysis 2025
- 6.2. Company Profiles
- 6.2.1 Total SA
- 6.2.1.1. Overview
- 6.2.1.2. Products
- 6.2.1.3. SWOT Analysis
- 6.2.1.4. Recent Developments
- 6.2.1.5. Financials (Based on Availability)
- 6.2.2 Sovcomflot OAO
- 6.2.2.1. Overview
- 6.2.2.2. Products
- 6.2.2.3. SWOT Analysis
- 6.2.2.4. Recent Developments
- 6.2.2.5. Financials (Based on Availability)
- 6.2.3 Titan Energy LLC
- 6.2.3.1. Overview
- 6.2.3.2. Products
- 6.2.3.3. SWOT Analysis
- 6.2.3.4. Recent Developments
- 6.2.3.5. Financials (Based on Availability)
- 6.2.4 Royal Dutch Shell Plc
- 6.2.4.1. Overview
- 6.2.4.2. Products
- 6.2.4.3. SWOT Analysis
- 6.2.4.4. Recent Developments
- 6.2.4.5. Financials (Based on Availability)
- 6.2.5 ENN Energy Holdings Ltd
- 6.2.5.1. Overview
- 6.2.5.2. Products
- 6.2.5.3. SWOT Analysis
- 6.2.5.4. Recent Developments
- 6.2.5.5. Financials (Based on Availability)
- 6.2.6 Houpu Clean Energy Co Ltd
- 6.2.6.1. Overview
- 6.2.6.2. Products
- 6.2.6.3. SWOT Analysis
- 6.2.6.4. Recent Developments
- 6.2.6.5. Financials (Based on Availability)
- 6.2.7 Engie SA*List Not Exhaustive
- 6.2.7.1. Overview
- 6.2.7.2. Products
- 6.2.7.3. SWOT Analysis
- 6.2.7.4. Recent Developments
- 6.2.7.5. Financials (Based on Availability)
- 6.2.1 Total SA
List of Figures
- Figure 1: Netherlands LNG Bunkering Industry Revenue Breakdown (billion, %) by Product 2025 & 2033
- Figure 2: Netherlands LNG Bunkering Industry Share (%) by Company 2025
List of Tables
- Table 1: Netherlands LNG Bunkering Industry Revenue billion Forecast, by End-User 2020 & 2033
- Table 2: Netherlands LNG Bunkering Industry Revenue billion Forecast, by Region 2020 & 2033
- Table 3: Netherlands LNG Bunkering Industry Revenue billion Forecast, by End-User 2020 & 2033
- Table 4: Netherlands LNG Bunkering Industry Revenue billion Forecast, by Country 2020 & 2033
Frequently Asked Questions
1. What is the projected Compound Annual Growth Rate (CAGR) of the Netherlands LNG Bunkering Industry?
The projected CAGR is approximately 46.6%.
2. Which companies are prominent players in the Netherlands LNG Bunkering Industry?
Key companies in the market include Total SA, Sovcomflot OAO, Titan Energy LLC, Royal Dutch Shell Plc, ENN Energy Holdings Ltd, Houpu Clean Energy Co Ltd, Engie SA*List Not Exhaustive.
3. What are the main segments of the Netherlands LNG Bunkering Industry?
The market segments include End-User.
4. Can you provide details about the market size?
The market size is estimated to be USD 2.33 billion as of 2022.
5. What are some drivers contributing to market growth?
4.; Increasing Offshore Exploration and Production Activities4.; Development of Offshore Wind Energy.
6. What are the notable trends driving market growth?
Ferries & OSV to Dominate the Market.
7. Are there any restraints impacting market growth?
4.; Rising Demand for Dynamic Positioning (DP) Drilling Rigs.
8. Can you provide examples of recent developments in the market?
In October 2022, Titan LNG announced plans to produce 200,000 tonnes of liquefied biomethane (LBM) per year in the Port of Amsterdam. BioValue will supply a significant part of the biogas required for the total LBM production and will construct a new biogas plant next to the LBM plant.
9. What pricing options are available for accessing the report?
Pricing options include single-user, multi-user, and enterprise licenses priced at USD 3800, USD 4500, and USD 5800 respectively.
10. Is the market size provided in terms of value or volume?
The market size is provided in terms of value, measured in billion.
11. Are there any specific market keywords associated with the report?
Yes, the market keyword associated with the report is "Netherlands LNG Bunkering Industry," which aids in identifying and referencing the specific market segment covered.
12. How do I determine which pricing option suits my needs best?
The pricing options vary based on user requirements and access needs. Individual users may opt for single-user licenses, while businesses requiring broader access may choose multi-user or enterprise licenses for cost-effective access to the report.
13. Are there any additional resources or data provided in the Netherlands LNG Bunkering Industry report?
While the report offers comprehensive insights, it's advisable to review the specific contents or supplementary materials provided to ascertain if additional resources or data are available.
14. How can I stay updated on further developments or reports in the Netherlands LNG Bunkering Industry?
To stay informed about further developments, trends, and reports in the Netherlands LNG Bunkering Industry, consider subscribing to industry newsletters, following relevant companies and organizations, or regularly checking reputable industry news sources and publications.
Methodology
Step 1 - Identification of Relevant Samples Size from Population Database


Step 2 - Approaches for Defining Global Market Size (Value, Volume* & Price*)

Note*: In applicable scenarios
Step 3 - Data Sources
Primary Research
- Web Analytics
- Survey Reports
- Research Institute
- Latest Research Reports
- Opinion Leaders
Secondary Research
- Annual Reports
- White Paper
- Latest Press Release
- Industry Association
- Paid Database
- Investor Presentations

Step 4 - Data Triangulation
Involves using different sources of information in order to increase the validity of a study
These sources are likely to be stakeholders in a program - participants, other researchers, program staff, other community members, and so on.
Then we put all data in single framework & apply various statistical tools to find out the dynamic on the market.
During the analysis stage, feedback from the stakeholder groups would be compared to determine areas of agreement as well as areas of divergence

