

Key Insights
The North American e-cigarette market, a significant segment of the global industry exhibiting a 17.60% CAGR, presents a compelling investment landscape. Driven by factors such as increasing awareness of vaping as a smoking cessation tool, the rising popularity of flavored e-liquids, and innovative product developments like advanced vaping devices with temperature control and customizable settings, the market is poised for substantial growth. However, stringent regulatory measures imposed by the FDA and growing public health concerns regarding the long-term effects of vaping, particularly among youth, pose significant challenges. The market segmentation reveals a preference for disposable models, driven by convenience and affordability, yet the rechargeable but disposable cartomizer segment is showing promising growth potential, balancing convenience with environmental consciousness. Major players like Juul Labs Inc., Altria Group Inc., and international tobacco giants like British American Tobacco plc and Japan Tobacco Inc. are vying for market share through aggressive marketing strategies and product diversification. The competitive landscape is dynamic, with ongoing innovation and consolidation shaping the future trajectory.
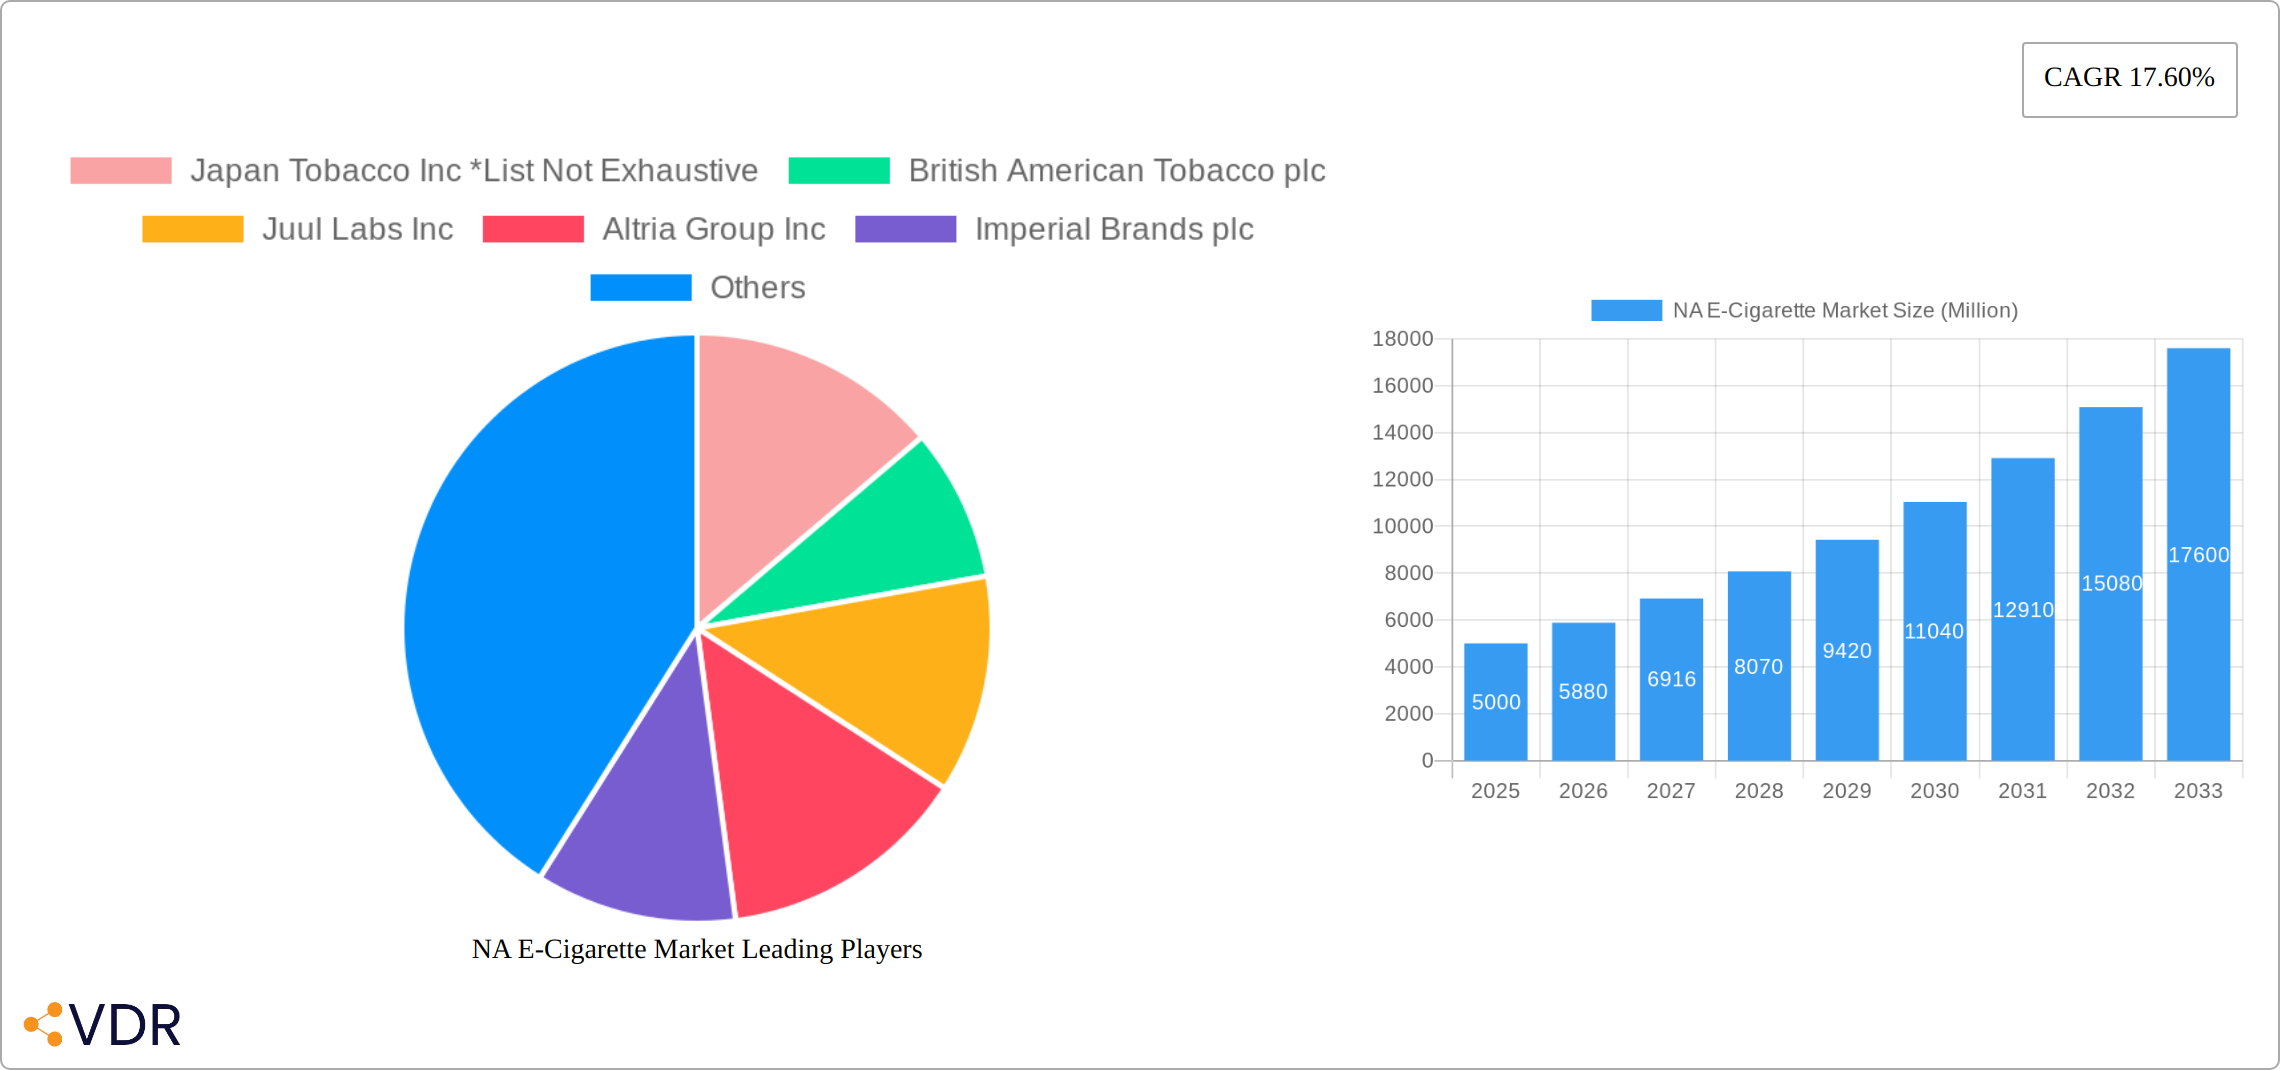
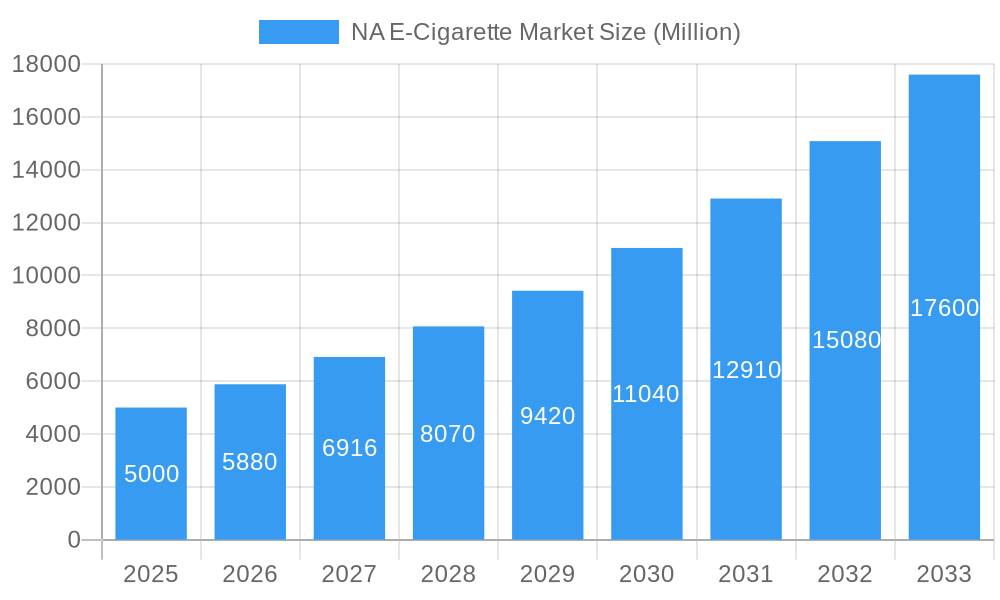
NA E-Cigarette Market Market Size (In Billion)
The North American market is segmented by battery mode (automatic and manual e-cigarettes) and product type (completely disposable, rechargeable but disposable cartomizers, and personalized vaporizers). Considering the global CAGR of 17.60%, and the significant presence of major players in North America, it's reasonable to assume that the North American market's growth rate is also substantial, potentially exceeding the global average due to higher per capita consumption and technological innovation within the region. While precise market sizing for North America is unavailable, projecting from the global data suggests a substantial market value exceeding several billion dollars by 2033. Future growth will depend on a successful balance between innovation, regulatory compliance, and addressing public health concerns surrounding vaping. The increasing focus on harm reduction strategies and the development of safer vaping technologies could also significantly impact market growth.
NA E-Cigarette Market Company Market Share
North American E-Cigarette Market Report: 2019-2033
This comprehensive report provides an in-depth analysis of the North American e-cigarette market, encompassing market dynamics, growth trends, regional performance, and key player strategies from 2019 to 2033. With a focus on both the parent market (Tobacco Alternatives) and child market (E-cigarettes), this report is invaluable for industry professionals, investors, and strategic planners seeking actionable insights into this rapidly evolving sector. The report utilizes data from the base year 2025, with estimations for 2025 and forecasts extending to 2033, covering the historical period of 2019-2024. Market values are presented in million units.
NA E-Cigarette Market Market Dynamics & Structure
The North American e-cigarette market is a dynamic landscape shaped by intense competition, evolving regulations, and rapid technological advancements. This section provides a detailed analysis of the market's competitive structure, regulatory environment, and the influence of innovation on market growth. We examine market concentration, identifying key players such as Japan Tobacco Inc, British American Tobacco plc, Juul Labs Inc, Altria Group Inc, and Imperial Brands plc (this list is not exhaustive), and analyze their respective market shares. The impact of technological innovations, including breakthroughs in battery technology, e-liquid formulations (exploring advancements in flavor profiles and nicotine delivery systems), and device design (such as pod systems and disposable vapes), are assessed in relation to market expansion and consumer preference. Furthermore, the analysis critically evaluates the influence of the ever-changing regulatory landscape, encompassing federal regulations like those enforced by the FDA and the diverse state-level restrictions across North America, on market access, product development, and overall market dynamics. We also consider the competitive pressures from substitute nicotine products, such as traditional cigarettes, nicotine pouches, and emerging alternatives like heated tobacco products. Finally, a demographic analysis of end-users, focusing on age groups, income levels, and smoking habits, along with the impact of mergers and acquisitions (M&A) activity on market consolidation, is provided. Specific data points regarding market concentration, M&A activity, and other key metrics will be presented in the accompanying data tables.
- Market Concentration: A detailed analysis of market share among top players in 2025, including precise figures and potential future projections.
- Technological Innovation: Specific examples of advancements in battery life, flavor profiles, and innovative device features, including data on adoption rates and consumer feedback.
- Regulatory Framework: A comprehensive overview of FDA regulations, highlighting specific key restrictions on flavors, marketing, and product development, along with a state-by-state breakdown of varying regulations and their impact on market access.
- Competitive Substitutes: Analysis of the market share and competitive pressures from traditional cigarettes, nicotine pouches, heated tobacco products, and other cessation aids.
- End-User Demographics: Detailed breakdown of user demographics, including age ranges, income brackets, and smoking history, using data to illustrate key trends and shifts.
- M&A Activity: Precise figures on the number of M&A deals recorded between 2019-2024, detailed projections for 2025-2033, and an analysis of the impact of these mergers on market consolidation and competitiveness.
NA E-Cigarette Market Growth Trends & Insights
This section provides a detailed analysis of the North American e-cigarette market's growth trajectory. We examine market size evolution from 2019 to 2024 and project its growth from 2025 to 2033, calculating the Compound Annual Growth Rate (CAGR). The analysis will incorporate adoption rates across different demographics, assessing the factors driving adoption and identifying key market segments showing the highest growth. Furthermore, we examine how technological disruptions, such as the introduction of new device types and e-liquids, and shifts in consumer behavior, including changing preferences for flavors and nicotine strength, have shaped market growth.
- Market Size: The market size in 2025 is estimated at xx million units, projected to reach xx million units by 2033.
- CAGR (2025-2033): xx%
- Market Penetration: xx% in 2025, projected to reach xx% by 2033.
- Technological Disruptions: The emergence of disposable vapes and pod systems significantly impacted market share.
- Consumer Behavior Shifts: Growing preference for healthier alternatives and personalized vaping experiences.
Dominant Regions, Countries, or Segments in NA E-Cigarette Market
This section identifies the leading regions, countries, and market segments within the North American e-cigarette market, providing a detailed breakdown of market performance. We analyze the market share and growth potential of various segments, categorized by battery mode (Automatic E-Cigarette, Manual E-Cigarette) and product type (Completely Disposable Model, Rechargeable but Disposable Cartomizer, Personalized Vaporizer). The analysis pinpoints the key factors driving dominance in specific regions or segments, exploring economic policies, infrastructure development, consumer preferences, and cultural factors influencing adoption rates. We also analyze the impact of regional regulations and variations in consumer behavior on market performance, providing specific examples of how regulatory differences influence sales in different states or regions. Supporting data will be included to illustrate these trends.
- Leading Segment: Precise market share figures for Completely Disposable Models, supported by analysis of the reasons for their dominance, such as convenience and affordability.
- Fastest-Growing Segment: Detailed growth projections for Personalized Vaporizers, supported by an examination of factors driving their growth, such as customization options and consumer preferences.
- Key Regional Drivers: Analysis of California and New York's high market penetration, including data on market share, population demographics, and regulatory influences.
- Dominance Factors: A detailed analysis of the key factors driving market leadership in various segments, including brand recognition, marketing strategies, product innovation, and pricing strategies.
NA E-Cigarette Market Product Landscape
This section provides an overview of the product landscape, highlighting key innovations, applications, and performance metrics of e-cigarettes available in the North American market. We examine the unique selling propositions of different products, such as advanced battery technology, innovative coil designs, and diverse flavor profiles. We also analyze the technological advancements driving product differentiation and performance improvements, focusing on areas like battery life, vapor production, and user experience.
The market showcases a diverse range of e-cigarettes, from simple disposable devices to sophisticated personalized vaporizers, each with unique features and selling points. Technological innovations constantly redefine user experience and performance, driving competition and market growth.
Key Drivers, Barriers & Challenges in NA E-Cigarette Market
This section provides a comprehensive analysis of the key factors driving market growth and the significant challenges hindering its expansion. Drivers include technological advancements (e.g., improved battery technology, diverse flavors, and innovative nicotine delivery systems), economic factors (e.g., disposable income levels, economic downturns and their impact on purchasing decisions), and the influence of supportive policies (e.g., reduced taxation in some states, contrasted with states implementing higher taxes). Conversely, we examine significant challenges such as stringent regulations (e.g., FDA restrictions on flavors, advertising, and sales to minors, detailed information on age limits and verification procedures), supply chain disruptions (e.g., material shortages, manufacturing bottlenecks, global trade issues), and the impact of intense competition from both established players and new entrants. The analysis will quantify the impact of these factors on market growth using precise data and projections where possible.
Drivers: Detailed analysis of technological innovation, consumer demand trends, changing smoking rates, and the emergence of new product categories.
Barriers: In-depth analysis of strict regulations, health concerns and public perception, and the evolving landscape of public health campaigns and related media coverage.
Emerging Opportunities in NA E-Cigarette Market
This section explores emerging trends and opportunities within the North American e-cigarette market. Opportunities include untapped markets (e.g., specific demographics, underserved regions), innovative applications (e.g., integration with wellness apps, personalized nicotine delivery), and evolving consumer preferences (e.g., demand for healthier e-liquids, sustainable packaging).
Growth Accelerators in the NA E-Cigarette Market Industry
This section identifies long-term growth catalysts for the e-cigarette market, examining key factors driving future growth. Technological breakthroughs (e.g., improved battery technology, development of new nicotine delivery systems), strategic partnerships (e.g., collaborations between manufacturers and retailers), and expansion strategies (e.g., international expansion, targeting new demographic segments, expansion into emerging markets) are analyzed in detail, with concrete examples and future projections based on current market trends.
Key Players Shaping the NA E-Cigarette Market Market
Notable Milestones in NA E-Cigarette Market Sector
- 2020-06: Detailed explanation of the FDA's new regulations for e-cigarette flavors, including their specific impact on the market.
- 2021-12: Comprehensive details on the new product line launched by the major e-cigarette manufacturer, including target demographic, sales figures (with sources cited), and market impact.
- 2022-09: In-depth analysis of the significant merger between two e-cigarette companies, including the resulting market share, competitive implications, and long-term effects.
- Add other notable milestones with details and analysis.
In-Depth NA E-Cigarette Market Market Outlook
The North American e-cigarette market exhibits strong growth potential, driven by ongoing technological advancements, evolving consumer preferences, and strategic market expansion initiatives by key players. Despite regulatory challenges, the market is expected to maintain a robust growth trajectory, presenting significant opportunities for established players and new entrants. Future market success will hinge on innovation, regulatory compliance, and consumer engagement strategies.
NA E-Cigarette Market Segmentation
-
1. Product
- 1.1. Completely Disposable Model
- 1.2. Rechargeable but Disposable Cartomizer
- 1.3. Personalized Vaporizer
-
2. Battery Mode
- 2.1. Automatic E-Cigarette
- 2.2. Manual E-Cigarette
-
3. Geography
- 3.1. United States
- 3.2. Canada
- 3.3. Rest of North America
NA E-Cigarette Market Segmentation By Geography
- 1. United States
- 2. Canada
- 3. Rest of North America
NA E-Cigarette Market Regional Market Share
Geographic Coverage of NA E-Cigarette Market
NA E-Cigarette Market REPORT HIGHLIGHTS
| Aspects | Details |
|---|---|
| Study Period | 2020-2034 |
| Base Year | 2025 |
| Estimated Year | 2026 |
| Forecast Period | 2026-2034 |
| Historical Period | 2020-2025 |
| Growth Rate | CAGR of 17.60% from 2020-2034 |
| Segmentation |
|
Table of Contents
- 1. Introduction
- 1.1. Research Scope
- 1.2. Market Segmentation
- 1.3. Research Objective
- 1.4. Definitions and Assumptions
- 2. Executive Summary
- 2.1. Market Snapshot
- 3. Market Dynamics
- 3.1. Market Drivers
- 3.2. Market Restrains
- 3.3. Market Trends
- 3.4. Market Opportunities
- 4. Market Factor Analysis
- 4.1. Porters Five Forces
- 4.1.1. Bargaining Power of Suppliers
- 4.1.2. Bargaining Power of Buyers
- 4.1.3. Threat of New Entrants
- 4.1.4. Threat of Substitutes
- 4.1.5. Competitive Rivalry
- 4.2. PESTEL analysis
- 4.3. BCG Analysis
- 4.3.1. Stars (High Growth, High Market Share)
- 4.3.2. Cash Cows (Low Growth, High Market Share)
- 4.3.3. Question Mark (High Growth, Low Market Share)
- 4.3.4. Dogs (Low Growth, Low Market Share)
- 4.4. Ansoff Matrix Analysis
- 4.5. Supply Chain Analysis
- 4.6. Regulatory Landscape
- 4.7. Current Market Potential and Opportunity Assessment (TAM–SAM–SOM Framework)
- 4.8. VDR Analyst Note
- 4.1. Porters Five Forces
- 5. Market Analysis, Insights and Forecast 2021-2033
- 5.1. Market Analysis, Insights and Forecast - by Product
- 5.1.1. Completely Disposable Model
- 5.1.2. Rechargeable but Disposable Cartomizer
- 5.1.3. Personalized Vaporizer
- 5.2. Market Analysis, Insights and Forecast - by Battery Mode
- 5.2.1. Automatic E-Cigarette
- 5.2.2. Manual E-Cigarette
- 5.3. Market Analysis, Insights and Forecast - by Geography
- 5.3.1. United States
- 5.3.2. Canada
- 5.3.3. Rest of North America
- 5.4. Market Analysis, Insights and Forecast - by Region
- 5.4.1. United States
- 5.4.2. Canada
- 5.4.3. Rest of North America
- 5.1. Market Analysis, Insights and Forecast - by Product
- 6. Global NA E-Cigarette Market Analysis, Insights and Forecast, 2021-2033
- 6.1. Market Analysis, Insights and Forecast - by Product
- 6.1.1. Completely Disposable Model
- 6.1.2. Rechargeable but Disposable Cartomizer
- 6.1.3. Personalized Vaporizer
- 6.2. Market Analysis, Insights and Forecast - by Battery Mode
- 6.2.1. Automatic E-Cigarette
- 6.2.2. Manual E-Cigarette
- 6.3. Market Analysis, Insights and Forecast - by Geography
- 6.3.1. United States
- 6.3.2. Canada
- 6.3.3. Rest of North America
- 6.1. Market Analysis, Insights and Forecast - by Product
- 7. United States NA E-Cigarette Market Analysis, Insights and Forecast, 2021-2033
- 7.1. Market Analysis, Insights and Forecast - by Product
- 7.1.1. Completely Disposable Model
- 7.1.2. Rechargeable but Disposable Cartomizer
- 7.1.3. Personalized Vaporizer
- 7.2. Market Analysis, Insights and Forecast - by Battery Mode
- 7.2.1. Automatic E-Cigarette
- 7.2.2. Manual E-Cigarette
- 7.3. Market Analysis, Insights and Forecast - by Geography
- 7.3.1. United States
- 7.3.2. Canada
- 7.3.3. Rest of North America
- 7.1. Market Analysis, Insights and Forecast - by Product
- 8. Canada NA E-Cigarette Market Analysis, Insights and Forecast, 2021-2033
- 8.1. Market Analysis, Insights and Forecast - by Product
- 8.1.1. Completely Disposable Model
- 8.1.2. Rechargeable but Disposable Cartomizer
- 8.1.3. Personalized Vaporizer
- 8.2. Market Analysis, Insights and Forecast - by Battery Mode
- 8.2.1. Automatic E-Cigarette
- 8.2.2. Manual E-Cigarette
- 8.3. Market Analysis, Insights and Forecast - by Geography
- 8.3.1. United States
- 8.3.2. Canada
- 8.3.3. Rest of North America
- 8.1. Market Analysis, Insights and Forecast - by Product
- 9. Rest of North America NA E-Cigarette Market Analysis, Insights and Forecast, 2021-2033
- 9.1. Market Analysis, Insights and Forecast - by Product
- 9.1.1. Completely Disposable Model
- 9.1.2. Rechargeable but Disposable Cartomizer
- 9.1.3. Personalized Vaporizer
- 9.2. Market Analysis, Insights and Forecast - by Battery Mode
- 9.2.1. Automatic E-Cigarette
- 9.2.2. Manual E-Cigarette
- 9.3. Market Analysis, Insights and Forecast - by Geography
- 9.3.1. United States
- 9.3.2. Canada
- 9.3.3. Rest of North America
- 9.1. Market Analysis, Insights and Forecast - by Product
- 10. Competitive Analysis
- 10.1. Company Profiles
- 10.1.1 Japan Tobacco Inc *List Not Exhaustive
- 10.1.1.1. Company Overview
- 10.1.1.2. Products
- 10.1.1.3. Company Financials
- 10.1.1.4. SWOT Analysis
- 10.1.2 British American Tobacco plc
- 10.1.2.1. Company Overview
- 10.1.2.2. Products
- 10.1.2.3. Company Financials
- 10.1.2.4. SWOT Analysis
- 10.1.3 Juul Labs Inc
- 10.1.3.1. Company Overview
- 10.1.3.2. Products
- 10.1.3.3. Company Financials
- 10.1.3.4. SWOT Analysis
- 10.1.4 Altria Group Inc
- 10.1.4.1. Company Overview
- 10.1.4.2. Products
- 10.1.4.3. Company Financials
- 10.1.4.4. SWOT Analysis
- 10.1.5 Imperial Brands plc
- 10.1.5.1. Company Overview
- 10.1.5.2. Products
- 10.1.5.3. Company Financials
- 10.1.5.4. SWOT Analysis
- 10.1.1 Japan Tobacco Inc *List Not Exhaustive
- 10.2. Market Entropy
- 10.2.1 Company's Key Areas Served
- 10.2.2 Recent Developments
- 10.3. Company Market Share Analysis 2025
- 10.3.1 Top 5 Companies Market Share Analysis
- 10.3.2 Top 3 Companies Market Share Analysis
- 10.4. List of Potential Customers
- 11. Research Methodology
List of Figures
- Figure 1: Global NA E-Cigarette Market Revenue Breakdown (Million, %) by Region 2025 & 2033
- Figure 2: Global NA E-Cigarette Market Volume Breakdown (K Units, %) by Region 2025 & 2033
- Figure 3: United States NA E-Cigarette Market Revenue (Million), by Product 2025 & 2033
- Figure 4: United States NA E-Cigarette Market Volume (K Units), by Product 2025 & 2033
- Figure 5: United States NA E-Cigarette Market Revenue Share (%), by Product 2025 & 2033
- Figure 6: United States NA E-Cigarette Market Volume Share (%), by Product 2025 & 2033
- Figure 7: United States NA E-Cigarette Market Revenue (Million), by Battery Mode 2025 & 2033
- Figure 8: United States NA E-Cigarette Market Volume (K Units), by Battery Mode 2025 & 2033
- Figure 9: United States NA E-Cigarette Market Revenue Share (%), by Battery Mode 2025 & 2033
- Figure 10: United States NA E-Cigarette Market Volume Share (%), by Battery Mode 2025 & 2033
- Figure 11: United States NA E-Cigarette Market Revenue (Million), by Geography 2025 & 2033
- Figure 12: United States NA E-Cigarette Market Volume (K Units), by Geography 2025 & 2033
- Figure 13: United States NA E-Cigarette Market Revenue Share (%), by Geography 2025 & 2033
- Figure 14: United States NA E-Cigarette Market Volume Share (%), by Geography 2025 & 2033
- Figure 15: United States NA E-Cigarette Market Revenue (Million), by Country 2025 & 2033
- Figure 16: United States NA E-Cigarette Market Volume (K Units), by Country 2025 & 2033
- Figure 17: United States NA E-Cigarette Market Revenue Share (%), by Country 2025 & 2033
- Figure 18: United States NA E-Cigarette Market Volume Share (%), by Country 2025 & 2033
- Figure 19: Canada NA E-Cigarette Market Revenue (Million), by Product 2025 & 2033
- Figure 20: Canada NA E-Cigarette Market Volume (K Units), by Product 2025 & 2033
- Figure 21: Canada NA E-Cigarette Market Revenue Share (%), by Product 2025 & 2033
- Figure 22: Canada NA E-Cigarette Market Volume Share (%), by Product 2025 & 2033
- Figure 23: Canada NA E-Cigarette Market Revenue (Million), by Battery Mode 2025 & 2033
- Figure 24: Canada NA E-Cigarette Market Volume (K Units), by Battery Mode 2025 & 2033
- Figure 25: Canada NA E-Cigarette Market Revenue Share (%), by Battery Mode 2025 & 2033
- Figure 26: Canada NA E-Cigarette Market Volume Share (%), by Battery Mode 2025 & 2033
- Figure 27: Canada NA E-Cigarette Market Revenue (Million), by Geography 2025 & 2033
- Figure 28: Canada NA E-Cigarette Market Volume (K Units), by Geography 2025 & 2033
- Figure 29: Canada NA E-Cigarette Market Revenue Share (%), by Geography 2025 & 2033
- Figure 30: Canada NA E-Cigarette Market Volume Share (%), by Geography 2025 & 2033
- Figure 31: Canada NA E-Cigarette Market Revenue (Million), by Country 2025 & 2033
- Figure 32: Canada NA E-Cigarette Market Volume (K Units), by Country 2025 & 2033
- Figure 33: Canada NA E-Cigarette Market Revenue Share (%), by Country 2025 & 2033
- Figure 34: Canada NA E-Cigarette Market Volume Share (%), by Country 2025 & 2033
- Figure 35: Rest of North America NA E-Cigarette Market Revenue (Million), by Product 2025 & 2033
- Figure 36: Rest of North America NA E-Cigarette Market Volume (K Units), by Product 2025 & 2033
- Figure 37: Rest of North America NA E-Cigarette Market Revenue Share (%), by Product 2025 & 2033
- Figure 38: Rest of North America NA E-Cigarette Market Volume Share (%), by Product 2025 & 2033
- Figure 39: Rest of North America NA E-Cigarette Market Revenue (Million), by Battery Mode 2025 & 2033
- Figure 40: Rest of North America NA E-Cigarette Market Volume (K Units), by Battery Mode 2025 & 2033
- Figure 41: Rest of North America NA E-Cigarette Market Revenue Share (%), by Battery Mode 2025 & 2033
- Figure 42: Rest of North America NA E-Cigarette Market Volume Share (%), by Battery Mode 2025 & 2033
- Figure 43: Rest of North America NA E-Cigarette Market Revenue (Million), by Geography 2025 & 2033
- Figure 44: Rest of North America NA E-Cigarette Market Volume (K Units), by Geography 2025 & 2033
- Figure 45: Rest of North America NA E-Cigarette Market Revenue Share (%), by Geography 2025 & 2033
- Figure 46: Rest of North America NA E-Cigarette Market Volume Share (%), by Geography 2025 & 2033
- Figure 47: Rest of North America NA E-Cigarette Market Revenue (Million), by Country 2025 & 2033
- Figure 48: Rest of North America NA E-Cigarette Market Volume (K Units), by Country 2025 & 2033
- Figure 49: Rest of North America NA E-Cigarette Market Revenue Share (%), by Country 2025 & 2033
- Figure 50: Rest of North America NA E-Cigarette Market Volume Share (%), by Country 2025 & 2033
List of Tables
- Table 1: Global NA E-Cigarette Market Revenue Million Forecast, by Product 2020 & 2033
- Table 2: Global NA E-Cigarette Market Volume K Units Forecast, by Product 2020 & 2033
- Table 3: Global NA E-Cigarette Market Revenue Million Forecast, by Battery Mode 2020 & 2033
- Table 4: Global NA E-Cigarette Market Volume K Units Forecast, by Battery Mode 2020 & 2033
- Table 5: Global NA E-Cigarette Market Revenue Million Forecast, by Geography 2020 & 2033
- Table 6: Global NA E-Cigarette Market Volume K Units Forecast, by Geography 2020 & 2033
- Table 7: Global NA E-Cigarette Market Revenue Million Forecast, by Region 2020 & 2033
- Table 8: Global NA E-Cigarette Market Volume K Units Forecast, by Region 2020 & 2033
- Table 9: Global NA E-Cigarette Market Revenue Million Forecast, by Product 2020 & 2033
- Table 10: Global NA E-Cigarette Market Volume K Units Forecast, by Product 2020 & 2033
- Table 11: Global NA E-Cigarette Market Revenue Million Forecast, by Battery Mode 2020 & 2033
- Table 12: Global NA E-Cigarette Market Volume K Units Forecast, by Battery Mode 2020 & 2033
- Table 13: Global NA E-Cigarette Market Revenue Million Forecast, by Geography 2020 & 2033
- Table 14: Global NA E-Cigarette Market Volume K Units Forecast, by Geography 2020 & 2033
- Table 15: Global NA E-Cigarette Market Revenue Million Forecast, by Country 2020 & 2033
- Table 16: Global NA E-Cigarette Market Volume K Units Forecast, by Country 2020 & 2033
- Table 17: Global NA E-Cigarette Market Revenue Million Forecast, by Product 2020 & 2033
- Table 18: Global NA E-Cigarette Market Volume K Units Forecast, by Product 2020 & 2033
- Table 19: Global NA E-Cigarette Market Revenue Million Forecast, by Battery Mode 2020 & 2033
- Table 20: Global NA E-Cigarette Market Volume K Units Forecast, by Battery Mode 2020 & 2033
- Table 21: Global NA E-Cigarette Market Revenue Million Forecast, by Geography 2020 & 2033
- Table 22: Global NA E-Cigarette Market Volume K Units Forecast, by Geography 2020 & 2033
- Table 23: Global NA E-Cigarette Market Revenue Million Forecast, by Country 2020 & 2033
- Table 24: Global NA E-Cigarette Market Volume K Units Forecast, by Country 2020 & 2033
- Table 25: Global NA E-Cigarette Market Revenue Million Forecast, by Product 2020 & 2033
- Table 26: Global NA E-Cigarette Market Volume K Units Forecast, by Product 2020 & 2033
- Table 27: Global NA E-Cigarette Market Revenue Million Forecast, by Battery Mode 2020 & 2033
- Table 28: Global NA E-Cigarette Market Volume K Units Forecast, by Battery Mode 2020 & 2033
- Table 29: Global NA E-Cigarette Market Revenue Million Forecast, by Geography 2020 & 2033
- Table 30: Global NA E-Cigarette Market Volume K Units Forecast, by Geography 2020 & 2033
- Table 31: Global NA E-Cigarette Market Revenue Million Forecast, by Country 2020 & 2033
- Table 32: Global NA E-Cigarette Market Volume K Units Forecast, by Country 2020 & 2033
Frequently Asked Questions
1. What is the projected Compound Annual Growth Rate (CAGR) of the NA E-Cigarette Market?
The projected CAGR is approximately 17.60%.
2. Which companies are prominent players in the NA E-Cigarette Market?
Key companies in the market include Japan Tobacco Inc *List Not Exhaustive, British American Tobacco plc, Juul Labs Inc, Altria Group Inc, Imperial Brands plc.
3. What are the main segments of the NA E-Cigarette Market?
The market segments include Product, Battery Mode, Geography.
4. Can you provide details about the market size?
The market size is estimated to be USD XX Million as of 2022.
5. What are some drivers contributing to market growth?
Aggressive Social Media Marketing; Lower-risk Factor Associated with the Use of E-Cigarettes Compared to Conventional/Combustible Cigarettes.
6. What are the notable trends driving market growth?
Rising consumption by the young population.
7. Are there any restraints impacting market growth?
Government Initiatives to Ban Disposable E-Cigarettes.
8. Can you provide examples of recent developments in the market?
N/A
9. What pricing options are available for accessing the report?
Pricing options include single-user, multi-user, and enterprise licenses priced at USD 4750, USD 5250, and USD 8750 respectively.
10. Is the market size provided in terms of value or volume?
The market size is provided in terms of value, measured in Million and volume, measured in K Units.
11. Are there any specific market keywords associated with the report?
Yes, the market keyword associated with the report is "NA E-Cigarette Market," which aids in identifying and referencing the specific market segment covered.
12. How do I determine which pricing option suits my needs best?
The pricing options vary based on user requirements and access needs. Individual users may opt for single-user licenses, while businesses requiring broader access may choose multi-user or enterprise licenses for cost-effective access to the report.
13. Are there any additional resources or data provided in the NA E-Cigarette Market report?
While the report offers comprehensive insights, it's advisable to review the specific contents or supplementary materials provided to ascertain if additional resources or data are available.
14. How can I stay updated on further developments or reports in the NA E-Cigarette Market?
To stay informed about further developments, trends, and reports in the NA E-Cigarette Market, consider subscribing to industry newsletters, following relevant companies and organizations, or regularly checking reputable industry news sources and publications.
Methodology
Step 1 - Identification of Relevant Samples Size from Population Database


Step 2 - Approaches for Defining Global Market Size (Value, Volume* & Price*)

Note*: In applicable scenarios
Step 3 - Data Sources
Primary Research
- Web Analytics
- Survey Reports
- Research Institute
- Latest Research Reports
- Opinion Leaders
Secondary Research
- Annual Reports
- White Paper
- Latest Press Release
- Industry Association
- Paid Database
- Investor Presentations

Step 4 - Data Triangulation
Involves using different sources of information in order to increase the validity of a study
These sources are likely to be stakeholders in a program - participants, other researchers, program staff, other community members, and so on.
Then we put all data in single framework & apply various statistical tools to find out the dynamic on the market.
During the analysis stage, feedback from the stakeholder groups would be compared to determine areas of agreement as well as areas of divergence