

Key Insights
The North American Bio stimulant Market is poised for significant expansion, demonstrating a robust CAGR of 12.1% to reach an estimated USD 0.95 billion in 2025. This growth is primarily fueled by the increasing demand for sustainable agriculture, driven by growing environmental concerns and a consumer push for healthier, residue-free produce. Farmers are actively seeking innovative solutions to enhance crop yield and quality while minimizing the use of synthetic fertilizers and pesticides. Bio stimulants, with their ability to improve nutrient uptake, enhance stress tolerance, and boost overall plant vitality, are emerging as a crucial component in modern farming practices across North America. This trend is further bolstered by supportive government initiatives and research institutions promoting eco-friendly agricultural technologies.
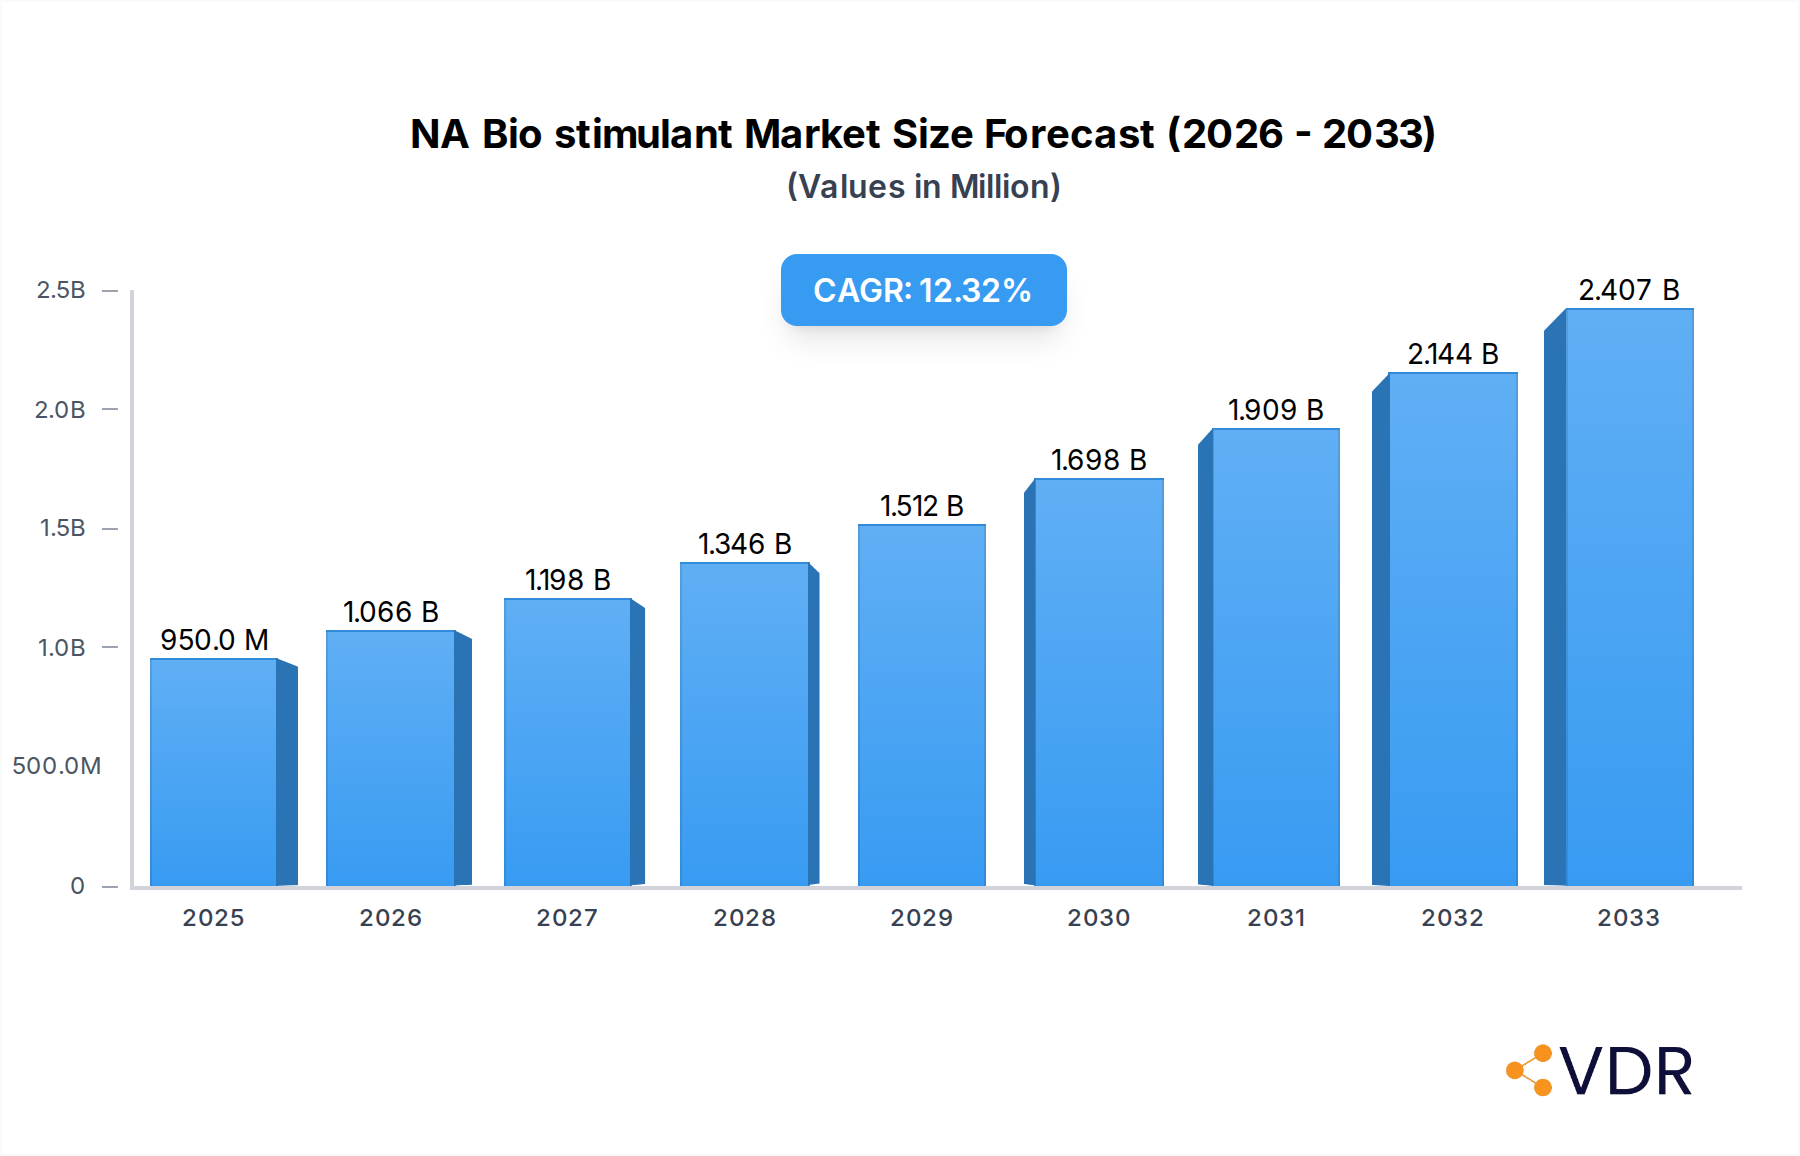
NA Bio stimulant Market Market Size (In Million)
The market's expansion is further accentuated by a diverse range of product forms, including amino acids, fulvic acid, humic acid, protein hydrolysates, and seaweed extracts, catering to a wide spectrum of agricultural needs. These bio stimulants are being adopted across various crop types, from high-value cash and horticultural crops to staple row crops, highlighting their versatility and broad applicability. Key market players are investing in research and development to introduce novel formulations and expand their product portfolios, while strategic collaborations and mergers are shaping the competitive landscape. Emerging trends such as the integration of precision agriculture technologies with bio stimulant application and the development of customized bio stimulant solutions tailored to specific soil and crop conditions are expected to drive future growth, making North America a pivotal region in the global bio stimulant market.

NA Bio stimulant Market Company Market Share
Unlocking Sustainable Agriculture: NA Bio stimulant Market Report 2024-2033
This comprehensive report offers an in-depth analysis of the North American Biostimulant Market, a critical and rapidly expanding sector within the agricultural industry. Driven by a growing demand for sustainable farming practices, enhanced crop yields, and improved soil health, the NA Biostimulant Market is poised for significant growth. This report delves into market dynamics, growth trends, regional dominance, product landscape, key drivers, challenges, opportunities, and the strategic moves of key players. Explore the future of bio-based agricultural solutions and gain valuable insights to inform your business strategy.
NA Bio stimulant Market Market Dynamics & Structure
The NA Biostimulant Market is characterized by a dynamic interplay of technological innovation, evolving regulatory frameworks, and increasing environmental consciousness. Market concentration is moderately fragmented, with a mix of established players and emerging startups vying for market share. Technological innovation is a primary driver, with ongoing research and development focused on enhancing product efficacy, expanding application methods, and developing novel biostimulant formulations. The regulatory landscape, while evolving, generally favors the adoption of biostimulants due to their perceived environmental benefits and reduced reliance on synthetic inputs. Competitive product substitutes include conventional fertilizers and pesticides, but biostimulants offer a distinct advantage in promoting plant health and resilience. End-user demographics are shifting towards a more informed and sustainability-conscious agricultural community, including large-scale commercial farms and smallholder farmers seeking to optimize resource utilization. Mergers and acquisitions (M&A) are increasingly prevalent as larger companies seek to acquire innovative technologies and expand their portfolios. For instance, the acquisition of Plant Response by The Mosaic Company in February 2022 signifies this trend, bolstering its global reach in sustainable solutions.
- Market Concentration: Moderately fragmented with a rising trend of consolidation.
- Technological Innovation Drivers: Focus on enhanced efficacy, new formulations, and sustainable sourcing.
- Regulatory Frameworks: Increasingly favorable due to environmental benefits, though varying by jurisdiction.
- Competitive Product Substitutes: Conventional fertilizers and pesticides, but with distinct sustainability advantages.
- End-User Demographics: Growing adoption among large-scale commercial farms and environmentally conscious smaller operations.
- M&A Trends: Active consolidation to acquire innovative technologies and expand market presence.
NA Bio stimulant Market Growth Trends & Insights
The North American Biostimulant Market is experiencing robust growth, projected to reach an estimated $15.2 billion by 2025, with a Compound Annual Growth Rate (CAGR) of approximately 13.5% during the forecast period of 2025–2033. This expansion is fueled by several interconnected trends. Firstly, the escalating demand for food production to feed a growing global population, coupled with the imperative to adopt sustainable agricultural practices, is a significant catalyst. Farmers are increasingly recognizing the potential of biostimulants to enhance crop yields, improve nutrient uptake efficiency, and bolster plant resistance to abiotic stresses such as drought, salinity, and extreme temperatures, thereby reducing crop losses. The shift away from synthetic fertilizers and pesticides, driven by environmental concerns and stricter regulations, further propels the adoption of bio-based alternatives. Technological advancements in formulation and application technologies are making biostimulants more accessible, cost-effective, and user-friendly. Furthermore, increasing consumer preference for organically grown produce and a heightened awareness of food safety are indirectly driving demand for biostimulants. The market penetration of biostimulants is steadily increasing across various crop types, indicating a growing confidence among growers in their efficacy and economic viability. Consumer behavior shifts are also playing a crucial role, with a greater willingness to invest in solutions that offer long-term soil health benefits and contribute to a more resilient agricultural ecosystem. The integration of biostimulants into integrated pest and nutrient management programs is becoming standard practice, underscoring their evolving role in modern agriculture.
Dominant Regions, Countries, or Segments in NA Bio stimulant Market
The North American Biostimulant Market exhibits significant regional variations in its growth trajectory and adoption rates. Among the key segments, Cash Crops are currently demonstrating dominant growth, driven by their high economic value and the imperative for farmers to maximize yields and quality. This segment encompasses a wide array of crops such as corn, soybeans, wheat, cotton, and fruits, which are extensively cultivated across North America. The demand for enhanced productivity and resilience in these staple crops makes them prime candidates for biostimulant application. Within the forms, Humic Acid and Seaweed Extracts are emerging as leading segments, owing to their well-established efficacy in improving soil structure, enhancing nutrient availability, and promoting robust plant growth. These components are particularly valued for their role in regenerating soil health and mitigating the impacts of intensive agricultural practices.
The United States, with its vast agricultural landmass and a strong emphasis on agricultural innovation and sustainability, stands out as the dominant country driving market growth. Favorable government initiatives supporting sustainable agriculture, coupled with significant investment in research and development by both private companies and research institutions, further cement its leading position. Economic policies aimed at promoting soil health and reducing environmental impact are creating a conducive environment for biostimulant adoption. Additionally, the presence of major agricultural hubs and a high concentration of large-scale commercial farms in states like California, Iowa, and Texas contribute to the substantial market share of the U.S. in the North American biostimulant landscape. The infrastructure supporting agricultural input distribution and extension services also plays a crucial role in facilitating the widespread adoption of these products.
- Dominant Crop Type Segment: Cash Crops (e.g., Corn, Soybeans, Wheat, Fruits)
- Key Drivers: High economic value, imperative for yield maximization and quality improvement, susceptibility to abiotic stresses.
- Market Share Potential: Significant due to extensive cultivation acreage and commodity importance.
- Dominant Form Segment: Humic Acid and Seaweed Extracts
- Key Drivers: Proven efficacy in soil conditioning, nutrient uptake enhancement, and plant growth promotion.
- Growth Potential: Strong due to increasing focus on soil health and sustainable nutrient management.
- Dominant Country: United States
- Key Drivers: Vast agricultural land, strong R&D investment, supportive government initiatives for sustainable agriculture, presence of large commercial farms.
- Economic Impact: Policies promoting soil health and environmental stewardship actively encourage biostimulant use.
- Supporting Factors: Robust agricultural infrastructure, efficient distribution networks, and effective agricultural extension services.
NA Bio stimulant Market Product Landscape
The NA Biostimulant Market is witnessing a surge in innovative product development, focusing on enhancing crop performance and resilience. Product innovations are centered around diverse formulations derived from natural sources, including Amino Acids, Fulvic Acid, Humic Acid, Protein Hydrolysates, and Seaweed Extracts. Companies are leveraging advanced extraction and fermentation technologies to create highly concentrated and effective biostimulants. These products offer multifaceted benefits, such as improved nutrient absorption, enhanced stress tolerance, stimulated root development, and increased photosynthetic efficiency. Applications span across various crop types, including Cash Crops, Horticultural Crops, and Row Crops, demonstrating the versatility and broad applicability of biostimulant technologies. Performance metrics are increasingly being tracked and reported, with a focus on tangible improvements in yield, crop quality, and reduction in the need for synthetic inputs. Unique selling propositions often revolve around the natural origin, environmental compatibility, and ability to promote a more sustainable and resilient agricultural system. Technological advancements are enabling the development of customized solutions tailored to specific crop needs and regional conditions.
Key Drivers, Barriers & Challenges in NA Bio stimulant Market
The NA Biostimulant Market is propelled by several key drivers, primarily the growing global demand for food, coupled with an increasing imperative for sustainable agricultural practices. Technological advancements in biostimulant formulation and application technologies are making these products more effective and accessible. Furthermore, rising consumer awareness regarding the environmental impact of conventional farming and a preference for healthy, sustainably produced food are creating significant market pull. Supportive government policies and initiatives promoting eco-friendly agriculture also act as strong catalysts.
However, the market faces several barriers and challenges. The relatively higher cost of some biostimulants compared to conventional fertilizers can be a deterrent for some farmers. Lack of widespread awareness and education among a segment of the farming community regarding the benefits and proper application of biostimulants also poses a challenge. Regulatory hurdles, though improving, can still create complexities in product registration and market entry. Supply chain disruptions and the need for specific storage and handling conditions for certain biostimulant products can also impact their accessibility. Competitive pressures from established conventional agricultural inputs and the perceived risk associated with adopting novel solutions are additional constraints.
Emerging Opportunities in NA Bio stimulant Market
Emerging opportunities within the NA Biostimulant Market are abundant, driven by evolving agricultural needs and a growing focus on integrated crop management. The development of novel biostimulant formulations targeting specific plant diseases and nutrient deficiencies presents a significant avenue for growth. Furthermore, the untapped potential of biostimulants in arid and semi-arid regions, where water scarcity is a critical issue, offers a substantial market opportunity for products that enhance drought tolerance. The increasing demand for organic and naturally grown produce is creating a niche for specialized biostimulants that align with organic certification standards. Evolving consumer preferences for traceable and sustainably sourced food products are also driving innovation in biostimulant applications that enhance crop quality and resilience. The integration of biostimulants with precision agriculture technologies, such as sensor-based nutrient management, is another promising area, allowing for tailored and efficient application.
Growth Accelerators in the NA Bio stimulant Market Industry
Several factors are accelerating the long-term growth of the NA Biostimulant Market. Breakthroughs in understanding the complex biological mechanisms by which biostimulants influence plant physiology are leading to the development of more potent and targeted products. Strategic partnerships between biostimulant manufacturers and agricultural input distributors are crucial for expanding market reach and ensuring product availability to a wider farming audience. The increasing investment in research and development by both established agricultural companies and innovative startups is fostering a continuous pipeline of novel solutions. Market expansion strategies, including entering new geographical regions and diversifying product portfolios to cater to a broader range of crops and agricultural challenges, are also key growth accelerators. Furthermore, the growing body of scientific evidence demonstrating the economic and environmental benefits of biostimulants is building farmer confidence and driving wider adoption.
Key Players Shaping the NA Bio stimulant Market Market
- Plant Response Biotech Inc
- Koppert Biological Systems Inc
- Sigma Agriscience LLC
- Hello Nature USA Inc
- Actagro LLC
- Humic Growth Solutions Inc
- Agrocare Canada Inc
- Agriculture Solutions Inc
- Agrinos
- Valagro US
Notable Milestones in NA Bio stimulant Market Sector
- February 2022: Plant Response was acquired by The Mosaic Company, a global fertilizer manufacturer. This strategic move significantly strengthened Plant Response's global presence and enabled the development of new, sustainable products and solutions.
- May 2021: Plant Response Inc. announced its acquisition of WISErg, a startup focused on upcycling nutrients from recovered food for use in fertilizer and nutrient-efficient products designed to enhance plant and soil health.
- January 2020: Plant Response Inc. acquired Pathway BioLogic, an applied microbial science company. This acquisition expanded Plant Response's portfolio of biological products, allowing them to offer enhanced value to channel partners and farmers in areas like intrinsic yield improvement, abiotic stress tolerance, increased nutrient use efficiency, and enhanced plant innate immunity.
In-Depth NA Bio stimulant Market Market Outlook
The future outlook for the NA Biostimulant Market is exceptionally promising, driven by a confluence of sustained growth accelerators. The continuous innovation pipeline, fueled by significant investments in research and development, will yield next-generation biostimulants with even greater efficacy and specialized applications. Strategic alliances and partnerships will further solidify market penetration and broaden access to these transformative agricultural inputs. As environmental regulations tighten and consumer demand for sustainable food continues to rise, biostimulants are positioned to become an indispensable component of modern agriculture. The expansion into novel applications, such as enhancing plant resilience in the face of climate change impacts like extreme weather events and soil degradation, represents a significant future market potential. This evolving landscape presents substantial opportunities for stakeholders to capitalize on the growing demand for sustainable and high-performance agricultural solutions.
NA Bio stimulant Market Segmentation
-
1. Form
- 1.1. Amino Acids
- 1.2. Fulvic Acid
- 1.3. Humic Acid
- 1.4. Protein Hydrolysates
- 1.5. Seaweed Extracts
- 1.6. Other Biostimulants
-
2. Crop Type
- 2.1. Cash Crops
- 2.2. Horticultural Crops
- 2.3. Row Crops
-
3. Form
- 3.1. Amino Acids
- 3.2. Fulvic Acid
- 3.3. Humic Acid
- 3.4. Protein Hydrolysates
- 3.5. Seaweed Extracts
- 3.6. Other Biostimulants
-
4. Crop Type
- 4.1. Cash Crops
- 4.2. Horticultural Crops
- 4.3. Row Crops
NA Bio stimulant Market Segmentation By Geography
-
1. North America
- 1.1. United States
- 1.2. Canada
- 1.3. Mexico
-
2. South America
- 2.1. Brazil
- 2.2. Argentina
- 2.3. Rest of South America
-
3. Europe
- 3.1. United Kingdom
- 3.2. Germany
- 3.3. France
- 3.4. Italy
- 3.5. Spain
- 3.6. Russia
- 3.7. Benelux
- 3.8. Nordics
- 3.9. Rest of Europe
-
4. Middle East & Africa
- 4.1. Turkey
- 4.2. Israel
- 4.3. GCC
- 4.4. North Africa
- 4.5. South Africa
- 4.6. Rest of Middle East & Africa
-
5. Asia Pacific
- 5.1. China
- 5.2. India
- 5.3. Japan
- 5.4. South Korea
- 5.5. ASEAN
- 5.6. Oceania
- 5.7. Rest of Asia Pacific
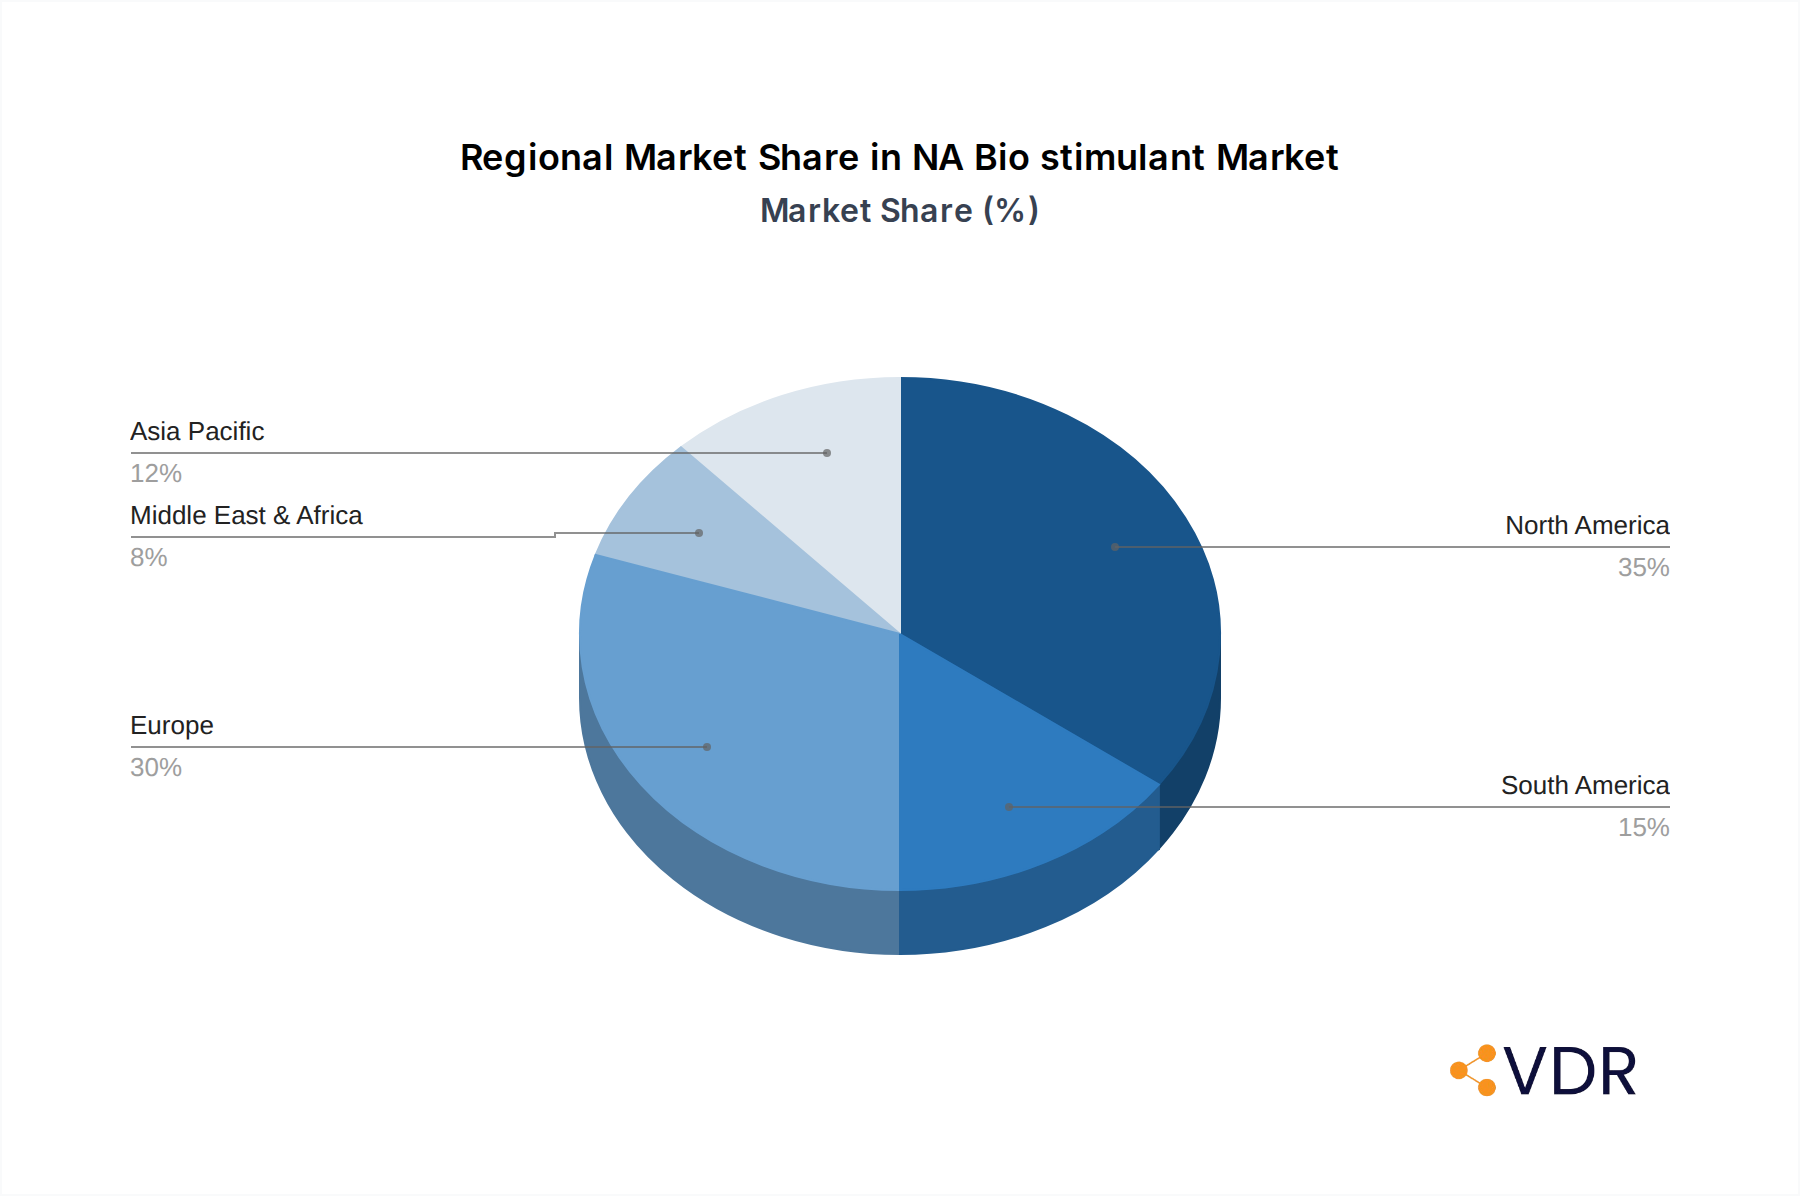
NA Bio stimulant Market Regional Market Share
Geographic Coverage of NA Bio stimulant Market
NA Bio stimulant Market REPORT HIGHLIGHTS
| Aspects | Details |
|---|---|
| Study Period | 2020-2034 |
| Base Year | 2025 |
| Estimated Year | 2026 |
| Forecast Period | 2026-2034 |
| Historical Period | 2020-2025 |
| Growth Rate | CAGR of 11.9% from 2020-2034 |
| Segmentation |
|
Table of Contents
- 1. Introduction
- 1.1. Research Scope
- 1.2. Market Segmentation
- 1.3. Research Objective
- 1.4. Definitions and Assumptions
- 2. Executive Summary
- 2.1. Market Snapshot
- 3. Market Dynamics
- 3.1. Market Drivers
- 3.2. Market Restrains
- 3.3. Market Trends
- 3.4. Market Opportunities
- 4. Market Factor Analysis
- 4.1. Porters Five Forces
- 4.1.1. Bargaining Power of Suppliers
- 4.1.2. Bargaining Power of Buyers
- 4.1.3. Threat of New Entrants
- 4.1.4. Threat of Substitutes
- 4.1.5. Competitive Rivalry
- 4.2. PESTEL analysis
- 4.3. BCG Analysis
- 4.3.1. Stars (High Growth, High Market Share)
- 4.3.2. Cash Cows (Low Growth, High Market Share)
- 4.3.3. Question Mark (High Growth, Low Market Share)
- 4.3.4. Dogs (Low Growth, Low Market Share)
- 4.4. Ansoff Matrix Analysis
- 4.5. Supply Chain Analysis
- 4.6. Regulatory Landscape
- 4.7. Current Market Potential and Opportunity Assessment (TAM–SAM–SOM Framework)
- 4.8. VDR Analyst Note
- 4.1. Porters Five Forces
- 5. Market Analysis, Insights and Forecast 2021-2033
- 5.1. Market Analysis, Insights and Forecast - by Form
- 5.1.1. Amino Acids
- 5.1.2. Fulvic Acid
- 5.1.3. Humic Acid
- 5.1.4. Protein Hydrolysates
- 5.1.5. Seaweed Extracts
- 5.1.6. Other Biostimulants
- 5.2. Market Analysis, Insights and Forecast - by Crop Type
- 5.2.1. Cash Crops
- 5.2.2. Horticultural Crops
- 5.2.3. Row Crops
- 5.3. Market Analysis, Insights and Forecast - by Form
- 5.3.1. Amino Acids
- 5.3.2. Fulvic Acid
- 5.3.3. Humic Acid
- 5.3.4. Protein Hydrolysates
- 5.3.5. Seaweed Extracts
- 5.3.6. Other Biostimulants
- 5.4. Market Analysis, Insights and Forecast - by Crop Type
- 5.4.1. Cash Crops
- 5.4.2. Horticultural Crops
- 5.4.3. Row Crops
- 5.5. Market Analysis, Insights and Forecast - by Region
- 5.5.1. North America
- 5.5.2. South America
- 5.5.3. Europe
- 5.5.4. Middle East & Africa
- 5.5.5. Asia Pacific
- 5.1. Market Analysis, Insights and Forecast - by Form
- 6. Global NA Bio stimulant Market Analysis, Insights and Forecast, 2021-2033
- 6.1. Market Analysis, Insights and Forecast - by Form
- 6.1.1. Amino Acids
- 6.1.2. Fulvic Acid
- 6.1.3. Humic Acid
- 6.1.4. Protein Hydrolysates
- 6.1.5. Seaweed Extracts
- 6.1.6. Other Biostimulants
- 6.2. Market Analysis, Insights and Forecast - by Crop Type
- 6.2.1. Cash Crops
- 6.2.2. Horticultural Crops
- 6.2.3. Row Crops
- 6.3. Market Analysis, Insights and Forecast - by Form
- 6.3.1. Amino Acids
- 6.3.2. Fulvic Acid
- 6.3.3. Humic Acid
- 6.3.4. Protein Hydrolysates
- 6.3.5. Seaweed Extracts
- 6.3.6. Other Biostimulants
- 6.4. Market Analysis, Insights and Forecast - by Crop Type
- 6.4.1. Cash Crops
- 6.4.2. Horticultural Crops
- 6.4.3. Row Crops
- 6.1. Market Analysis, Insights and Forecast - by Form
- 7. North America NA Bio stimulant Market Analysis, Insights and Forecast, 2021-2033
- 7.1. Market Analysis, Insights and Forecast - by Form
- 7.1.1. Amino Acids
- 7.1.2. Fulvic Acid
- 7.1.3. Humic Acid
- 7.1.4. Protein Hydrolysates
- 7.1.5. Seaweed Extracts
- 7.1.6. Other Biostimulants
- 7.2. Market Analysis, Insights and Forecast - by Crop Type
- 7.2.1. Cash Crops
- 7.2.2. Horticultural Crops
- 7.2.3. Row Crops
- 7.3. Market Analysis, Insights and Forecast - by Form
- 7.3.1. Amino Acids
- 7.3.2. Fulvic Acid
- 7.3.3. Humic Acid
- 7.3.4. Protein Hydrolysates
- 7.3.5. Seaweed Extracts
- 7.3.6. Other Biostimulants
- 7.4. Market Analysis, Insights and Forecast - by Crop Type
- 7.4.1. Cash Crops
- 7.4.2. Horticultural Crops
- 7.4.3. Row Crops
- 7.1. Market Analysis, Insights and Forecast - by Form
- 8. South America NA Bio stimulant Market Analysis, Insights and Forecast, 2021-2033
- 8.1. Market Analysis, Insights and Forecast - by Form
- 8.1.1. Amino Acids
- 8.1.2. Fulvic Acid
- 8.1.3. Humic Acid
- 8.1.4. Protein Hydrolysates
- 8.1.5. Seaweed Extracts
- 8.1.6. Other Biostimulants
- 8.2. Market Analysis, Insights and Forecast - by Crop Type
- 8.2.1. Cash Crops
- 8.2.2. Horticultural Crops
- 8.2.3. Row Crops
- 8.3. Market Analysis, Insights and Forecast - by Form
- 8.3.1. Amino Acids
- 8.3.2. Fulvic Acid
- 8.3.3. Humic Acid
- 8.3.4. Protein Hydrolysates
- 8.3.5. Seaweed Extracts
- 8.3.6. Other Biostimulants
- 8.4. Market Analysis, Insights and Forecast - by Crop Type
- 8.4.1. Cash Crops
- 8.4.2. Horticultural Crops
- 8.4.3. Row Crops
- 8.1. Market Analysis, Insights and Forecast - by Form
- 9. Europe NA Bio stimulant Market Analysis, Insights and Forecast, 2021-2033
- 9.1. Market Analysis, Insights and Forecast - by Form
- 9.1.1. Amino Acids
- 9.1.2. Fulvic Acid
- 9.1.3. Humic Acid
- 9.1.4. Protein Hydrolysates
- 9.1.5. Seaweed Extracts
- 9.1.6. Other Biostimulants
- 9.2. Market Analysis, Insights and Forecast - by Crop Type
- 9.2.1. Cash Crops
- 9.2.2. Horticultural Crops
- 9.2.3. Row Crops
- 9.3. Market Analysis, Insights and Forecast - by Form
- 9.3.1. Amino Acids
- 9.3.2. Fulvic Acid
- 9.3.3. Humic Acid
- 9.3.4. Protein Hydrolysates
- 9.3.5. Seaweed Extracts
- 9.3.6. Other Biostimulants
- 9.4. Market Analysis, Insights and Forecast - by Crop Type
- 9.4.1. Cash Crops
- 9.4.2. Horticultural Crops
- 9.4.3. Row Crops
- 9.1. Market Analysis, Insights and Forecast - by Form
- 10. Middle East & Africa NA Bio stimulant Market Analysis, Insights and Forecast, 2021-2033
- 10.1. Market Analysis, Insights and Forecast - by Form
- 10.1.1. Amino Acids
- 10.1.2. Fulvic Acid
- 10.1.3. Humic Acid
- 10.1.4. Protein Hydrolysates
- 10.1.5. Seaweed Extracts
- 10.1.6. Other Biostimulants
- 10.2. Market Analysis, Insights and Forecast - by Crop Type
- 10.2.1. Cash Crops
- 10.2.2. Horticultural Crops
- 10.2.3. Row Crops
- 10.3. Market Analysis, Insights and Forecast - by Form
- 10.3.1. Amino Acids
- 10.3.2. Fulvic Acid
- 10.3.3. Humic Acid
- 10.3.4. Protein Hydrolysates
- 10.3.5. Seaweed Extracts
- 10.3.6. Other Biostimulants
- 10.4. Market Analysis, Insights and Forecast - by Crop Type
- 10.4.1. Cash Crops
- 10.4.2. Horticultural Crops
- 10.4.3. Row Crops
- 10.1. Market Analysis, Insights and Forecast - by Form
- 11. Asia Pacific NA Bio stimulant Market Analysis, Insights and Forecast, 2021-2033
- 11.1. Market Analysis, Insights and Forecast - by Form
- 11.1.1. Amino Acids
- 11.1.2. Fulvic Acid
- 11.1.3. Humic Acid
- 11.1.4. Protein Hydrolysates
- 11.1.5. Seaweed Extracts
- 11.1.6. Other Biostimulants
- 11.2. Market Analysis, Insights and Forecast - by Crop Type
- 11.2.1. Cash Crops
- 11.2.2. Horticultural Crops
- 11.2.3. Row Crops
- 11.3. Market Analysis, Insights and Forecast - by Form
- 11.3.1. Amino Acids
- 11.3.2. Fulvic Acid
- 11.3.3. Humic Acid
- 11.3.4. Protein Hydrolysates
- 11.3.5. Seaweed Extracts
- 11.3.6. Other Biostimulants
- 11.4. Market Analysis, Insights and Forecast - by Crop Type
- 11.4.1. Cash Crops
- 11.4.2. Horticultural Crops
- 11.4.3. Row Crops
- 11.1. Market Analysis, Insights and Forecast - by Form
- 12. Competitive Analysis
- 12.1. Company Profiles
- 12.1.1 Plant Response Biotech Inc
- 12.1.1.1. Company Overview
- 12.1.1.2. Products
- 12.1.1.3. Company Financials
- 12.1.1.4. SWOT Analysis
- 12.1.2 Koppert Biological Systems Inc
- 12.1.2.1. Company Overview
- 12.1.2.2. Products
- 12.1.2.3. Company Financials
- 12.1.2.4. SWOT Analysis
- 12.1.3 Sigma Agriscience LLC
- 12.1.3.1. Company Overview
- 12.1.3.2. Products
- 12.1.3.3. Company Financials
- 12.1.3.4. SWOT Analysis
- 12.1.4 Hello Nature USA Inc
- 12.1.4.1. Company Overview
- 12.1.4.2. Products
- 12.1.4.3. Company Financials
- 12.1.4.4. SWOT Analysis
- 12.1.5 Actagro LLC
- 12.1.5.1. Company Overview
- 12.1.5.2. Products
- 12.1.5.3. Company Financials
- 12.1.5.4. SWOT Analysis
- 12.1.6 Humic Growth Solutions Inc
- 12.1.6.1. Company Overview
- 12.1.6.2. Products
- 12.1.6.3. Company Financials
- 12.1.6.4. SWOT Analysis
- 12.1.7 Agrocare Canada Inc
- 12.1.7.1. Company Overview
- 12.1.7.2. Products
- 12.1.7.3. Company Financials
- 12.1.7.4. SWOT Analysis
- 12.1.8 Agriculture Solutions Inc
- 12.1.8.1. Company Overview
- 12.1.8.2. Products
- 12.1.8.3. Company Financials
- 12.1.8.4. SWOT Analysis
- 12.1.9 Agrinos
- 12.1.9.1. Company Overview
- 12.1.9.2. Products
- 12.1.9.3. Company Financials
- 12.1.9.4. SWOT Analysis
- 12.1.10 Valagro US
- 12.1.10.1. Company Overview
- 12.1.10.2. Products
- 12.1.10.3. Company Financials
- 12.1.10.4. SWOT Analysis
- 12.1.1 Plant Response Biotech Inc
- 12.2. Market Entropy
- 12.2.1 Company's Key Areas Served
- 12.2.2 Recent Developments
- 12.3. Company Market Share Analysis 2025
- 12.3.1 Top 5 Companies Market Share Analysis
- 12.3.2 Top 3 Companies Market Share Analysis
- 12.4. List of Potential Customers
- 13. Research Methodology
List of Figures
- Figure 1: Global NA Bio stimulant Market Revenue Breakdown (billion, %) by Region 2025 & 2033
- Figure 2: North America NA Bio stimulant Market Revenue (billion), by Form 2025 & 2033
- Figure 3: North America NA Bio stimulant Market Revenue Share (%), by Form 2025 & 2033
- Figure 4: North America NA Bio stimulant Market Revenue (billion), by Crop Type 2025 & 2033
- Figure 5: North America NA Bio stimulant Market Revenue Share (%), by Crop Type 2025 & 2033
- Figure 6: North America NA Bio stimulant Market Revenue (billion), by Form 2025 & 2033
- Figure 7: North America NA Bio stimulant Market Revenue Share (%), by Form 2025 & 2033
- Figure 8: North America NA Bio stimulant Market Revenue (billion), by Crop Type 2025 & 2033
- Figure 9: North America NA Bio stimulant Market Revenue Share (%), by Crop Type 2025 & 2033
- Figure 10: North America NA Bio stimulant Market Revenue (billion), by Country 2025 & 2033
- Figure 11: North America NA Bio stimulant Market Revenue Share (%), by Country 2025 & 2033
- Figure 12: South America NA Bio stimulant Market Revenue (billion), by Form 2025 & 2033
- Figure 13: South America NA Bio stimulant Market Revenue Share (%), by Form 2025 & 2033
- Figure 14: South America NA Bio stimulant Market Revenue (billion), by Crop Type 2025 & 2033
- Figure 15: South America NA Bio stimulant Market Revenue Share (%), by Crop Type 2025 & 2033
- Figure 16: South America NA Bio stimulant Market Revenue (billion), by Form 2025 & 2033
- Figure 17: South America NA Bio stimulant Market Revenue Share (%), by Form 2025 & 2033
- Figure 18: South America NA Bio stimulant Market Revenue (billion), by Crop Type 2025 & 2033
- Figure 19: South America NA Bio stimulant Market Revenue Share (%), by Crop Type 2025 & 2033
- Figure 20: South America NA Bio stimulant Market Revenue (billion), by Country 2025 & 2033
- Figure 21: South America NA Bio stimulant Market Revenue Share (%), by Country 2025 & 2033
- Figure 22: Europe NA Bio stimulant Market Revenue (billion), by Form 2025 & 2033
- Figure 23: Europe NA Bio stimulant Market Revenue Share (%), by Form 2025 & 2033
- Figure 24: Europe NA Bio stimulant Market Revenue (billion), by Crop Type 2025 & 2033
- Figure 25: Europe NA Bio stimulant Market Revenue Share (%), by Crop Type 2025 & 2033
- Figure 26: Europe NA Bio stimulant Market Revenue (billion), by Form 2025 & 2033
- Figure 27: Europe NA Bio stimulant Market Revenue Share (%), by Form 2025 & 2033
- Figure 28: Europe NA Bio stimulant Market Revenue (billion), by Crop Type 2025 & 2033
- Figure 29: Europe NA Bio stimulant Market Revenue Share (%), by Crop Type 2025 & 2033
- Figure 30: Europe NA Bio stimulant Market Revenue (billion), by Country 2025 & 2033
- Figure 31: Europe NA Bio stimulant Market Revenue Share (%), by Country 2025 & 2033
- Figure 32: Middle East & Africa NA Bio stimulant Market Revenue (billion), by Form 2025 & 2033
- Figure 33: Middle East & Africa NA Bio stimulant Market Revenue Share (%), by Form 2025 & 2033
- Figure 34: Middle East & Africa NA Bio stimulant Market Revenue (billion), by Crop Type 2025 & 2033
- Figure 35: Middle East & Africa NA Bio stimulant Market Revenue Share (%), by Crop Type 2025 & 2033
- Figure 36: Middle East & Africa NA Bio stimulant Market Revenue (billion), by Form 2025 & 2033
- Figure 37: Middle East & Africa NA Bio stimulant Market Revenue Share (%), by Form 2025 & 2033
- Figure 38: Middle East & Africa NA Bio stimulant Market Revenue (billion), by Crop Type 2025 & 2033
- Figure 39: Middle East & Africa NA Bio stimulant Market Revenue Share (%), by Crop Type 2025 & 2033
- Figure 40: Middle East & Africa NA Bio stimulant Market Revenue (billion), by Country 2025 & 2033
- Figure 41: Middle East & Africa NA Bio stimulant Market Revenue Share (%), by Country 2025 & 2033
- Figure 42: Asia Pacific NA Bio stimulant Market Revenue (billion), by Form 2025 & 2033
- Figure 43: Asia Pacific NA Bio stimulant Market Revenue Share (%), by Form 2025 & 2033
- Figure 44: Asia Pacific NA Bio stimulant Market Revenue (billion), by Crop Type 2025 & 2033
- Figure 45: Asia Pacific NA Bio stimulant Market Revenue Share (%), by Crop Type 2025 & 2033
- Figure 46: Asia Pacific NA Bio stimulant Market Revenue (billion), by Form 2025 & 2033
- Figure 47: Asia Pacific NA Bio stimulant Market Revenue Share (%), by Form 2025 & 2033
- Figure 48: Asia Pacific NA Bio stimulant Market Revenue (billion), by Crop Type 2025 & 2033
- Figure 49: Asia Pacific NA Bio stimulant Market Revenue Share (%), by Crop Type 2025 & 2033
- Figure 50: Asia Pacific NA Bio stimulant Market Revenue (billion), by Country 2025 & 2033
- Figure 51: Asia Pacific NA Bio stimulant Market Revenue Share (%), by Country 2025 & 2033
List of Tables
- Table 1: Global NA Bio stimulant Market Revenue billion Forecast, by Form 2020 & 2033
- Table 2: Global NA Bio stimulant Market Revenue billion Forecast, by Crop Type 2020 & 2033
- Table 3: Global NA Bio stimulant Market Revenue billion Forecast, by Form 2020 & 2033
- Table 4: Global NA Bio stimulant Market Revenue billion Forecast, by Crop Type 2020 & 2033
- Table 5: Global NA Bio stimulant Market Revenue billion Forecast, by Region 2020 & 2033
- Table 6: Global NA Bio stimulant Market Revenue billion Forecast, by Form 2020 & 2033
- Table 7: Global NA Bio stimulant Market Revenue billion Forecast, by Crop Type 2020 & 2033
- Table 8: Global NA Bio stimulant Market Revenue billion Forecast, by Form 2020 & 2033
- Table 9: Global NA Bio stimulant Market Revenue billion Forecast, by Crop Type 2020 & 2033
- Table 10: Global NA Bio stimulant Market Revenue billion Forecast, by Country 2020 & 2033
- Table 11: United States NA Bio stimulant Market Revenue (billion) Forecast, by Application 2020 & 2033
- Table 12: Canada NA Bio stimulant Market Revenue (billion) Forecast, by Application 2020 & 2033
- Table 13: Mexico NA Bio stimulant Market Revenue (billion) Forecast, by Application 2020 & 2033
- Table 14: Global NA Bio stimulant Market Revenue billion Forecast, by Form 2020 & 2033
- Table 15: Global NA Bio stimulant Market Revenue billion Forecast, by Crop Type 2020 & 2033
- Table 16: Global NA Bio stimulant Market Revenue billion Forecast, by Form 2020 & 2033
- Table 17: Global NA Bio stimulant Market Revenue billion Forecast, by Crop Type 2020 & 2033
- Table 18: Global NA Bio stimulant Market Revenue billion Forecast, by Country 2020 & 2033
- Table 19: Brazil NA Bio stimulant Market Revenue (billion) Forecast, by Application 2020 & 2033
- Table 20: Argentina NA Bio stimulant Market Revenue (billion) Forecast, by Application 2020 & 2033
- Table 21: Rest of South America NA Bio stimulant Market Revenue (billion) Forecast, by Application 2020 & 2033
- Table 22: Global NA Bio stimulant Market Revenue billion Forecast, by Form 2020 & 2033
- Table 23: Global NA Bio stimulant Market Revenue billion Forecast, by Crop Type 2020 & 2033
- Table 24: Global NA Bio stimulant Market Revenue billion Forecast, by Form 2020 & 2033
- Table 25: Global NA Bio stimulant Market Revenue billion Forecast, by Crop Type 2020 & 2033
- Table 26: Global NA Bio stimulant Market Revenue billion Forecast, by Country 2020 & 2033
- Table 27: United Kingdom NA Bio stimulant Market Revenue (billion) Forecast, by Application 2020 & 2033
- Table 28: Germany NA Bio stimulant Market Revenue (billion) Forecast, by Application 2020 & 2033
- Table 29: France NA Bio stimulant Market Revenue (billion) Forecast, by Application 2020 & 2033
- Table 30: Italy NA Bio stimulant Market Revenue (billion) Forecast, by Application 2020 & 2033
- Table 31: Spain NA Bio stimulant Market Revenue (billion) Forecast, by Application 2020 & 2033
- Table 32: Russia NA Bio stimulant Market Revenue (billion) Forecast, by Application 2020 & 2033
- Table 33: Benelux NA Bio stimulant Market Revenue (billion) Forecast, by Application 2020 & 2033
- Table 34: Nordics NA Bio stimulant Market Revenue (billion) Forecast, by Application 2020 & 2033
- Table 35: Rest of Europe NA Bio stimulant Market Revenue (billion) Forecast, by Application 2020 & 2033
- Table 36: Global NA Bio stimulant Market Revenue billion Forecast, by Form 2020 & 2033
- Table 37: Global NA Bio stimulant Market Revenue billion Forecast, by Crop Type 2020 & 2033
- Table 38: Global NA Bio stimulant Market Revenue billion Forecast, by Form 2020 & 2033
- Table 39: Global NA Bio stimulant Market Revenue billion Forecast, by Crop Type 2020 & 2033
- Table 40: Global NA Bio stimulant Market Revenue billion Forecast, by Country 2020 & 2033
- Table 41: Turkey NA Bio stimulant Market Revenue (billion) Forecast, by Application 2020 & 2033
- Table 42: Israel NA Bio stimulant Market Revenue (billion) Forecast, by Application 2020 & 2033
- Table 43: GCC NA Bio stimulant Market Revenue (billion) Forecast, by Application 2020 & 2033
- Table 44: North Africa NA Bio stimulant Market Revenue (billion) Forecast, by Application 2020 & 2033
- Table 45: South Africa NA Bio stimulant Market Revenue (billion) Forecast, by Application 2020 & 2033
- Table 46: Rest of Middle East & Africa NA Bio stimulant Market Revenue (billion) Forecast, by Application 2020 & 2033
- Table 47: Global NA Bio stimulant Market Revenue billion Forecast, by Form 2020 & 2033
- Table 48: Global NA Bio stimulant Market Revenue billion Forecast, by Crop Type 2020 & 2033
- Table 49: Global NA Bio stimulant Market Revenue billion Forecast, by Form 2020 & 2033
- Table 50: Global NA Bio stimulant Market Revenue billion Forecast, by Crop Type 2020 & 2033
- Table 51: Global NA Bio stimulant Market Revenue billion Forecast, by Country 2020 & 2033
- Table 52: China NA Bio stimulant Market Revenue (billion) Forecast, by Application 2020 & 2033
- Table 53: India NA Bio stimulant Market Revenue (billion) Forecast, by Application 2020 & 2033
- Table 54: Japan NA Bio stimulant Market Revenue (billion) Forecast, by Application 2020 & 2033
- Table 55: South Korea NA Bio stimulant Market Revenue (billion) Forecast, by Application 2020 & 2033
- Table 56: ASEAN NA Bio stimulant Market Revenue (billion) Forecast, by Application 2020 & 2033
- Table 57: Oceania NA Bio stimulant Market Revenue (billion) Forecast, by Application 2020 & 2033
- Table 58: Rest of Asia Pacific NA Bio stimulant Market Revenue (billion) Forecast, by Application 2020 & 2033
Frequently Asked Questions
1. What is the projected Compound Annual Growth Rate (CAGR) of the NA Bio stimulant Market?
The projected CAGR is approximately 11.9%.
2. Which companies are prominent players in the NA Bio stimulant Market?
Key companies in the market include Plant Response Biotech Inc, Koppert Biological Systems Inc, Sigma Agriscience LLC, Hello Nature USA Inc, Actagro LLC, Humic Growth Solutions Inc, Agrocare Canada Inc, Agriculture Solutions Inc, Agrinos, Valagro US.
3. What are the main segments of the NA Bio stimulant Market?
The market segments include Form, Crop Type, Form, Crop Type.
4. Can you provide details about the market size?
The market size is estimated to be USD 4.46 billion as of 2022.
5. What are some drivers contributing to market growth?
Increasing Demand for Tomato; Adoption of Greenhouse Technology in Tomato Cultivation; Government support.
6. What are the notable trends driving market growth?
OTHER KEY INDUSTRY TRENDS COVERED IN THE REPORT.
7. Are there any restraints impacting market growth?
Increasing Loses due to Physiological Disorder. Pest and Disease; Unfavourable Climatic Condition.
8. Can you provide examples of recent developments in the market?
February 2022: Plant Response was acquired by The Mosaic Company, which is a global fertilizer manufacturer. This acquisition strengthened the company's global presence. Through the acquisition, the company develops new products and solutions for the customers in a sustainable way.May 2021: Plant Response Inc. announced its acquisition of WISErg, which is a startup that upcycles nutrients from recovered food for use in fertilizer and nutrient-efficient products that enhance plant and soil health.January 2020: Plant Response Inc. acquired Pathway BioLogic, an applied microbial science company, to expand its portfolio of biological products offered to the agricultural industry. The acquisition has allowed the company to create value for channel partners and farmers in multiple categories, including intrinsic yield improvement, abiotic stress tolerance, increased nutrient use efficiency, and enhanced plant innate immunity.
9. What pricing options are available for accessing the report?
Pricing options include single-user, multi-user, and enterprise licenses priced at USD 3800, USD 4500, and USD 5800 respectively.
10. Is the market size provided in terms of value or volume?
The market size is provided in terms of value, measured in billion.
11. Are there any specific market keywords associated with the report?
Yes, the market keyword associated with the report is "NA Bio stimulant Market," which aids in identifying and referencing the specific market segment covered.
12. How do I determine which pricing option suits my needs best?
The pricing options vary based on user requirements and access needs. Individual users may opt for single-user licenses, while businesses requiring broader access may choose multi-user or enterprise licenses for cost-effective access to the report.
13. Are there any additional resources or data provided in the NA Bio stimulant Market report?
While the report offers comprehensive insights, it's advisable to review the specific contents or supplementary materials provided to ascertain if additional resources or data are available.
14. How can I stay updated on further developments or reports in the NA Bio stimulant Market?
To stay informed about further developments, trends, and reports in the NA Bio stimulant Market, consider subscribing to industry newsletters, following relevant companies and organizations, or regularly checking reputable industry news sources and publications.
Methodology
Step 1 - Identification of Relevant Samples Size from Population Database


Step 2 - Approaches for Defining Global Market Size (Value, Volume* & Price*)

Note*: In applicable scenarios
Step 3 - Data Sources
Primary Research
- Web Analytics
- Survey Reports
- Research Institute
- Latest Research Reports
- Opinion Leaders
Secondary Research
- Annual Reports
- White Paper
- Latest Press Release
- Industry Association
- Paid Database
- Investor Presentations

Step 4 - Data Triangulation
Involves using different sources of information in order to increase the validity of a study
These sources are likely to be stakeholders in a program - participants, other researchers, program staff, other community members, and so on.
Then we put all data in single framework & apply various statistical tools to find out the dynamic on the market.
During the analysis stage, feedback from the stakeholder groups would be compared to determine areas of agreement as well as areas of divergence