


Key Insights
The global stringed musical instrument market, encompassing guitars, violins, basses, and related instruments, is poised for significant expansion. This growth is propelled by increased engagement in music education, rising discretionary spending on leisure pursuits, and the burgeoning popularity of live musical performances. The market, valued at $13.78 billion in the base year of 2025, is projected to grow at a compound annual growth rate (CAGR) of 3.8% from 2025 to 2033, reaching an estimated $18.6 billion by 2033. Key growth catalysts include the expanding online music education sector, the increasing prominence of independent artists in diverse genres, and the enduring appeal of traditional stringed instruments. While North America and Europe currently lead the market, the Asia-Pacific region is expected to experience substantial growth, driven by a large, youthful population actively participating in music. Market segmentation highlights robust demand for various instrument types, with electric and acoustic guitars holding dominant market shares, followed by violins and basses. The competitive environment features established brands and emerging players, offering a wide range of price points and instrument options.
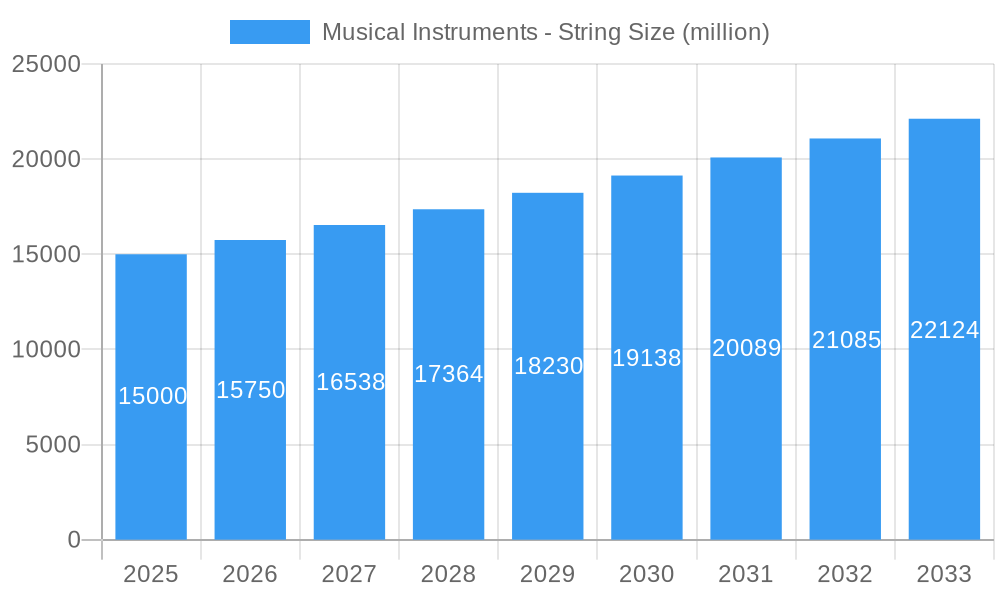
Musical Instruments - String Market Size (In Billion)

The competitive landscape is defined by a blend of established manufacturers with strong brand equity and newer entrants introducing innovative designs and competitive pricing. Market leaders are employing targeted marketing campaigns, strategic partnerships with educational institutions and retailers, and continuous product innovation. A notable trend is the increasing demand for customization and personalization, catering to individual consumer preferences. The widespread adoption of e-commerce channels is reshaping distribution and creating new avenues for brands. Sustained market growth will hinge on effective supply chain management, adaptability to evolving consumer demands, and the strategic utilization of technology to enhance customer engagement.
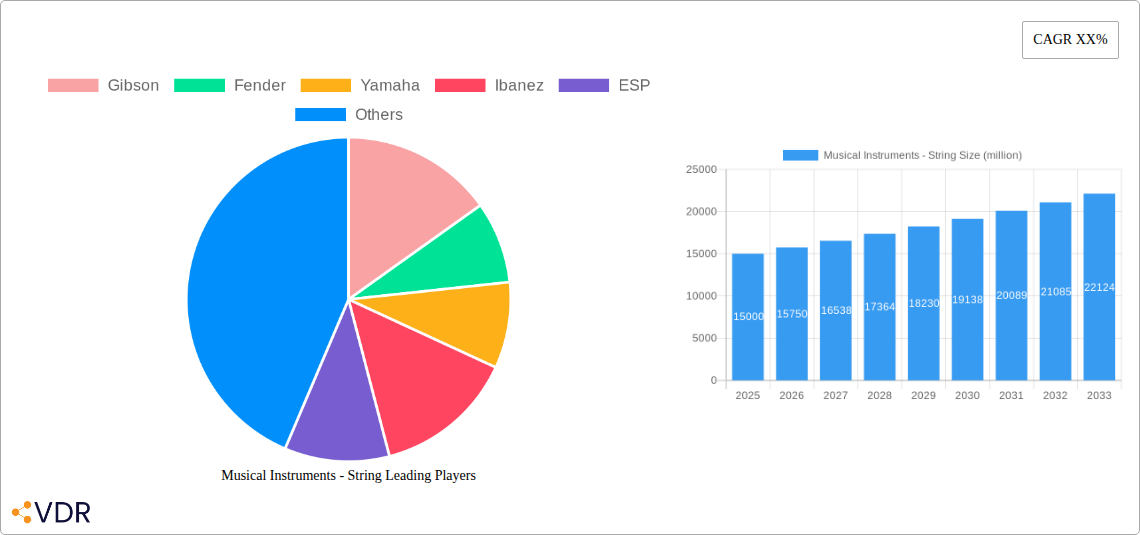
Musical Instruments - String Company Market Share
Musical Instruments - String Market Report: 2019-2033
This comprehensive report provides a detailed analysis of the global musical instruments – string market, encompassing both the parent market (musical instruments) and the child market (string instruments). The study covers the period 2019-2033, with a focus on the forecast period 2025-2033, using 2025 as the base year and estimated year. The report leverages extensive data analysis and industry insights to offer a complete understanding of market dynamics, growth trends, and future opportunities. The market size is presented in million units.
Musical Instruments - String Market Dynamics & Structure
This section analyzes the competitive landscape, technological advancements, regulatory influences, and market trends within the string instrument industry. The market is characterized by a mix of established players and emerging brands, with varying degrees of market concentration across different string instrument segments (e.g., guitars, violins, basses). Technological innovation, particularly in materials science and digital integration, is a significant driver, although high initial investment costs can serve as a barrier for smaller players. Regulatory frameworks concerning material sourcing and manufacturing processes also influence market dynamics. Substitute products, such as digital synthesizers and virtual instruments, pose a competitive challenge. The end-user demographics are diverse, ranging from professional musicians to hobbyists and students, influencing product design and marketing strategies. Mergers and acquisitions (M&A) activity has been moderate, primarily focused on consolidating market share and expanding product portfolios.
- Market Concentration: Moderately concentrated, with a few major players holding significant market share but numerous smaller niche players also contributing. Gibson, Fender, and Yamaha collectively hold approximately xx% of the market share in 2025 (estimated).
- Technological Innovation: Focus on improved materials (e.g., carbon fiber), advanced electronics (e.g., modeling pickups), and digital integration (e.g., app connectivity).
- Regulatory Frameworks: Compliance with environmental regulations related to wood sourcing and manufacturing processes.
- Competitive Product Substitutes: Digital audio workstations (DAWs) and virtual instruments.
- End-User Demographics: Professional musicians, hobbyists, students, varying by instrument type (e.g., acoustic vs. electric guitars).
- M&A Trends: Moderate activity, with larger companies acquiring smaller brands to broaden their product lines. XX M&A deals recorded between 2019 and 2024.
Musical Instruments - String Growth Trends & Insights
The global string instrument market experienced a steady growth trajectory between 2019 and 2024, driven by increasing participation in music education and rising consumer disposable incomes, particularly in developing economies. The adoption rate for string instruments, while fluctuating across different segments, has shown a positive trend. Technological disruptions, such as the integration of digital technology into acoustic instruments, have created new market opportunities and expanded the consumer base. However, shifts in consumer preferences towards digital music consumption have also posed a challenge to the traditional string instrument market.
- Market Size Evolution: The market size grew from xx million units in 2019 to xx million units in 2024, with a projected xx million units by 2033.
- CAGR (2019-2024): xx%
- Market Penetration: xx% in 2024, projected to reach xx% by 2033.
- Technological Disruptions: Introduction of hybrid instruments combining acoustic and digital components.
- Consumer Behavior Shifts: Growing interest in online music learning platforms and virtual collaborations.
Dominant Regions, Countries, or Segments in Musical Instruments - String
North America and Europe remain dominant regions in the string instrument market, driven by established music industries, strong consumer spending power, and well-developed distribution networks. Within these regions, specific countries such as the United States, Germany, and the United Kingdom showcase significant market shares. However, rapidly growing economies in Asia, particularly China and India, are emerging as significant contributors, boosted by rising music education programs and increased disposable incomes. The electric guitar segment consistently leads market growth, benefiting from its versatility and widespread popularity across various music genres.
- Key Drivers:
- North America & Europe: Established music infrastructure, high disposable incomes, strong consumer interest in live music.
- Asia: Rapid economic growth, increasing music education initiatives, rising middle class.
- Dominant Segments: Electric guitars, acoustic guitars, violins, basses.
- Market Share: North America holds approximately xx% of the global market in 2025 (estimated), followed by Europe at xx%. Asia is projected to experience the highest growth rate over the forecast period.
Musical Instruments - String Product Landscape
The string instrument market showcases diverse product offerings, encompassing acoustic and electric guitars, violins, violas, cellos, basses, and various other specialized instruments. Recent product innovations focus on material advancements, such as carbon fiber for enhanced durability and lighter weight, and technological integrations like built-in digital effects processors and wireless connectivity. These innovations enhance instrument performance, expand their applications, and cater to the diverse preferences of musicians. Unique selling propositions often involve superior craftsmanship, innovative designs, and specialized features catered to specific musical genres.
Key Drivers, Barriers & Challenges in Musical Instruments - String
Key Drivers:
- Increasing music education participation globally.
- Growing popularity of live music and music festivals.
- Technological advancements enhancing instrument performance and accessibility.
- Rise of online music learning platforms.
Challenges & Restraints:
- Competition from digital music and virtual instruments.
- Fluctuations in raw material costs (e.g., wood).
- Supply chain disruptions and global logistics challenges.
- Economic downturns impacting consumer spending.
Emerging Opportunities in Musical Instruments - String
- Untapped Markets: Expansion into developing economies with rising middle classes and growing interest in music education.
- Innovative Applications: Development of hybrid acoustic-digital instruments and integration with music technology.
- Evolving Consumer Preferences: Customization options, environmentally friendly materials, and unique instrument designs.
Growth Accelerators in the Musical Instruments - String Industry
Strategic partnerships between instrument manufacturers and technology companies are driving innovation and expanding market reach. Furthermore, the growing popularity of online music education platforms fuels demand for beginner-level instruments. Market expansion strategies targeting underserved demographics and new geographical areas contribute to the industry's growth trajectory. Technological breakthroughs in materials science and instrument design continuously create new possibilities for innovation and customer appeal.
Key Players Shaping the Musical Instruments - String Market
Notable Milestones in Musical Instruments - String Sector
- 2020: Launch of a new line of carbon fiber guitars by a major manufacturer.
- 2021: Acquisition of a smaller string instrument brand by a larger competitor.
- 2022: Introduction of a new digital interface for acoustic guitars.
- 2023: Significant investment in research and development for sustainable materials in string instrument manufacturing.
- 2024: Release of a new line of affordable string instruments targeting beginner musicians.
In-Depth Musical Instruments - String Market Outlook
The global string instrument market is poised for continued growth over the next decade, driven by technological innovations, expansion into emerging markets, and ongoing interest in music education. Strategic partnerships, investments in research and development, and a focus on sustainable manufacturing practices will further enhance market dynamics. The integration of digital technologies and the ongoing development of hybrid instruments present exciting opportunities for growth and innovation. The market presents lucrative opportunities for established players and new entrants alike, with a focus on catering to diverse consumer preferences and emerging trends.
Musical Instruments - String Segmentation
-
1. Application
- 1.1. Professional Performance
- 1.2. Learning and Training
- 1.3. Individual Amateurs
-
2. Types
- 2.1. Guitar
- 2.2. Violins
- 2.3. Others
Musical Instruments - String Segmentation By Geography
-
1. North America
- 1.1. United States
- 1.2. Canada
- 1.3. Mexico
-
2. South America
- 2.1. Brazil
- 2.2. Argentina
- 2.3. Rest of South America
-
3. Europe
- 3.1. United Kingdom
- 3.2. Germany
- 3.3. France
- 3.4. Italy
- 3.5. Spain
- 3.6. Russia
- 3.7. Benelux
- 3.8. Nordics
- 3.9. Rest of Europe
-
4. Middle East & Africa
- 4.1. Turkey
- 4.2. Israel
- 4.3. GCC
- 4.4. North Africa
- 4.5. South Africa
- 4.6. Rest of Middle East & Africa
-
5. Asia Pacific
- 5.1. China
- 5.2. India
- 5.3. Japan
- 5.4. South Korea
- 5.5. ASEAN
- 5.6. Oceania
- 5.7. Rest of Asia Pacific

Musical Instruments - String Regional Market Share
Geographic Coverage of Musical Instruments - String
Musical Instruments - String REPORT HIGHLIGHTS
| Aspects | Details |
|---|---|
| Study Period | 2020-2034 |
| Base Year | 2025 |
| Estimated Year | 2026 |
| Forecast Period | 2026-2034 |
| Historical Period | 2020-2025 |
| Growth Rate | CAGR of 3.8% from 2020-2034 |
| Segmentation |
|
Table of Contents
- 1. Introduction
- 1.1. Research Scope
- 1.2. Market Segmentation
- 1.3. Research Methodology
- 1.4. Definitions and Assumptions
- 2. Executive Summary
- 2.1. Introduction
- 3. Market Dynamics
- 3.1. Introduction
- 3.2. Market Drivers
- 3.3. Market Restrains
- 3.4. Market Trends
- 4. Market Factor Analysis
- 4.1. Porters Five Forces
- 4.2. Supply/Value Chain
- 4.3. PESTEL analysis
- 4.4. Market Entropy
- 4.5. Patent/Trademark Analysis
- 5. Global Musical Instruments - String Analysis, Insights and Forecast, 2020-2032
- 5.1. Market Analysis, Insights and Forecast - by Application
- 5.1.1. Professional Performance
- 5.1.2. Learning and Training
- 5.1.3. Individual Amateurs
- 5.2. Market Analysis, Insights and Forecast - by Types
- 5.2.1. Guitar
- 5.2.2. Violins
- 5.2.3. Others
- 5.3. Market Analysis, Insights and Forecast - by Region
- 5.3.1. North America
- 5.3.2. South America
- 5.3.3. Europe
- 5.3.4. Middle East & Africa
- 5.3.5. Asia Pacific
- 5.1. Market Analysis, Insights and Forecast - by Application
- 6. North America Musical Instruments - String Analysis, Insights and Forecast, 2020-2032
- 6.1. Market Analysis, Insights and Forecast - by Application
- 6.1.1. Professional Performance
- 6.1.2. Learning and Training
- 6.1.3. Individual Amateurs
- 6.2. Market Analysis, Insights and Forecast - by Types
- 6.2.1. Guitar
- 6.2.2. Violins
- 6.2.3. Others
- 6.1. Market Analysis, Insights and Forecast - by Application
- 7. South America Musical Instruments - String Analysis, Insights and Forecast, 2020-2032
- 7.1. Market Analysis, Insights and Forecast - by Application
- 7.1.1. Professional Performance
- 7.1.2. Learning and Training
- 7.1.3. Individual Amateurs
- 7.2. Market Analysis, Insights and Forecast - by Types
- 7.2.1. Guitar
- 7.2.2. Violins
- 7.2.3. Others
- 7.1. Market Analysis, Insights and Forecast - by Application
- 8. Europe Musical Instruments - String Analysis, Insights and Forecast, 2020-2032
- 8.1. Market Analysis, Insights and Forecast - by Application
- 8.1.1. Professional Performance
- 8.1.2. Learning and Training
- 8.1.3. Individual Amateurs
- 8.2. Market Analysis, Insights and Forecast - by Types
- 8.2.1. Guitar
- 8.2.2. Violins
- 8.2.3. Others
- 8.1. Market Analysis, Insights and Forecast - by Application
- 9. Middle East & Africa Musical Instruments - String Analysis, Insights and Forecast, 2020-2032
- 9.1. Market Analysis, Insights and Forecast - by Application
- 9.1.1. Professional Performance
- 9.1.2. Learning and Training
- 9.1.3. Individual Amateurs
- 9.2. Market Analysis, Insights and Forecast - by Types
- 9.2.1. Guitar
- 9.2.2. Violins
- 9.2.3. Others
- 9.1. Market Analysis, Insights and Forecast - by Application
- 10. Asia Pacific Musical Instruments - String Analysis, Insights and Forecast, 2020-2032
- 10.1. Market Analysis, Insights and Forecast - by Application
- 10.1.1. Professional Performance
- 10.1.2. Learning and Training
- 10.1.3. Individual Amateurs
- 10.2. Market Analysis, Insights and Forecast - by Types
- 10.2.1. Guitar
- 10.2.2. Violins
- 10.2.3. Others
- 10.1. Market Analysis, Insights and Forecast - by Application
- 11. Competitive Analysis
- 11.1. Global Market Share Analysis 2025
- 11.2. Company Profiles
- 11.2.1 Gibson
- 11.2.1.1. Overview
- 11.2.1.2. Products
- 11.2.1.3. SWOT Analysis
- 11.2.1.4. Recent Developments
- 11.2.1.5. Financials (Based on Availability)
- 11.2.2 Fender
- 11.2.2.1. Overview
- 11.2.2.2. Products
- 11.2.2.3. SWOT Analysis
- 11.2.2.4. Recent Developments
- 11.2.2.5. Financials (Based on Availability)
- 11.2.3 Yamaha
- 11.2.3.1. Overview
- 11.2.3.2. Products
- 11.2.3.3. SWOT Analysis
- 11.2.3.4. Recent Developments
- 11.2.3.5. Financials (Based on Availability)
- 11.2.4 Ibanez
- 11.2.4.1. Overview
- 11.2.4.2. Products
- 11.2.4.3. SWOT Analysis
- 11.2.4.4. Recent Developments
- 11.2.4.5. Financials (Based on Availability)
- 11.2.5 ESP
- 11.2.5.1. Overview
- 11.2.5.2. Products
- 11.2.5.3. SWOT Analysis
- 11.2.5.4. Recent Developments
- 11.2.5.5. Financials (Based on Availability)
- 11.2.6 CORT
- 11.2.6.1. Overview
- 11.2.6.2. Products
- 11.2.6.3. SWOT Analysis
- 11.2.6.4. Recent Developments
- 11.2.6.5. Financials (Based on Availability)
- 11.2.7 Epiphone
- 11.2.7.1. Overview
- 11.2.7.2. Products
- 11.2.7.3. SWOT Analysis
- 11.2.7.4. Recent Developments
- 11.2.7.5. Financials (Based on Availability)
- 11.2.8 Squier
- 11.2.8.1. Overview
- 11.2.8.2. Products
- 11.2.8.3. SWOT Analysis
- 11.2.8.4. Recent Developments
- 11.2.8.5. Financials (Based on Availability)
- 11.2.9 PRS
- 11.2.9.1. Overview
- 11.2.9.2. Products
- 11.2.9.3. SWOT Analysis
- 11.2.9.4. Recent Developments
- 11.2.9.5. Financials (Based on Availability)
- 11.2.10 SCHECTER
- 11.2.10.1. Overview
- 11.2.10.2. Products
- 11.2.10.3. SWOT Analysis
- 11.2.10.4. Recent Developments
- 11.2.10.5. Financials (Based on Availability)
- 11.2.11 Jackson
- 11.2.11.1. Overview
- 11.2.11.2. Products
- 11.2.11.3. SWOT Analysis
- 11.2.11.4. Recent Developments
- 11.2.11.5. Financials (Based on Availability)
- 11.2.12 Peavey
- 11.2.12.1. Overview
- 11.2.12.2. Products
- 11.2.12.3. SWOT Analysis
- 11.2.12.4. Recent Developments
- 11.2.12.5. Financials (Based on Availability)
- 11.2.13 Washburn
- 11.2.13.1. Overview
- 11.2.13.2. Products
- 11.2.13.3. SWOT Analysis
- 11.2.13.4. Recent Developments
- 11.2.13.5. Financials (Based on Availability)
- 11.2.14 Taylor
- 11.2.14.1. Overview
- 11.2.14.2. Products
- 11.2.14.3. SWOT Analysis
- 11.2.14.4. Recent Developments
- 11.2.14.5. Financials (Based on Availability)
- 11.2.15 Farida
- 11.2.15.1. Overview
- 11.2.15.2. Products
- 11.2.15.3. SWOT Analysis
- 11.2.15.4. Recent Developments
- 11.2.15.5. Financials (Based on Availability)
- 11.2.16 Karl Höfner
- 11.2.16.1. Overview
- 11.2.16.2. Products
- 11.2.16.3. SWOT Analysis
- 11.2.16.4. Recent Developments
- 11.2.16.5. Financials (Based on Availability)
- 11.2.17 FranzSandner
- 11.2.17.1. Overview
- 11.2.17.2. Products
- 11.2.17.3. SWOT Analysis
- 11.2.17.4. Recent Developments
- 11.2.17.5. Financials (Based on Availability)
- 11.2.18 Stentor
- 11.2.18.1. Overview
- 11.2.18.2. Products
- 11.2.18.3. SWOT Analysis
- 11.2.18.4. Recent Developments
- 11.2.18.5. Financials (Based on Availability)
- 11.2.19 FengLegend
- 11.2.19.1. Overview
- 11.2.19.2. Products
- 11.2.19.3. SWOT Analysis
- 11.2.19.4. Recent Developments
- 11.2.19.5. Financials (Based on Availability)
- 11.2.20 KAPOK
- 11.2.20.1. Overview
- 11.2.20.2. Products
- 11.2.20.3. SWOT Analysis
- 11.2.20.4. Recent Developments
- 11.2.20.5. Financials (Based on Availability)
- 11.2.21 GCV-Violins
- 11.2.21.1. Overview
- 11.2.21.2. Products
- 11.2.21.3. SWOT Analysis
- 11.2.21.4. Recent Developments
- 11.2.21.5. Financials (Based on Availability)
- 11.2.22 JinYin Musical
- 11.2.22.1. Overview
- 11.2.22.2. Products
- 11.2.22.3. SWOT Analysis
- 11.2.22.4. Recent Developments
- 11.2.22.5. Financials (Based on Availability)
- 11.2.23 Bellafina
- 11.2.23.1. Overview
- 11.2.23.2. Products
- 11.2.23.3. SWOT Analysis
- 11.2.23.4. Recent Developments
- 11.2.23.5. Financials (Based on Availability)
- 11.2.24 NS Design
- 11.2.24.1. Overview
- 11.2.24.2. Products
- 11.2.24.3. SWOT Analysis
- 11.2.24.4. Recent Developments
- 11.2.24.5. Financials (Based on Availability)
- 11.2.25 Barcus Berry
- 11.2.25.1. Overview
- 11.2.25.2. Products
- 11.2.25.3. SWOT Analysis
- 11.2.25.4. Recent Developments
- 11.2.25.5. Financials (Based on Availability)
- 11.2.26 Hofner
- 11.2.26.1. Overview
- 11.2.26.2. Products
- 11.2.26.3. SWOT Analysis
- 11.2.26.4. Recent Developments
- 11.2.26.5. Financials (Based on Availability)
- 11.2.27 Beijing Forest Violins
- 11.2.27.1. Overview
- 11.2.27.2. Products
- 11.2.27.3. SWOT Analysis
- 11.2.27.4. Recent Developments
- 11.2.27.5. Financials (Based on Availability)
- 11.2.1 Gibson
List of Figures
- Figure 1: Global Musical Instruments - String Revenue Breakdown (billion, %) by Region 2025 & 2033
- Figure 2: Global Musical Instruments - String Volume Breakdown (K, %) by Region 2025 & 2033
- Figure 3: North America Musical Instruments - String Revenue (billion), by Application 2025 & 2033
- Figure 4: North America Musical Instruments - String Volume (K), by Application 2025 & 2033
- Figure 5: North America Musical Instruments - String Revenue Share (%), by Application 2025 & 2033
- Figure 6: North America Musical Instruments - String Volume Share (%), by Application 2025 & 2033
- Figure 7: North America Musical Instruments - String Revenue (billion), by Types 2025 & 2033
- Figure 8: North America Musical Instruments - String Volume (K), by Types 2025 & 2033
- Figure 9: North America Musical Instruments - String Revenue Share (%), by Types 2025 & 2033
- Figure 10: North America Musical Instruments - String Volume Share (%), by Types 2025 & 2033
- Figure 11: North America Musical Instruments - String Revenue (billion), by Country 2025 & 2033
- Figure 12: North America Musical Instruments - String Volume (K), by Country 2025 & 2033
- Figure 13: North America Musical Instruments - String Revenue Share (%), by Country 2025 & 2033
- Figure 14: North America Musical Instruments - String Volume Share (%), by Country 2025 & 2033
- Figure 15: South America Musical Instruments - String Revenue (billion), by Application 2025 & 2033
- Figure 16: South America Musical Instruments - String Volume (K), by Application 2025 & 2033
- Figure 17: South America Musical Instruments - String Revenue Share (%), by Application 2025 & 2033
- Figure 18: South America Musical Instruments - String Volume Share (%), by Application 2025 & 2033
- Figure 19: South America Musical Instruments - String Revenue (billion), by Types 2025 & 2033
- Figure 20: South America Musical Instruments - String Volume (K), by Types 2025 & 2033
- Figure 21: South America Musical Instruments - String Revenue Share (%), by Types 2025 & 2033
- Figure 22: South America Musical Instruments - String Volume Share (%), by Types 2025 & 2033
- Figure 23: South America Musical Instruments - String Revenue (billion), by Country 2025 & 2033
- Figure 24: South America Musical Instruments - String Volume (K), by Country 2025 & 2033
- Figure 25: South America Musical Instruments - String Revenue Share (%), by Country 2025 & 2033
- Figure 26: South America Musical Instruments - String Volume Share (%), by Country 2025 & 2033
- Figure 27: Europe Musical Instruments - String Revenue (billion), by Application 2025 & 2033
- Figure 28: Europe Musical Instruments - String Volume (K), by Application 2025 & 2033
- Figure 29: Europe Musical Instruments - String Revenue Share (%), by Application 2025 & 2033
- Figure 30: Europe Musical Instruments - String Volume Share (%), by Application 2025 & 2033
- Figure 31: Europe Musical Instruments - String Revenue (billion), by Types 2025 & 2033
- Figure 32: Europe Musical Instruments - String Volume (K), by Types 2025 & 2033
- Figure 33: Europe Musical Instruments - String Revenue Share (%), by Types 2025 & 2033
- Figure 34: Europe Musical Instruments - String Volume Share (%), by Types 2025 & 2033
- Figure 35: Europe Musical Instruments - String Revenue (billion), by Country 2025 & 2033
- Figure 36: Europe Musical Instruments - String Volume (K), by Country 2025 & 2033
- Figure 37: Europe Musical Instruments - String Revenue Share (%), by Country 2025 & 2033
- Figure 38: Europe Musical Instruments - String Volume Share (%), by Country 2025 & 2033
- Figure 39: Middle East & Africa Musical Instruments - String Revenue (billion), by Application 2025 & 2033
- Figure 40: Middle East & Africa Musical Instruments - String Volume (K), by Application 2025 & 2033
- Figure 41: Middle East & Africa Musical Instruments - String Revenue Share (%), by Application 2025 & 2033
- Figure 42: Middle East & Africa Musical Instruments - String Volume Share (%), by Application 2025 & 2033
- Figure 43: Middle East & Africa Musical Instruments - String Revenue (billion), by Types 2025 & 2033
- Figure 44: Middle East & Africa Musical Instruments - String Volume (K), by Types 2025 & 2033
- Figure 45: Middle East & Africa Musical Instruments - String Revenue Share (%), by Types 2025 & 2033
- Figure 46: Middle East & Africa Musical Instruments - String Volume Share (%), by Types 2025 & 2033
- Figure 47: Middle East & Africa Musical Instruments - String Revenue (billion), by Country 2025 & 2033
- Figure 48: Middle East & Africa Musical Instruments - String Volume (K), by Country 2025 & 2033
- Figure 49: Middle East & Africa Musical Instruments - String Revenue Share (%), by Country 2025 & 2033
- Figure 50: Middle East & Africa Musical Instruments - String Volume Share (%), by Country 2025 & 2033
- Figure 51: Asia Pacific Musical Instruments - String Revenue (billion), by Application 2025 & 2033
- Figure 52: Asia Pacific Musical Instruments - String Volume (K), by Application 2025 & 2033
- Figure 53: Asia Pacific Musical Instruments - String Revenue Share (%), by Application 2025 & 2033
- Figure 54: Asia Pacific Musical Instruments - String Volume Share (%), by Application 2025 & 2033
- Figure 55: Asia Pacific Musical Instruments - String Revenue (billion), by Types 2025 & 2033
- Figure 56: Asia Pacific Musical Instruments - String Volume (K), by Types 2025 & 2033
- Figure 57: Asia Pacific Musical Instruments - String Revenue Share (%), by Types 2025 & 2033
- Figure 58: Asia Pacific Musical Instruments - String Volume Share (%), by Types 2025 & 2033
- Figure 59: Asia Pacific Musical Instruments - String Revenue (billion), by Country 2025 & 2033
- Figure 60: Asia Pacific Musical Instruments - String Volume (K), by Country 2025 & 2033
- Figure 61: Asia Pacific Musical Instruments - String Revenue Share (%), by Country 2025 & 2033
- Figure 62: Asia Pacific Musical Instruments - String Volume Share (%), by Country 2025 & 2033
List of Tables
- Table 1: Global Musical Instruments - String Revenue billion Forecast, by Application 2020 & 2033
- Table 2: Global Musical Instruments - String Volume K Forecast, by Application 2020 & 2033
- Table 3: Global Musical Instruments - String Revenue billion Forecast, by Types 2020 & 2033
- Table 4: Global Musical Instruments - String Volume K Forecast, by Types 2020 & 2033
- Table 5: Global Musical Instruments - String Revenue billion Forecast, by Region 2020 & 2033
- Table 6: Global Musical Instruments - String Volume K Forecast, by Region 2020 & 2033
- Table 7: Global Musical Instruments - String Revenue billion Forecast, by Application 2020 & 2033
- Table 8: Global Musical Instruments - String Volume K Forecast, by Application 2020 & 2033
- Table 9: Global Musical Instruments - String Revenue billion Forecast, by Types 2020 & 2033
- Table 10: Global Musical Instruments - String Volume K Forecast, by Types 2020 & 2033
- Table 11: Global Musical Instruments - String Revenue billion Forecast, by Country 2020 & 2033
- Table 12: Global Musical Instruments - String Volume K Forecast, by Country 2020 & 2033
- Table 13: United States Musical Instruments - String Revenue (billion) Forecast, by Application 2020 & 2033
- Table 14: United States Musical Instruments - String Volume (K) Forecast, by Application 2020 & 2033
- Table 15: Canada Musical Instruments - String Revenue (billion) Forecast, by Application 2020 & 2033
- Table 16: Canada Musical Instruments - String Volume (K) Forecast, by Application 2020 & 2033
- Table 17: Mexico Musical Instruments - String Revenue (billion) Forecast, by Application 2020 & 2033
- Table 18: Mexico Musical Instruments - String Volume (K) Forecast, by Application 2020 & 2033
- Table 19: Global Musical Instruments - String Revenue billion Forecast, by Application 2020 & 2033
- Table 20: Global Musical Instruments - String Volume K Forecast, by Application 2020 & 2033
- Table 21: Global Musical Instruments - String Revenue billion Forecast, by Types 2020 & 2033
- Table 22: Global Musical Instruments - String Volume K Forecast, by Types 2020 & 2033
- Table 23: Global Musical Instruments - String Revenue billion Forecast, by Country 2020 & 2033
- Table 24: Global Musical Instruments - String Volume K Forecast, by Country 2020 & 2033
- Table 25: Brazil Musical Instruments - String Revenue (billion) Forecast, by Application 2020 & 2033
- Table 26: Brazil Musical Instruments - String Volume (K) Forecast, by Application 2020 & 2033
- Table 27: Argentina Musical Instruments - String Revenue (billion) Forecast, by Application 2020 & 2033
- Table 28: Argentina Musical Instruments - String Volume (K) Forecast, by Application 2020 & 2033
- Table 29: Rest of South America Musical Instruments - String Revenue (billion) Forecast, by Application 2020 & 2033
- Table 30: Rest of South America Musical Instruments - String Volume (K) Forecast, by Application 2020 & 2033
- Table 31: Global Musical Instruments - String Revenue billion Forecast, by Application 2020 & 2033
- Table 32: Global Musical Instruments - String Volume K Forecast, by Application 2020 & 2033
- Table 33: Global Musical Instruments - String Revenue billion Forecast, by Types 2020 & 2033
- Table 34: Global Musical Instruments - String Volume K Forecast, by Types 2020 & 2033
- Table 35: Global Musical Instruments - String Revenue billion Forecast, by Country 2020 & 2033
- Table 36: Global Musical Instruments - String Volume K Forecast, by Country 2020 & 2033
- Table 37: United Kingdom Musical Instruments - String Revenue (billion) Forecast, by Application 2020 & 2033
- Table 38: United Kingdom Musical Instruments - String Volume (K) Forecast, by Application 2020 & 2033
- Table 39: Germany Musical Instruments - String Revenue (billion) Forecast, by Application 2020 & 2033
- Table 40: Germany Musical Instruments - String Volume (K) Forecast, by Application 2020 & 2033
- Table 41: France Musical Instruments - String Revenue (billion) Forecast, by Application 2020 & 2033
- Table 42: France Musical Instruments - String Volume (K) Forecast, by Application 2020 & 2033
- Table 43: Italy Musical Instruments - String Revenue (billion) Forecast, by Application 2020 & 2033
- Table 44: Italy Musical Instruments - String Volume (K) Forecast, by Application 2020 & 2033
- Table 45: Spain Musical Instruments - String Revenue (billion) Forecast, by Application 2020 & 2033
- Table 46: Spain Musical Instruments - String Volume (K) Forecast, by Application 2020 & 2033
- Table 47: Russia Musical Instruments - String Revenue (billion) Forecast, by Application 2020 & 2033
- Table 48: Russia Musical Instruments - String Volume (K) Forecast, by Application 2020 & 2033
- Table 49: Benelux Musical Instruments - String Revenue (billion) Forecast, by Application 2020 & 2033
- Table 50: Benelux Musical Instruments - String Volume (K) Forecast, by Application 2020 & 2033
- Table 51: Nordics Musical Instruments - String Revenue (billion) Forecast, by Application 2020 & 2033
- Table 52: Nordics Musical Instruments - String Volume (K) Forecast, by Application 2020 & 2033
- Table 53: Rest of Europe Musical Instruments - String Revenue (billion) Forecast, by Application 2020 & 2033
- Table 54: Rest of Europe Musical Instruments - String Volume (K) Forecast, by Application 2020 & 2033
- Table 55: Global Musical Instruments - String Revenue billion Forecast, by Application 2020 & 2033
- Table 56: Global Musical Instruments - String Volume K Forecast, by Application 2020 & 2033
- Table 57: Global Musical Instruments - String Revenue billion Forecast, by Types 2020 & 2033
- Table 58: Global Musical Instruments - String Volume K Forecast, by Types 2020 & 2033
- Table 59: Global Musical Instruments - String Revenue billion Forecast, by Country 2020 & 2033
- Table 60: Global Musical Instruments - String Volume K Forecast, by Country 2020 & 2033
- Table 61: Turkey Musical Instruments - String Revenue (billion) Forecast, by Application 2020 & 2033
- Table 62: Turkey Musical Instruments - String Volume (K) Forecast, by Application 2020 & 2033
- Table 63: Israel Musical Instruments - String Revenue (billion) Forecast, by Application 2020 & 2033
- Table 64: Israel Musical Instruments - String Volume (K) Forecast, by Application 2020 & 2033
- Table 65: GCC Musical Instruments - String Revenue (billion) Forecast, by Application 2020 & 2033
- Table 66: GCC Musical Instruments - String Volume (K) Forecast, by Application 2020 & 2033
- Table 67: North Africa Musical Instruments - String Revenue (billion) Forecast, by Application 2020 & 2033
- Table 68: North Africa Musical Instruments - String Volume (K) Forecast, by Application 2020 & 2033
- Table 69: South Africa Musical Instruments - String Revenue (billion) Forecast, by Application 2020 & 2033
- Table 70: South Africa Musical Instruments - String Volume (K) Forecast, by Application 2020 & 2033
- Table 71: Rest of Middle East & Africa Musical Instruments - String Revenue (billion) Forecast, by Application 2020 & 2033
- Table 72: Rest of Middle East & Africa Musical Instruments - String Volume (K) Forecast, by Application 2020 & 2033
- Table 73: Global Musical Instruments - String Revenue billion Forecast, by Application 2020 & 2033
- Table 74: Global Musical Instruments - String Volume K Forecast, by Application 2020 & 2033
- Table 75: Global Musical Instruments - String Revenue billion Forecast, by Types 2020 & 2033
- Table 76: Global Musical Instruments - String Volume K Forecast, by Types 2020 & 2033
- Table 77: Global Musical Instruments - String Revenue billion Forecast, by Country 2020 & 2033
- Table 78: Global Musical Instruments - String Volume K Forecast, by Country 2020 & 2033
- Table 79: China Musical Instruments - String Revenue (billion) Forecast, by Application 2020 & 2033
- Table 80: China Musical Instruments - String Volume (K) Forecast, by Application 2020 & 2033
- Table 81: India Musical Instruments - String Revenue (billion) Forecast, by Application 2020 & 2033
- Table 82: India Musical Instruments - String Volume (K) Forecast, by Application 2020 & 2033
- Table 83: Japan Musical Instruments - String Revenue (billion) Forecast, by Application 2020 & 2033
- Table 84: Japan Musical Instruments - String Volume (K) Forecast, by Application 2020 & 2033
- Table 85: South Korea Musical Instruments - String Revenue (billion) Forecast, by Application 2020 & 2033
- Table 86: South Korea Musical Instruments - String Volume (K) Forecast, by Application 2020 & 2033
- Table 87: ASEAN Musical Instruments - String Revenue (billion) Forecast, by Application 2020 & 2033
- Table 88: ASEAN Musical Instruments - String Volume (K) Forecast, by Application 2020 & 2033
- Table 89: Oceania Musical Instruments - String Revenue (billion) Forecast, by Application 2020 & 2033
- Table 90: Oceania Musical Instruments - String Volume (K) Forecast, by Application 2020 & 2033
- Table 91: Rest of Asia Pacific Musical Instruments - String Revenue (billion) Forecast, by Application 2020 & 2033
- Table 92: Rest of Asia Pacific Musical Instruments - String Volume (K) Forecast, by Application 2020 & 2033
Frequently Asked Questions
1. What is the projected Compound Annual Growth Rate (CAGR) of the Musical Instruments - String?
The projected CAGR is approximately 3.8%.
2. Which companies are prominent players in the Musical Instruments - String?
Key companies in the market include Gibson, Fender, Yamaha, Ibanez, ESP, CORT, Epiphone, Squier, PRS, SCHECTER, Jackson, Peavey, Washburn, Taylor, Farida, Karl Höfner, FranzSandner, Stentor, FengLegend, KAPOK, GCV-Violins, JinYin Musical, Bellafina, NS Design, Barcus Berry, Hofner, Beijing Forest Violins.
3. What are the main segments of the Musical Instruments - String?
The market segments include Application, Types.
4. Can you provide details about the market size?
The market size is estimated to be USD 13.78 billion as of 2022.
5. What are some drivers contributing to market growth?
N/A
6. What are the notable trends driving market growth?
N/A
7. Are there any restraints impacting market growth?
N/A
8. Can you provide examples of recent developments in the market?
N/A
9. What pricing options are available for accessing the report?
Pricing options include single-user, multi-user, and enterprise licenses priced at USD 3350.00, USD 5025.00, and USD 6700.00 respectively.
10. Is the market size provided in terms of value or volume?
The market size is provided in terms of value, measured in billion and volume, measured in K.
11. Are there any specific market keywords associated with the report?
Yes, the market keyword associated with the report is "Musical Instruments - String," which aids in identifying and referencing the specific market segment covered.
12. How do I determine which pricing option suits my needs best?
The pricing options vary based on user requirements and access needs. Individual users may opt for single-user licenses, while businesses requiring broader access may choose multi-user or enterprise licenses for cost-effective access to the report.
13. Are there any additional resources or data provided in the Musical Instruments - String report?
While the report offers comprehensive insights, it's advisable to review the specific contents or supplementary materials provided to ascertain if additional resources or data are available.
14. How can I stay updated on further developments or reports in the Musical Instruments - String?
To stay informed about further developments, trends, and reports in the Musical Instruments - String, consider subscribing to industry newsletters, following relevant companies and organizations, or regularly checking reputable industry news sources and publications.
Methodology
Step 1 - Identification of Relevant Samples Size from Population Database


Step 2 - Approaches for Defining Global Market Size (Value, Volume* & Price*)

Note*: In applicable scenarios
Step 3 - Data Sources
Primary Research
- Web Analytics
- Survey Reports
- Research Institute
- Latest Research Reports
- Opinion Leaders
Secondary Research
- Annual Reports
- White Paper
- Latest Press Release
- Industry Association
- Paid Database
- Investor Presentations

Step 4 - Data Triangulation
Involves using different sources of information in order to increase the validity of a study
These sources are likely to be stakeholders in a program - participants, other researchers, program staff, other community members, and so on.
Then we put all data in single framework & apply various statistical tools to find out the dynamic on the market.
During the analysis stage, feedback from the stakeholder groups would be compared to determine areas of agreement as well as areas of divergence