
Key Insights
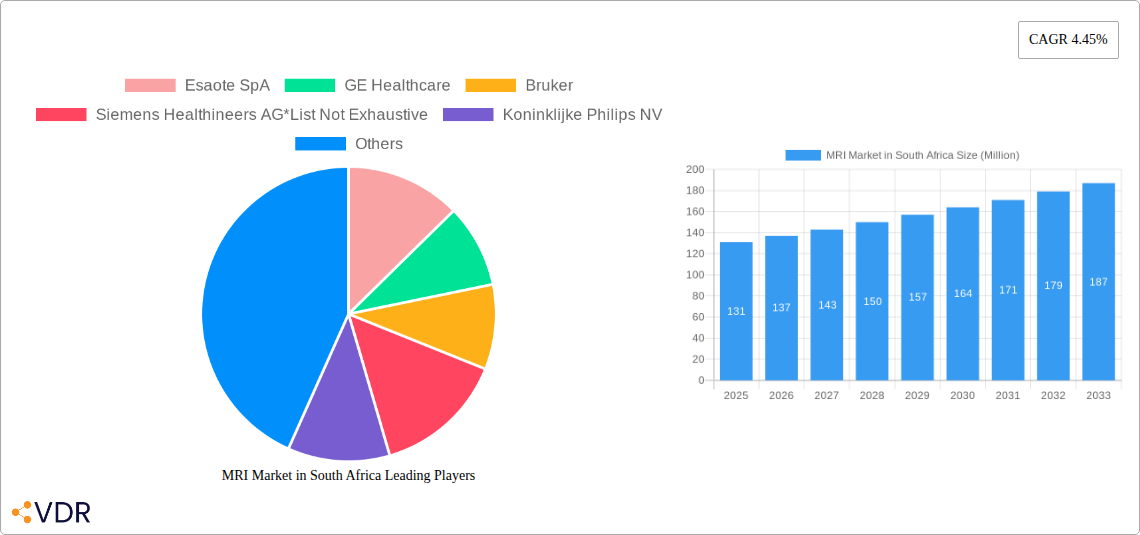
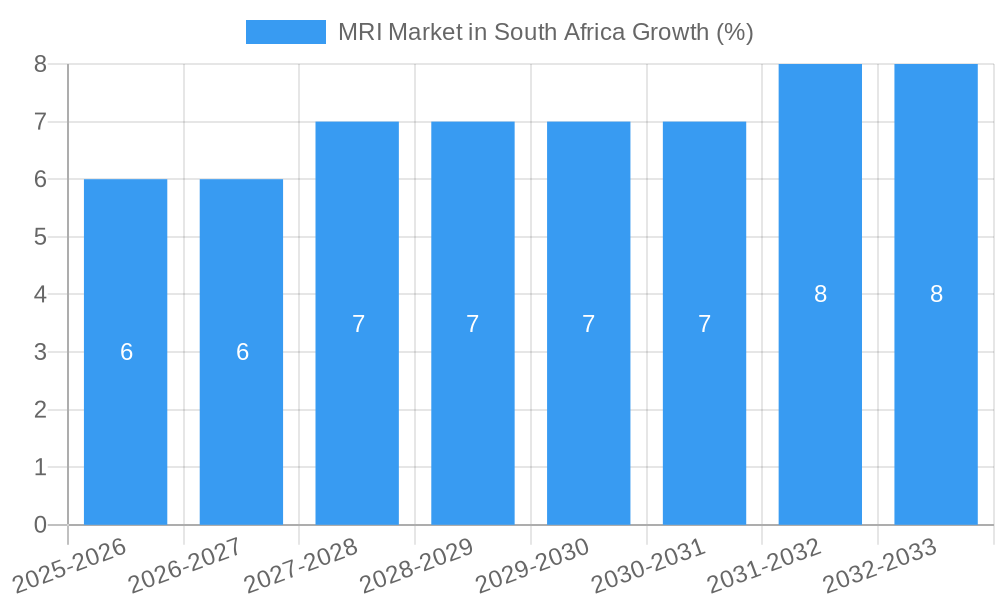
The South African MRI market, valued at $131 million in 2025, is projected to experience robust growth, driven by increasing prevalence of chronic diseases like cancer and neurological disorders necessitating advanced diagnostic imaging. Technological advancements, such as the development of higher-field strength MRI systems (High Field, Very High Field, and Ultra-high Field) offering superior image quality and improved diagnostic capabilities, are significant market drivers. Furthermore, increasing government initiatives focused on improving healthcare infrastructure and expanding access to advanced medical technology within South Africa are bolstering market expansion. While the market faces certain restraints, such as high equipment costs and a limited skilled workforce for operation and maintenance, these challenges are expected to be offset by the rising demand for precise and non-invasive diagnostic tools. The market segmentation reveals a strong preference for closed MRI systems due to their widespread availability and familiarity, though open MRI systems cater to a growing niche, particularly among patients with claustrophobia. High-field MRI systems dominate the field strength segment, reflecting the demand for superior image quality for complex diagnoses. Oncology and Neurology applications are currently the largest segments, highlighting the significance of MRI in cancer detection and brain imaging respectively. Major players like Esaote SpA, GE Healthcare, Siemens Healthineers AG, and Philips are actively competing to capture market share through technological innovations and strategic partnerships. The consistent 4.45% CAGR projected over the forecast period (2025-2033) suggests a continuously expanding market opportunity for MRI technology in South Africa.
The continued growth trajectory is expected to be fueled by the rising disposable incomes and increasing health consciousness among the population. Expansion into underserved rural areas and the introduction of cost-effective MRI solutions will further propel market growth. The competitive landscape is expected to remain dynamic, with companies focusing on providing advanced features and improved service offerings to gain a competitive edge. Further segmentation analysis would indicate specific opportunities for players targeting particular application areas such as cardiology or musculoskeletal imaging. Long-term growth will be closely linked to governmental investments in healthcare infrastructure and public-private partnerships to make advanced diagnostic technologies more accessible to the South African population. Continuous advancements in MRI technology are likely to create new market segments and opportunities, leading to sustained growth within the forecast period.
MRI Market in South Africa: A Comprehensive Market Report (2019-2033)
This comprehensive report provides a detailed analysis of the South African MRI market, encompassing market dynamics, growth trends, key players, and future outlook. The study period covers 2019-2033, with a base year of 2025 and a forecast period of 2025-2033. The report utilizes both quantitative and qualitative data to offer a holistic understanding of this vital sector of the South African healthcare landscape. This analysis covers the parent market of medical imaging equipment and the child market of MRI systems specifically within South Africa. Expected market value is presented in million units.
MRI Market in South Africa Market Dynamics & Structure
This section analyzes the competitive landscape, technological advancements, regulatory environment, and market trends influencing the South African MRI market. The market is characterized by a moderate level of concentration, with key players such as Esaote SpA, GE Healthcare, Bruker, Siemens Healthineers AG, Koninklijke Philips NV, Canon Medical Systems Corporation, and Fujifilm Holdings Corporation holding significant market share. However, the market also shows potential for new entrants and disruptive technologies.
- Market Concentration: xx% market share held by the top 5 players in 2024.
- Technological Innovation: Continuous innovation in MRI technology, particularly in areas like high-field strength systems and AI-powered image analysis, is driving market growth. However, high initial investment costs and a need for specialized expertise pose barriers to entry.
- Regulatory Framework: The South African regulatory environment for medical devices influences market access and pricing. Stringent regulatory approvals are in place, impacting the speed of technology adoption.
- Competitive Substitutes: Other medical imaging modalities, such as CT scans and ultrasound, compete with MRI for diagnostic applications. The choice often depends on the specific clinical need and cost considerations.
- End-User Demographics: The demand for MRI services is driven by an aging population and rising prevalence of chronic diseases requiring advanced diagnostic tools. Private healthcare facilities account for a larger share of MRI installations compared to public hospitals.
- M&A Trends: The South African MRI market has witnessed xx M&A deals in the past five years, reflecting strategic consolidation and expansion efforts by major players. These deals primarily focus on enhancing market access and product portfolios.
MRI Market in South Africa Growth Trends & Insights
The South African MRI market experienced significant growth during the historical period (2019-2024), with a CAGR of xx%. This growth is attributed to increased healthcare spending, rising prevalence of chronic diseases, and technological advancements leading to improved image quality and faster scan times. Market size in 2024 reached xx Million units. The market is expected to continue its growth trajectory during the forecast period (2025-2033), with a projected CAGR of xx%, driven by factors such as government initiatives to improve healthcare infrastructure and increasing adoption of advanced MRI technologies. Market penetration is currently at xx% and is anticipated to reach xx% by 2033. Consumer behavior shifts towards increased preference for higher field strength systems and minimally invasive procedures are also influencing market dynamics.
Dominant Regions, Countries, or Segments in MRI Market in South Africa
The Gauteng province dominates the South African MRI market due to its concentration of major hospitals and private healthcare facilities. Within the segments, high-field MRI systems (1.5T and 3T) hold the largest market share, driven by their superior image quality and diagnostic capabilities. The oncology application segment demonstrates significant growth potential due to increasing cancer prevalence rates.
- Leading Region: Gauteng
- Leading Segment (Architecture): Closed MRI Systems
- Leading Segment (Field Strength): High-Field MRI Systems
- Leading Segment (Application): Oncology
- Key Drivers: Increasing healthcare expenditure, government initiatives to upgrade healthcare infrastructure, and rising prevalence of chronic diseases.
MRI Market in South Africa Product Landscape
The South African MRI market features a diverse range of products, including closed and open MRI systems with varying field strengths (low, high, very high, and ultra-high). Recent innovations include AI-powered image analysis tools that enhance diagnostic accuracy and reduce scan times. Key product differentiators focus on improved image quality, faster scan times, patient comfort, and cost-effectiveness. Manufacturers continuously strive to develop systems with advanced features, such as improved coil technology and advanced post-processing software.
Key Drivers, Barriers & Challenges in MRI Market in South Africa
Key Drivers:
- Rising prevalence of chronic diseases requiring advanced diagnostic tools.
- Increased healthcare spending and government initiatives to improve healthcare infrastructure.
- Technological advancements leading to improved image quality and faster scan times.
Challenges and Restraints:
- High cost of MRI systems and associated infrastructure limits accessibility in public healthcare settings.
- Limited availability of skilled radiologists and technicians hinders the effective utilization of MRI technology.
- Stringent regulatory approvals and import procedures can create delays in market entry for new technologies.
Emerging Opportunities in MRI Market in South Africa
The South African MRI market presents opportunities in expanding access to MRI services in underserved regions, leveraging AI-powered diagnostics, and developing specialized applications for specific disease areas. The growth of private healthcare and medical tourism also creates new market opportunities. Additionally, partnerships between private and public healthcare systems can contribute to better patient access to this essential technology.
Growth Accelerators in the MRI Market in South Africa Industry
Strategic partnerships between international manufacturers and local healthcare providers are driving market growth. Technological advancements, such as the development of more compact and cost-effective MRI systems, are expanding accessibility. Government initiatives to improve healthcare infrastructure and increase investment in medical technology are additional catalysts for long-term growth.
Key Players Shaping the MRI Market in South Africa Market
- Esaote SpA
- GE Healthcare
- Bruker
- Siemens Healthineers AG
- Koninklijke Philips NV
- Canon Medical Systems Corporation
- Fujifilm Holdings Corporation
Notable Milestones in MRI Market in South Africa Sector
- July 2022: The IAEA partnered with GE Healthcare to train African medical imaging professionals in PET-CT and PET-MRI techniques, improving diagnostic capabilities.
- February 2023: United Imaging secured agreements in South Africa for its uAiFI-powered 1.5T Wide Bore MRI System and PET/MR uPMR 790 at Arab Health 2023, signaling increased market activity.
In-Depth MRI Market in South Africa Market Outlook
The South African MRI market is poised for sustained growth, driven by increasing demand for advanced diagnostic imaging, technological innovation, and supportive government policies. Strategic partnerships and investments in healthcare infrastructure will further propel market expansion. The focus will shift towards enhancing accessibility, affordability, and the adoption of cutting-edge technologies to meet the growing healthcare needs of the population.
MRI Market in South Africa Segmentation
-
1. Architecture
- 1.1. Closed MRI Systems
- 1.2. Open MRI Systems
-
2. Field Strength
- 2.1. Low Field MRI Systems
- 2.2. High Field MRI Systems
- 2.3. Very Hig
-
3. Application
- 3.1. Oncology
- 3.2. Neurology
- 3.3. Cardiology
- 3.4. Gastroenterology
- 3.5. Musculoskeletal
- 3.6. Other Applications
MRI Market in South Africa Segmentation By Geography
-
1. North America
- 1.1. United States
- 1.2. Canada
- 1.3. Mexico
-
2. South America
- 2.1. Brazil
- 2.2. Argentina
- 2.3. Rest of South America
-
3. Europe
- 3.1. United Kingdom
- 3.2. Germany
- 3.3. France
- 3.4. Italy
- 3.5. Spain
- 3.6. Russia
- 3.7. Benelux
- 3.8. Nordics
- 3.9. Rest of Europe
-
4. Middle East & Africa
- 4.1. Turkey
- 4.2. Israel
- 4.3. GCC
- 4.4. North Africa
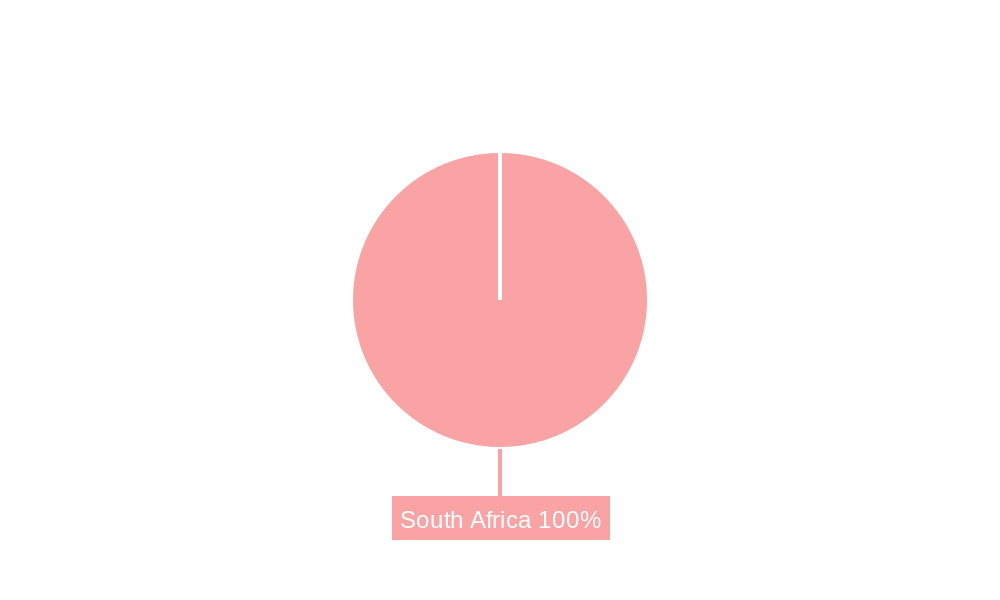
- 4.5. South Africa
- 4.6. Rest of Middle East & Africa
-
5. Asia Pacific
- 5.1. China
- 5.2. India
- 5.3. Japan
- 5.4. South Korea
- 5.5. ASEAN
- 5.6. Oceania
- 5.7. Rest of Asia Pacific
MRI Market in South Africa REPORT HIGHLIGHTS
| Aspects | Details |
|---|---|
| Study Period | 2019-2033 |
| Base Year | 2024 |
| Estimated Year | 2025 |
| Forecast Period | 2025-2033 |
| Historical Period | 2019-2024 |
| Growth Rate | CAGR of 4.45% from 2019-2033 |
| Segmentation |
|
Table of Contents
- 1. Introduction
- 1.1. Research Scope
- 1.2. Market Segmentation
- 1.3. Research Methodology
- 1.4. Definitions and Assumptions
- 2. Executive Summary
- 2.1. Introduction
- 3. Market Dynamics
- 3.1. Introduction
- 3.2. Market Drivers
- 3.2.1. Increasing Prevalence of Chronic Diseases; Growing Technological Advancements
- 3.3. Market Restrains
- 3.3.1. Lack of Proper Reimbursement and Stringent Regulatory Approval Procedures; High Cost of Equipment
- 3.4. Market Trends
- 3.4.1. High Field MRI System Segment is Expected to Hold a Significant Market Share Over the Forecast Period
- 4. Market Factor Analysis
- 4.1. Porters Five Forces
- 4.2. Supply/Value Chain
- 4.3. PESTEL analysis
- 4.4. Market Entropy
- 4.5. Patent/Trademark Analysis
- 5. Global MRI Market in South Africa Analysis, Insights and Forecast, 2019-2031
- 5.1. Market Analysis, Insights and Forecast - by Architecture
- 5.1.1. Closed MRI Systems
- 5.1.2. Open MRI Systems
- 5.2. Market Analysis, Insights and Forecast - by Field Strength
- 5.2.1. Low Field MRI Systems
- 5.2.2. High Field MRI Systems
- 5.2.3. Very Hig
- 5.3. Market Analysis, Insights and Forecast - by Application
- 5.3.1. Oncology
- 5.3.2. Neurology
- 5.3.3. Cardiology
- 5.3.4. Gastroenterology
- 5.3.5. Musculoskeletal
- 5.3.6. Other Applications
- 5.4. Market Analysis, Insights and Forecast - by Region
- 5.4.1. North America
- 5.4.2. South America
- 5.4.3. Europe
- 5.4.4. Middle East & Africa
- 5.4.5. Asia Pacific
- 5.1. Market Analysis, Insights and Forecast - by Architecture
- 6. North America MRI Market in South Africa Analysis, Insights and Forecast, 2019-2031
- 6.1. Market Analysis, Insights and Forecast - by Architecture
- 6.1.1. Closed MRI Systems
- 6.1.2. Open MRI Systems
- 6.2. Market Analysis, Insights and Forecast - by Field Strength
- 6.2.1. Low Field MRI Systems
- 6.2.2. High Field MRI Systems
- 6.2.3. Very Hig
- 6.3. Market Analysis, Insights and Forecast - by Application
- 6.3.1. Oncology
- 6.3.2. Neurology
- 6.3.3. Cardiology
- 6.3.4. Gastroenterology
- 6.3.5. Musculoskeletal
- 6.3.6. Other Applications
- 6.1. Market Analysis, Insights and Forecast - by Architecture
- 7. South America MRI Market in South Africa Analysis, Insights and Forecast, 2019-2031
- 7.1. Market Analysis, Insights and Forecast - by Architecture
- 7.1.1. Closed MRI Systems
- 7.1.2. Open MRI Systems
- 7.2. Market Analysis, Insights and Forecast - by Field Strength
- 7.2.1. Low Field MRI Systems
- 7.2.2. High Field MRI Systems
- 7.2.3. Very Hig
- 7.3. Market Analysis, Insights and Forecast - by Application
- 7.3.1. Oncology
- 7.3.2. Neurology
- 7.3.3. Cardiology
- 7.3.4. Gastroenterology
- 7.3.5. Musculoskeletal
- 7.3.6. Other Applications
- 7.1. Market Analysis, Insights and Forecast - by Architecture
- 8. Europe MRI Market in South Africa Analysis, Insights and Forecast, 2019-2031
- 8.1. Market Analysis, Insights and Forecast - by Architecture
- 8.1.1. Closed MRI Systems
- 8.1.2. Open MRI Systems
- 8.2. Market Analysis, Insights and Forecast - by Field Strength
- 8.2.1. Low Field MRI Systems
- 8.2.2. High Field MRI Systems
- 8.2.3. Very Hig
- 8.3. Market Analysis, Insights and Forecast - by Application
- 8.3.1. Oncology
- 8.3.2. Neurology
- 8.3.3. Cardiology
- 8.3.4. Gastroenterology
- 8.3.5. Musculoskeletal
- 8.3.6. Other Applications
- 8.1. Market Analysis, Insights and Forecast - by Architecture
- 9. Middle East & Africa MRI Market in South Africa Analysis, Insights and Forecast, 2019-2031
- 9.1. Market Analysis, Insights and Forecast - by Architecture
- 9.1.1. Closed MRI Systems
- 9.1.2. Open MRI Systems
- 9.2. Market Analysis, Insights and Forecast - by Field Strength
- 9.2.1. Low Field MRI Systems
- 9.2.2. High Field MRI Systems
- 9.2.3. Very Hig
- 9.3. Market Analysis, Insights and Forecast - by Application
- 9.3.1. Oncology
- 9.3.2. Neurology
- 9.3.3. Cardiology
- 9.3.4. Gastroenterology
- 9.3.5. Musculoskeletal
- 9.3.6. Other Applications
- 9.1. Market Analysis, Insights and Forecast - by Architecture
- 10. Asia Pacific MRI Market in South Africa Analysis, Insights and Forecast, 2019-2031
- 10.1. Market Analysis, Insights and Forecast - by Architecture
- 10.1.1. Closed MRI Systems
- 10.1.2. Open MRI Systems
- 10.2. Market Analysis, Insights and Forecast - by Field Strength
- 10.2.1. Low Field MRI Systems
- 10.2.2. High Field MRI Systems
- 10.2.3. Very Hig
- 10.3. Market Analysis, Insights and Forecast - by Application
- 10.3.1. Oncology
- 10.3.2. Neurology
- 10.3.3. Cardiology
- 10.3.4. Gastroenterology
- 10.3.5. Musculoskeletal
- 10.3.6. Other Applications
- 10.1. Market Analysis, Insights and Forecast - by Architecture
- 11. Competitive Analysis
- 11.1. Global Market Share Analysis 2024
- 11.2. Company Profiles
- 11.2.1 Esaote SpA
- 11.2.1.1. Overview
- 11.2.1.2. Products
- 11.2.1.3. SWOT Analysis
- 11.2.1.4. Recent Developments
- 11.2.1.5. Financials (Based on Availability)
- 11.2.2 GE Healthcare
- 11.2.2.1. Overview
- 11.2.2.2. Products
- 11.2.2.3. SWOT Analysis
- 11.2.2.4. Recent Developments
- 11.2.2.5. Financials (Based on Availability)
- 11.2.3 Bruker
- 11.2.3.1. Overview
- 11.2.3.2. Products
- 11.2.3.3. SWOT Analysis
- 11.2.3.4. Recent Developments
- 11.2.3.5. Financials (Based on Availability)
- 11.2.4 Siemens Healthineers AG*List Not Exhaustive
- 11.2.4.1. Overview
- 11.2.4.2. Products
- 11.2.4.3. SWOT Analysis
- 11.2.4.4. Recent Developments
- 11.2.4.5. Financials (Based on Availability)
- 11.2.5 Koninklijke Philips NV
- 11.2.5.1. Overview
- 11.2.5.2. Products
- 11.2.5.3. SWOT Analysis
- 11.2.5.4. Recent Developments
- 11.2.5.5. Financials (Based on Availability)
- 11.2.6 Canon Medical Systems Corporation
- 11.2.6.1. Overview
- 11.2.6.2. Products
- 11.2.6.3. SWOT Analysis
- 11.2.6.4. Recent Developments
- 11.2.6.5. Financials (Based on Availability)
- 11.2.7 Fujifilm Holdings Corporation
- 11.2.7.1. Overview
- 11.2.7.2. Products
- 11.2.7.3. SWOT Analysis
- 11.2.7.4. Recent Developments
- 11.2.7.5. Financials (Based on Availability)
- 11.2.1 Esaote SpA
List of Figures
- Figure 1: Global MRI Market in South Africa Revenue Breakdown (Million, %) by Region 2024 & 2032
- Figure 2: South Africa MRI Market in South Africa Revenue (Million), by Country 2024 & 2032
- Figure 3: South Africa MRI Market in South Africa Revenue Share (%), by Country 2024 & 2032
- Figure 4: North America MRI Market in South Africa Revenue (Million), by Architecture 2024 & 2032
- Figure 5: North America MRI Market in South Africa Revenue Share (%), by Architecture 2024 & 2032
- Figure 6: North America MRI Market in South Africa Revenue (Million), by Field Strength 2024 & 2032
- Figure 7: North America MRI Market in South Africa Revenue Share (%), by Field Strength 2024 & 2032
- Figure 8: North America MRI Market in South Africa Revenue (Million), by Application 2024 & 2032
- Figure 9: North America MRI Market in South Africa Revenue Share (%), by Application 2024 & 2032
- Figure 10: North America MRI Market in South Africa Revenue (Million), by Country 2024 & 2032
- Figure 11: North America MRI Market in South Africa Revenue Share (%), by Country 2024 & 2032
- Figure 12: South America MRI Market in South Africa Revenue (Million), by Architecture 2024 & 2032
- Figure 13: South America MRI Market in South Africa Revenue Share (%), by Architecture 2024 & 2032
- Figure 14: South America MRI Market in South Africa Revenue (Million), by Field Strength 2024 & 2032
- Figure 15: South America MRI Market in South Africa Revenue Share (%), by Field Strength 2024 & 2032
- Figure 16: South America MRI Market in South Africa Revenue (Million), by Application 2024 & 2032
- Figure 17: South America MRI Market in South Africa Revenue Share (%), by Application 2024 & 2032
- Figure 18: South America MRI Market in South Africa Revenue (Million), by Country 2024 & 2032
- Figure 19: South America MRI Market in South Africa Revenue Share (%), by Country 2024 & 2032
- Figure 20: Europe MRI Market in South Africa Revenue (Million), by Architecture 2024 & 2032
- Figure 21: Europe MRI Market in South Africa Revenue Share (%), by Architecture 2024 & 2032
- Figure 22: Europe MRI Market in South Africa Revenue (Million), by Field Strength 2024 & 2032
- Figure 23: Europe MRI Market in South Africa Revenue Share (%), by Field Strength 2024 & 2032
- Figure 24: Europe MRI Market in South Africa Revenue (Million), by Application 2024 & 2032
- Figure 25: Europe MRI Market in South Africa Revenue Share (%), by Application 2024 & 2032
- Figure 26: Europe MRI Market in South Africa Revenue (Million), by Country 2024 & 2032
- Figure 27: Europe MRI Market in South Africa Revenue Share (%), by Country 2024 & 2032
- Figure 28: Middle East & Africa MRI Market in South Africa Revenue (Million), by Architecture 2024 & 2032
- Figure 29: Middle East & Africa MRI Market in South Africa Revenue Share (%), by Architecture 2024 & 2032
- Figure 30: Middle East & Africa MRI Market in South Africa Revenue (Million), by Field Strength 2024 & 2032
- Figure 31: Middle East & Africa MRI Market in South Africa Revenue Share (%), by Field Strength 2024 & 2032
- Figure 32: Middle East & Africa MRI Market in South Africa Revenue (Million), by Application 2024 & 2032
- Figure 33: Middle East & Africa MRI Market in South Africa Revenue Share (%), by Application 2024 & 2032
- Figure 34: Middle East & Africa MRI Market in South Africa Revenue (Million), by Country 2024 & 2032
- Figure 35: Middle East & Africa MRI Market in South Africa Revenue Share (%), by Country 2024 & 2032
- Figure 36: Asia Pacific MRI Market in South Africa Revenue (Million), by Architecture 2024 & 2032
- Figure 37: Asia Pacific MRI Market in South Africa Revenue Share (%), by Architecture 2024 & 2032
- Figure 38: Asia Pacific MRI Market in South Africa Revenue (Million), by Field Strength 2024 & 2032
- Figure 39: Asia Pacific MRI Market in South Africa Revenue Share (%), by Field Strength 2024 & 2032
- Figure 40: Asia Pacific MRI Market in South Africa Revenue (Million), by Application 2024 & 2032
- Figure 41: Asia Pacific MRI Market in South Africa Revenue Share (%), by Application 2024 & 2032
- Figure 42: Asia Pacific MRI Market in South Africa Revenue (Million), by Country 2024 & 2032
- Figure 43: Asia Pacific MRI Market in South Africa Revenue Share (%), by Country 2024 & 2032
List of Tables
- Table 1: Global MRI Market in South Africa Revenue Million Forecast, by Region 2019 & 2032
- Table 2: Global MRI Market in South Africa Revenue Million Forecast, by Architecture 2019 & 2032
- Table 3: Global MRI Market in South Africa Revenue Million Forecast, by Field Strength 2019 & 2032
- Table 4: Global MRI Market in South Africa Revenue Million Forecast, by Application 2019 & 2032
- Table 5: Global MRI Market in South Africa Revenue Million Forecast, by Region 2019 & 2032
- Table 6: Global MRI Market in South Africa Revenue Million Forecast, by Country 2019 & 2032
- Table 7: Global MRI Market in South Africa Revenue Million Forecast, by Architecture 2019 & 2032
- Table 8: Global MRI Market in South Africa Revenue Million Forecast, by Field Strength 2019 & 2032
- Table 9: Global MRI Market in South Africa Revenue Million Forecast, by Application 2019 & 2032
- Table 10: Global MRI Market in South Africa Revenue Million Forecast, by Country 2019 & 2032
- Table 11: United States MRI Market in South Africa Revenue (Million) Forecast, by Application 2019 & 2032
- Table 12: Canada MRI Market in South Africa Revenue (Million) Forecast, by Application 2019 & 2032
- Table 13: Mexico MRI Market in South Africa Revenue (Million) Forecast, by Application 2019 & 2032
- Table 14: Global MRI Market in South Africa Revenue Million Forecast, by Architecture 2019 & 2032
- Table 15: Global MRI Market in South Africa Revenue Million Forecast, by Field Strength 2019 & 2032
- Table 16: Global MRI Market in South Africa Revenue Million Forecast, by Application 2019 & 2032
- Table 17: Global MRI Market in South Africa Revenue Million Forecast, by Country 2019 & 2032
- Table 18: Brazil MRI Market in South Africa Revenue (Million) Forecast, by Application 2019 & 2032
- Table 19: Argentina MRI Market in South Africa Revenue (Million) Forecast, by Application 2019 & 2032
- Table 20: Rest of South America MRI Market in South Africa Revenue (Million) Forecast, by Application 2019 & 2032
- Table 21: Global MRI Market in South Africa Revenue Million Forecast, by Architecture 2019 & 2032
- Table 22: Global MRI Market in South Africa Revenue Million Forecast, by Field Strength 2019 & 2032
- Table 23: Global MRI Market in South Africa Revenue Million Forecast, by Application 2019 & 2032
- Table 24: Global MRI Market in South Africa Revenue Million Forecast, by Country 2019 & 2032
- Table 25: United Kingdom MRI Market in South Africa Revenue (Million) Forecast, by Application 2019 & 2032
- Table 26: Germany MRI Market in South Africa Revenue (Million) Forecast, by Application 2019 & 2032
- Table 27: France MRI Market in South Africa Revenue (Million) Forecast, by Application 2019 & 2032
- Table 28: Italy MRI Market in South Africa Revenue (Million) Forecast, by Application 2019 & 2032
- Table 29: Spain MRI Market in South Africa Revenue (Million) Forecast, by Application 2019 & 2032
- Table 30: Russia MRI Market in South Africa Revenue (Million) Forecast, by Application 2019 & 2032
- Table 31: Benelux MRI Market in South Africa Revenue (Million) Forecast, by Application 2019 & 2032
- Table 32: Nordics MRI Market in South Africa Revenue (Million) Forecast, by Application 2019 & 2032
- Table 33: Rest of Europe MRI Market in South Africa Revenue (Million) Forecast, by Application 2019 & 2032
- Table 34: Global MRI Market in South Africa Revenue Million Forecast, by Architecture 2019 & 2032
- Table 35: Global MRI Market in South Africa Revenue Million Forecast, by Field Strength 2019 & 2032
- Table 36: Global MRI Market in South Africa Revenue Million Forecast, by Application 2019 & 2032
- Table 37: Global MRI Market in South Africa Revenue Million Forecast, by Country 2019 & 2032
- Table 38: Turkey MRI Market in South Africa Revenue (Million) Forecast, by Application 2019 & 2032
- Table 39: Israel MRI Market in South Africa Revenue (Million) Forecast, by Application 2019 & 2032
- Table 40: GCC MRI Market in South Africa Revenue (Million) Forecast, by Application 2019 & 2032
- Table 41: North Africa MRI Market in South Africa Revenue (Million) Forecast, by Application 2019 & 2032
- Table 42: South Africa MRI Market in South Africa Revenue (Million) Forecast, by Application 2019 & 2032
- Table 43: Rest of Middle East & Africa MRI Market in South Africa Revenue (Million) Forecast, by Application 2019 & 2032
- Table 44: Global MRI Market in South Africa Revenue Million Forecast, by Architecture 2019 & 2032
- Table 45: Global MRI Market in South Africa Revenue Million Forecast, by Field Strength 2019 & 2032
- Table 46: Global MRI Market in South Africa Revenue Million Forecast, by Application 2019 & 2032
- Table 47: Global MRI Market in South Africa Revenue Million Forecast, by Country 2019 & 2032
- Table 48: China MRI Market in South Africa Revenue (Million) Forecast, by Application 2019 & 2032
- Table 49: India MRI Market in South Africa Revenue (Million) Forecast, by Application 2019 & 2032
- Table 50: Japan MRI Market in South Africa Revenue (Million) Forecast, by Application 2019 & 2032
- Table 51: South Korea MRI Market in South Africa Revenue (Million) Forecast, by Application 2019 & 2032
- Table 52: ASEAN MRI Market in South Africa Revenue (Million) Forecast, by Application 2019 & 2032
- Table 53: Oceania MRI Market in South Africa Revenue (Million) Forecast, by Application 2019 & 2032
- Table 54: Rest of Asia Pacific MRI Market in South Africa Revenue (Million) Forecast, by Application 2019 & 2032
Frequently Asked Questions
1. What is the projected Compound Annual Growth Rate (CAGR) of the MRI Market in South Africa?
The projected CAGR is approximately 4.45%.
2. Which companies are prominent players in the MRI Market in South Africa?
Key companies in the market include Esaote SpA, GE Healthcare, Bruker, Siemens Healthineers AG*List Not Exhaustive, Koninklijke Philips NV, Canon Medical Systems Corporation, Fujifilm Holdings Corporation.
3. What are the main segments of the MRI Market in South Africa?
The market segments include Architecture, Field Strength, Application.
4. Can you provide details about the market size?
The market size is estimated to be USD 1.31 Million as of 2022.
5. What are some drivers contributing to market growth?
Increasing Prevalence of Chronic Diseases; Growing Technological Advancements.
6. What are the notable trends driving market growth?
High Field MRI System Segment is Expected to Hold a Significant Market Share Over the Forecast Period.
7. Are there any restraints impacting market growth?
Lack of Proper Reimbursement and Stringent Regulatory Approval Procedures; High Cost of Equipment.
8. Can you provide examples of recent developments in the market?
February 2023: At Arab Health 2023, United Imaging announced multiple agreements in the Middle East and Africa, including South Africa, for the uAiFI-powered 1.5T Wide Bore MRI System and PET/MR uPMR 790.
9. What pricing options are available for accessing the report?
Pricing options include single-user, multi-user, and enterprise licenses priced at USD 3800, USD 4500, and USD 5800 respectively.
10. Is the market size provided in terms of value or volume?
The market size is provided in terms of value, measured in Million.
11. Are there any specific market keywords associated with the report?
Yes, the market keyword associated with the report is "MRI Market in South Africa," which aids in identifying and referencing the specific market segment covered.
12. How do I determine which pricing option suits my needs best?
The pricing options vary based on user requirements and access needs. Individual users may opt for single-user licenses, while businesses requiring broader access may choose multi-user or enterprise licenses for cost-effective access to the report.
13. Are there any additional resources or data provided in the MRI Market in South Africa report?
While the report offers comprehensive insights, it's advisable to review the specific contents or supplementary materials provided to ascertain if additional resources or data are available.
14. How can I stay updated on further developments or reports in the MRI Market in South Africa?
To stay informed about further developments, trends, and reports in the MRI Market in South Africa, consider subscribing to industry newsletters, following relevant companies and organizations, or regularly checking reputable industry news sources and publications.
Methodology
Step 1 - Identification of Relevant Samples Size from Population Database


Step 2 - Approaches for Defining Global Market Size (Value, Volume* & Price*)

Note*: In applicable scenarios
Step 3 - Data Sources
Primary Research
- Web Analytics
- Survey Reports
- Research Institute
- Latest Research Reports
- Opinion Leaders
Secondary Research
- Annual Reports
- White Paper
- Latest Press Release
- Industry Association
- Paid Database
- Investor Presentations

Step 4 - Data Triangulation
Involves using different sources of information in order to increase the validity of a study
These sources are likely to be stakeholders in a program - participants, other researchers, program staff, other community members, and so on.
Then we put all data in single framework & apply various statistical tools to find out the dynamic on the market.
During the analysis stage, feedback from the stakeholder groups would be compared to determine areas of agreement as well as areas of divergence


