

Key Insights
The Molten Salt Thermal Energy Storage (MSTES) market is poised for significant expansion, driven by the escalating global demand for renewable energy and the imperative for effective energy storage. The market is projected to reach $2.22 billion by 2025, exhibiting a robust Compound Annual Growth Rate (CAGR) of 9.8%. This growth trajectory is underpinned by several critical factors. Primarily, the inherent intermittency of solar and wind power generation necessitates dependable storage solutions, with MSTES offering superior capacity and extended duration capabilities. Concurrently, continuous innovation in technologies such as parabolic troughs, Fresnel reflectors, and power tower systems is optimizing efficiency and reducing operational costs. Furthermore, supportive governmental policies aimed at accelerating renewable energy integration are acting as a powerful catalyst for market growth. Leading industry players, including SCHOTT AG and SolarReserve LLC, are actively pioneering advancements and broadening their market reach through strategic alliances and technological enhancements. Geographically, North America, Europe, and Asia-Pacific currently dominate market share, with emerging regions in the Middle East and Africa demonstrating considerable growth potential.
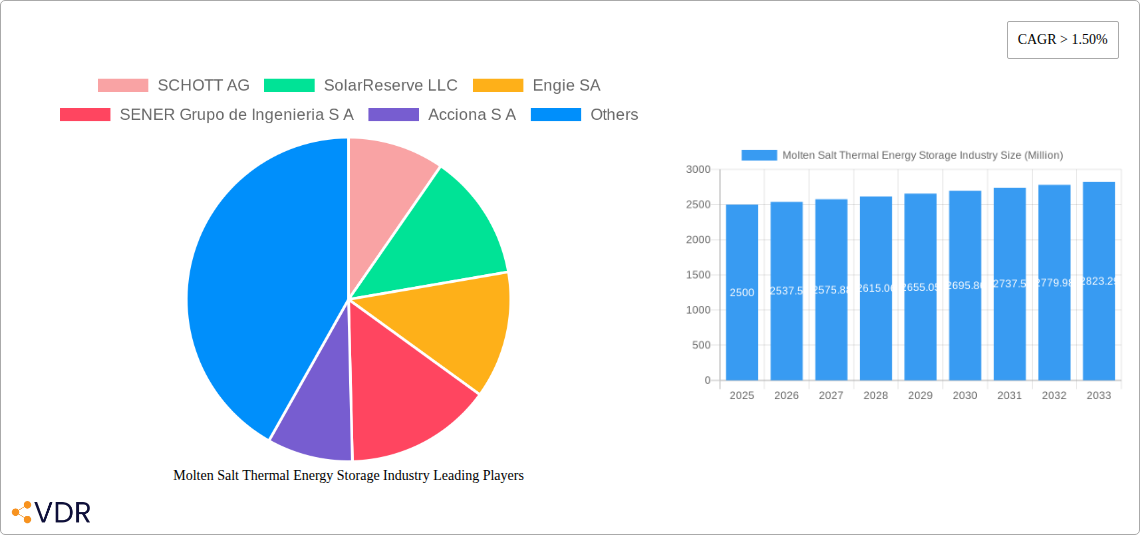
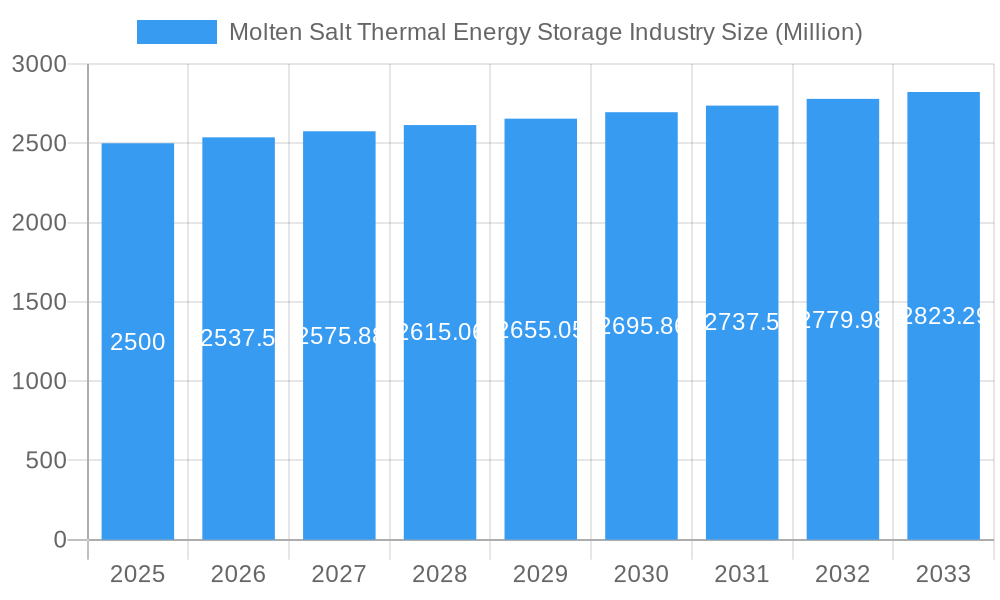
Molten Salt Thermal Energy Storage Industry Market Size (In Billion)
While the forecast for MSTES is overwhelmingly positive, certain challenges persist. Substantial upfront investment costs represent a barrier for emerging companies, and ongoing research is crucial to address concerns related to material longevity and operational safety. Nevertheless, sustained investment in research and development, coupled with anticipated economies of scale from increased deployment, is expected to effectively mitigate these restraints. The broadening application scope of MSTES beyond solar thermal power generation, encompassing industrial process heat and grid-scale energy storage, presents substantial future growth avenues. Projections indicate a consistent increase in market valuation over the coming decade, with advancements in technology and wider adoption positioning MSTES as a pivotal component in the global shift towards sustainable energy systems.
Molten Salt Thermal Energy Storage Industry Company Market Share
Molten Salt Thermal Energy Storage (MSTS) Industry Report: 2019-2033
This comprehensive report provides a detailed analysis of the Molten Salt Thermal Energy Storage (MSTS) industry, encompassing market dynamics, growth trends, regional dominance, product landscape, key players, and future outlook. The report covers the period 2019-2033, with a base year of 2025 and a forecast period of 2025-2033. The MSTS market, a crucial segment within the broader renewable energy storage sector, is poised for significant growth driven by increasing demand for reliable and efficient energy solutions.
Molten Salt Thermal Energy Storage Industry Market Dynamics & Structure
This section analyzes the MSTS market's structure, identifying key trends and influencing factors. The market is characterized by moderate concentration, with several major players vying for market share. Technological innovation, particularly in materials science and system efficiency, is a key driver. Regulatory frameworks, including government incentives and carbon emission reduction targets, heavily influence market growth. Competitive substitutes, such as compressed air energy storage (CAES), also impact market dynamics. The end-user demographics span diverse sectors including power generation, industrial processes, and district heating systems. Mergers and acquisitions (M&A) activity has been moderate, with larger players consolidating their positions.
- Market Concentration: Moderately concentrated, with the top 5 players holding approximately xx% of the market share in 2025.
- Technological Innovation: Focus on improving thermal efficiency, reducing material costs, and enhancing system reliability.
- Regulatory Framework: Government policies promoting renewable energy integration and carbon neutrality are significant drivers.
- Competitive Substitutes: CAES and pumped hydro storage (PHS) present competitive alternatives.
- M&A Activity: An estimated xx M&A deals were recorded between 2019 and 2024, indicating a consolidating market.
- End-User Demographics: Power generation (xx%), industrial processes (xx%), and district heating (xx%) constitute the major end-user segments.
Molten Salt Thermal Energy Storage Industry Growth Trends & Insights
The MSTS market is experiencing robust growth, driven by the increasing adoption of renewable energy sources and the need for reliable energy storage solutions. The market size has expanded from xx million in 2019 to an estimated xx million in 2025, exhibiting a Compound Annual Growth Rate (CAGR) of xx% during the historical period. Market penetration is increasing steadily, particularly in regions with high renewable energy integration rates. Technological disruptions, such as advancements in molten salt materials and improved system designs, are further accelerating growth. Consumer behavior is shifting towards more sustainable and reliable energy solutions, boosting market demand.
- Market Size: Estimated at xx million in 2025, projected to reach xx million by 2033.
- CAGR: xx% during the historical period (2019-2024); projected xx% during the forecast period (2025-2033).
- Market Penetration: Increasing steadily, with xx% penetration in key markets by 2025.
- Technological Disruptions: Advancements in materials science and system design are improving efficiency and reducing costs.
Dominant Regions, Countries, or Segments in Molten Salt Thermal Energy Storage Industry
The Molten Salt Thermal Energy Storage (MSTS) market is exhibiting significant geographical concentration, with robust expansion primarily observed in regions endowed with abundant solar and Concentrated Solar Power (CSP) resources. Currently, **[Insert leading region/country here, e.g., China, Spain, or the United States]** is at the forefront of market development. This leadership is underpinned by a confluence of factors, including proactive and supportive government policies, substantial investments directed towards renewable energy infrastructure, and a generally favorable and stable regulatory environment that encourages long-term commitment. Within the technology segments, **Parabolic Troughs** currently command the largest market share. This dominance stems from its well-established technology, proven reliability, and a comparatively lower initial cost, making it an accessible entry point for many projects. However, the landscape is dynamic, with **Power Tower** technology projected to experience a considerably faster growth trajectory. This anticipated surge is attributed to its inherently higher efficiency potential, improved energy density, and its capacity for greater scalability, making it increasingly attractive for larger-scale applications.
- Leading Region/Country: [Insert leading region/country here, e.g., China, Spain, or the United States], driven by [Specific reasons, e.g., strong government incentives for renewable energy adoption, high solar irradiance levels conducive to CSP, a well-developed and expanding CSP industry, and ambitious national decarbonization targets].
- Technology Segments:
- Parabolic Troughs: Expected to retain a significant market share in the near to medium term, benefiting from established manufacturing processes, economies of scale, and a well-understood operational profile.
- Fresnel Reflector: Presents moderate growth potential, often positioned as a cost-effective alternative for specific applications where high temperatures are not paramount.
- Power Tower: Forecasted to exhibit the fastest growth rate. This is due to its inherent advantages in achieving higher operational temperatures, leading to increased thermodynamic efficiency, and its superior potential for modularity and scalability to meet diverse energy demands.
- Key Drivers: A combination of robust government incentives and subsidies, forward-thinking and supportive energy policies aimed at decarbonization, and a consistent, accelerating trend in renewable energy capacity additions worldwide are the primary catalysts for market expansion.
Molten Salt Thermal Energy Storage Industry Product Landscape
The product landscape within the Molten Salt Thermal Energy Storage (MSTS) industry is characterized by a continuous and rapid pace of innovation. This evolution spans across critical areas such as advanced materials science for molten salt compositions, sophisticated system design methodologies, and intelligent control systems. MSTS products are increasingly being tailored to meet the specific and diverse demands of various applications, including utility-scale power generation, providing essential industrial process heat for manufacturing, and enabling sustainable district heating solutions. Key performance metrics that define the value proposition of these systems include their overall thermal efficiency, the attainable storage capacity, the system's cycle life for long-term reliability, and ultimately, their overall cost-effectiveness. Unique selling propositions (USPs) are increasingly focusing on demonstrating superior system reliability under challenging operational conditions, enabling extended long-term storage duration of thermal energy, and highlighting their significant positive environmental benefits and contributions to grid stability. Recent technological advancements have seen significant improvements in novel molten salt formulations offering enhanced thermal stability and reduced corrosion, the implementation of more advanced thermal management systems to optimize heat transfer and minimize losses, and the development of sophisticated intelligent control algorithms that enable real-time optimization and predictive maintenance.
Key Drivers, Barriers & Challenges in Molten Salt Thermal Energy Storage Industry
Key Drivers:
- Increasing demand for renewable energy storage to address intermittency issues.
- Government policies promoting renewable energy integration and grid stability.
- Technological advancements leading to improved efficiency and reduced costs.
- Growing concerns about climate change and the need for sustainable energy solutions.
Key Barriers and Challenges:
- High initial capital costs compared to other energy storage technologies.
- Potential material degradation and safety concerns related to molten salts.
- Limited availability of skilled labor and expertise.
- Complexity of system integration and maintenance. These challenges have resulted in a xx% reduction in expected market growth in specific regions.
Emerging Opportunities in Molten Salt Thermal Energy Storage Industry
A wealth of emerging opportunities is shaping the future of the MSTS industry. Beyond traditional power generation, significant potential lies in the expanded application of MSTS for delivering high-temperature industrial process heat across a wide array of sectors, which can displace fossil fuel consumption. Furthermore, the integration of MSTS with other renewable energy technologies, such as harnessing waste heat from geothermal energy systems or complementing intermittent solar PV, presents exciting synergistic possibilities. The development of more compact and modular, smaller-scale MSTS systems is opening doors for their deployment in distributed energy scenarios, catering to the needs of residential or commercial buildings. Untapped markets in developing economies, particularly those blessed with high solar irradiance and growing energy demands, represent a substantial frontier for MSTS adoption. Continued innovation in material science, focusing on salts with higher energy density and improved thermal properties, alongside advancements in system design for enhanced efficiency and reduced footprint, will be instrumental in unlocking novel applications and driving sustained market growth.
Growth Accelerators in the Molten Salt Thermal Energy Storage Industry Industry
Technological advancements, particularly in materials science and system design, are key growth accelerators. Strategic partnerships between technology providers, energy companies, and government agencies will facilitate wider adoption. Expansion into new markets and applications, coupled with ongoing cost reductions, will further propel market growth.
Key Players Shaping the Molten Salt Thermal Energy Storage Industry Market
- SCHOTT AG
- SolarReserve LLC
- Engie SA
- SENER Grupo de Ingenieria S A
- Acciona S A
- Abengoa SA
- Yara International ASA
- BrightSource Energy Inc
Notable Milestones in Molten Salt Thermal Energy Storage Industry Sector
- November 2022: Hyme Energy ApS partners with Bornholms Energi & Forsyning (BEOF) to build a 1 MW/20 MWh molten salt thermal energy storage demonstrator in Denmark (completion scheduled for 2024). This signifies a crucial step towards wider commercialization and showcases the growing interest in MSTS technology.
In-Depth Molten Salt Thermal Energy Storage Industry Market Outlook
The outlook for the Molten Salt Thermal Energy Storage (MSTS) market is exceptionally promising, pointing towards a future characterized by robust and sustained growth. This expansion will be primarily propelled by the relentless pace of technological advancements, the escalating global demand for reliable and dispatchable renewable energy sources, and the continued implementation of supportive and proactive government policies aimed at achieving ambitious decarbonization targets. Strategic opportunities abound for market players to capitalize on the burgeoning demand by expanding into new geographic territories with favorable solar resources, pioneering innovative applications that address specific energy challenges, and forging strong strategic partnerships to accelerate market penetration and technology deployment. The MSTS market is definitively poised for substantial expansion in the coming years, presenting significant potential for both established industry leaders and agile emerging players to thrive and contribute to a cleaner energy future.
Molten Salt Thermal Energy Storage Industry Segmentation
-
1. Technology
- 1.1. Parabolic Troughs
- 1.2. Fresnel Reflector
- 1.3. Power Tower
Molten Salt Thermal Energy Storage Industry Segmentation By Geography
- 1. North America
- 2. Asia Pacific
- 3. Europe
- 4. South America
- 5. Middle East and Africa
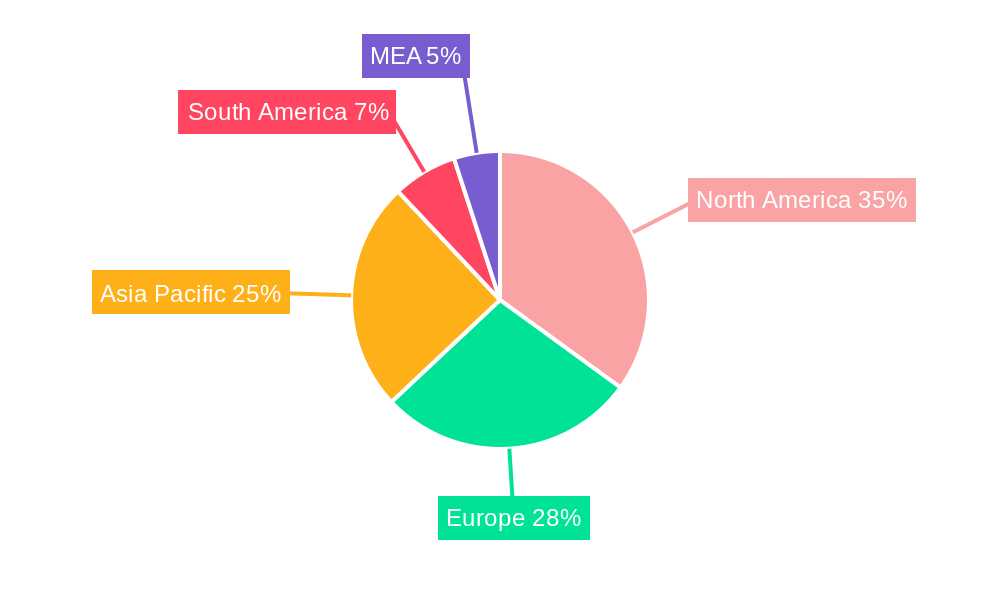
Molten Salt Thermal Energy Storage Industry Regional Market Share
Geographic Coverage of Molten Salt Thermal Energy Storage Industry
Molten Salt Thermal Energy Storage Industry REPORT HIGHLIGHTS
| Aspects | Details |
|---|---|
| Study Period | 2020-2034 |
| Base Year | 2025 |
| Estimated Year | 2026 |
| Forecast Period | 2026-2034 |
| Historical Period | 2020-2025 |
| Growth Rate | CAGR of 9.8% from 2020-2034 |
| Segmentation |
|
Table of Contents
- 1. Introduction
- 1.1. Research Scope
- 1.2. Market Segmentation
- 1.3. Research Objective
- 1.4. Definitions and Assumptions
- 2. Executive Summary
- 2.1. Market Snapshot
- 3. Market Dynamics
- 3.1. Market Drivers
- 3.2. Market Restrains
- 3.3. Market Trends
- 3.4. Market Opportunities
- 4. Market Factor Analysis
- 4.1. Porters Five Forces
- 4.1.1. Bargaining Power of Suppliers
- 4.1.2. Bargaining Power of Buyers
- 4.1.3. Threat of New Entrants
- 4.1.4. Threat of Substitutes
- 4.1.5. Competitive Rivalry
- 4.2. PESTEL analysis
- 4.3. BCG Analysis
- 4.3.1. Stars (High Growth, High Market Share)
- 4.3.2. Cash Cows (Low Growth, High Market Share)
- 4.3.3. Question Mark (High Growth, Low Market Share)
- 4.3.4. Dogs (Low Growth, Low Market Share)
- 4.4. Ansoff Matrix Analysis
- 4.5. Supply Chain Analysis
- 4.6. Regulatory Landscape
- 4.7. Current Market Potential and Opportunity Assessment (TAM–SAM–SOM Framework)
- 4.8. VDR Analyst Note
- 4.1. Porters Five Forces
- 5. Market Analysis, Insights and Forecast 2021-2033
- 5.1. Market Analysis, Insights and Forecast - by Technology
- 5.1.1. Parabolic Troughs
- 5.1.2. Fresnel Reflector
- 5.1.3. Power Tower
- 5.2. Market Analysis, Insights and Forecast - by Region
- 5.2.1. North America
- 5.2.2. Asia Pacific
- 5.2.3. Europe
- 5.2.4. South America
- 5.2.5. Middle East and Africa
- 5.1. Market Analysis, Insights and Forecast - by Technology
- 6. Global Molten Salt Thermal Energy Storage Industry Analysis, Insights and Forecast, 2021-2033
- 6.1. Market Analysis, Insights and Forecast - by Technology
- 6.1.1. Parabolic Troughs
- 6.1.2. Fresnel Reflector
- 6.1.3. Power Tower
- 6.1. Market Analysis, Insights and Forecast - by Technology
- 7. North America Molten Salt Thermal Energy Storage Industry Analysis, Insights and Forecast, 2021-2033
- 7.1. Market Analysis, Insights and Forecast - by Technology
- 7.1.1. Parabolic Troughs
- 7.1.2. Fresnel Reflector
- 7.1.3. Power Tower
- 7.1. Market Analysis, Insights and Forecast - by Technology
- 8. Asia Pacific Molten Salt Thermal Energy Storage Industry Analysis, Insights and Forecast, 2021-2033
- 8.1. Market Analysis, Insights and Forecast - by Technology
- 8.1.1. Parabolic Troughs
- 8.1.2. Fresnel Reflector
- 8.1.3. Power Tower
- 8.1. Market Analysis, Insights and Forecast - by Technology
- 9. Europe Molten Salt Thermal Energy Storage Industry Analysis, Insights and Forecast, 2021-2033
- 9.1. Market Analysis, Insights and Forecast - by Technology
- 9.1.1. Parabolic Troughs
- 9.1.2. Fresnel Reflector
- 9.1.3. Power Tower
- 9.1. Market Analysis, Insights and Forecast - by Technology
- 10. South America Molten Salt Thermal Energy Storage Industry Analysis, Insights and Forecast, 2021-2033
- 10.1. Market Analysis, Insights and Forecast - by Technology
- 10.1.1. Parabolic Troughs
- 10.1.2. Fresnel Reflector
- 10.1.3. Power Tower
- 10.1. Market Analysis, Insights and Forecast - by Technology
- 11. Middle East and Africa Molten Salt Thermal Energy Storage Industry Analysis, Insights and Forecast, 2021-2033
- 11.1. Market Analysis, Insights and Forecast - by Technology
- 11.1.1. Parabolic Troughs
- 11.1.2. Fresnel Reflector
- 11.1.3. Power Tower
- 11.1. Market Analysis, Insights and Forecast - by Technology
- 12. Competitive Analysis
- 12.1. Company Profiles
- 12.1.1 SCHOTT AG
- 12.1.1.1. Company Overview
- 12.1.1.2. Products
- 12.1.1.3. Company Financials
- 12.1.1.4. SWOT Analysis
- 12.1.2 SolarReserve LLC
- 12.1.2.1. Company Overview
- 12.1.2.2. Products
- 12.1.2.3. Company Financials
- 12.1.2.4. SWOT Analysis
- 12.1.3 Engie SA
- 12.1.3.1. Company Overview
- 12.1.3.2. Products
- 12.1.3.3. Company Financials
- 12.1.3.4. SWOT Analysis
- 12.1.4 SENER Grupo de Ingenieria S A
- 12.1.4.1. Company Overview
- 12.1.4.2. Products
- 12.1.4.3. Company Financials
- 12.1.4.4. SWOT Analysis
- 12.1.5 Acciona S A
- 12.1.5.1. Company Overview
- 12.1.5.2. Products
- 12.1.5.3. Company Financials
- 12.1.5.4. SWOT Analysis
- 12.1.6 Abengoa SA
- 12.1.6.1. Company Overview
- 12.1.6.2. Products
- 12.1.6.3. Company Financials
- 12.1.6.4. SWOT Analysis
- 12.1.7 Yara International ASA
- 12.1.7.1. Company Overview
- 12.1.7.2. Products
- 12.1.7.3. Company Financials
- 12.1.7.4. SWOT Analysis
- 12.1.8 BrightSource Energy Inc
- 12.1.8.1. Company Overview
- 12.1.8.2. Products
- 12.1.8.3. Company Financials
- 12.1.8.4. SWOT Analysis
- 12.1.1 SCHOTT AG
- 12.2. Market Entropy
- 12.2.1 Company's Key Areas Served
- 12.2.2 Recent Developments
- 12.3. Company Market Share Analysis 2025
- 12.3.1 Top 5 Companies Market Share Analysis
- 12.3.2 Top 3 Companies Market Share Analysis
- 12.4. List of Potential Customers
- 13. Research Methodology
List of Figures
- Figure 1: Global Molten Salt Thermal Energy Storage Industry Revenue Breakdown (billion, %) by Region 2025 & 2033
- Figure 2: North America Molten Salt Thermal Energy Storage Industry Revenue (billion), by Technology 2025 & 2033
- Figure 3: North America Molten Salt Thermal Energy Storage Industry Revenue Share (%), by Technology 2025 & 2033
- Figure 4: North America Molten Salt Thermal Energy Storage Industry Revenue (billion), by Country 2025 & 2033
- Figure 5: North America Molten Salt Thermal Energy Storage Industry Revenue Share (%), by Country 2025 & 2033
- Figure 6: Asia Pacific Molten Salt Thermal Energy Storage Industry Revenue (billion), by Technology 2025 & 2033
- Figure 7: Asia Pacific Molten Salt Thermal Energy Storage Industry Revenue Share (%), by Technology 2025 & 2033
- Figure 8: Asia Pacific Molten Salt Thermal Energy Storage Industry Revenue (billion), by Country 2025 & 2033
- Figure 9: Asia Pacific Molten Salt Thermal Energy Storage Industry Revenue Share (%), by Country 2025 & 2033
- Figure 10: Europe Molten Salt Thermal Energy Storage Industry Revenue (billion), by Technology 2025 & 2033
- Figure 11: Europe Molten Salt Thermal Energy Storage Industry Revenue Share (%), by Technology 2025 & 2033
- Figure 12: Europe Molten Salt Thermal Energy Storage Industry Revenue (billion), by Country 2025 & 2033
- Figure 13: Europe Molten Salt Thermal Energy Storage Industry Revenue Share (%), by Country 2025 & 2033
- Figure 14: South America Molten Salt Thermal Energy Storage Industry Revenue (billion), by Technology 2025 & 2033
- Figure 15: South America Molten Salt Thermal Energy Storage Industry Revenue Share (%), by Technology 2025 & 2033
- Figure 16: South America Molten Salt Thermal Energy Storage Industry Revenue (billion), by Country 2025 & 2033
- Figure 17: South America Molten Salt Thermal Energy Storage Industry Revenue Share (%), by Country 2025 & 2033
- Figure 18: Middle East and Africa Molten Salt Thermal Energy Storage Industry Revenue (billion), by Technology 2025 & 2033
- Figure 19: Middle East and Africa Molten Salt Thermal Energy Storage Industry Revenue Share (%), by Technology 2025 & 2033
- Figure 20: Middle East and Africa Molten Salt Thermal Energy Storage Industry Revenue (billion), by Country 2025 & 2033
- Figure 21: Middle East and Africa Molten Salt Thermal Energy Storage Industry Revenue Share (%), by Country 2025 & 2033
List of Tables
- Table 1: Global Molten Salt Thermal Energy Storage Industry Revenue billion Forecast, by Technology 2020 & 2033
- Table 2: Global Molten Salt Thermal Energy Storage Industry Revenue billion Forecast, by Region 2020 & 2033
- Table 3: Global Molten Salt Thermal Energy Storage Industry Revenue billion Forecast, by Technology 2020 & 2033
- Table 4: Global Molten Salt Thermal Energy Storage Industry Revenue billion Forecast, by Country 2020 & 2033
- Table 5: Global Molten Salt Thermal Energy Storage Industry Revenue billion Forecast, by Technology 2020 & 2033
- Table 6: Global Molten Salt Thermal Energy Storage Industry Revenue billion Forecast, by Country 2020 & 2033
- Table 7: Global Molten Salt Thermal Energy Storage Industry Revenue billion Forecast, by Technology 2020 & 2033
- Table 8: Global Molten Salt Thermal Energy Storage Industry Revenue billion Forecast, by Country 2020 & 2033
- Table 9: Global Molten Salt Thermal Energy Storage Industry Revenue billion Forecast, by Technology 2020 & 2033
- Table 10: Global Molten Salt Thermal Energy Storage Industry Revenue billion Forecast, by Country 2020 & 2033
- Table 11: Global Molten Salt Thermal Energy Storage Industry Revenue billion Forecast, by Technology 2020 & 2033
- Table 12: Global Molten Salt Thermal Energy Storage Industry Revenue billion Forecast, by Country 2020 & 2033
Frequently Asked Questions
1. What is the projected Compound Annual Growth Rate (CAGR) of the Molten Salt Thermal Energy Storage Industry?
The projected CAGR is approximately 9.8%.
2. Which companies are prominent players in the Molten Salt Thermal Energy Storage Industry?
Key companies in the market include SCHOTT AG, SolarReserve LLC, Engie SA, SENER Grupo de Ingenieria S A, Acciona S A, Abengoa SA, Yara International ASA, BrightSource Energy Inc.
3. What are the main segments of the Molten Salt Thermal Energy Storage Industry?
The market segments include Technology.
4. Can you provide details about the market size?
The market size is estimated to be USD 2.22 billion as of 2022.
5. What are some drivers contributing to market growth?
4.; Increasing Investments in Offshore Wind Power Projects4.; Supportive Government Policies.
6. What are the notable trends driving market growth?
Parabolic Trough Segment to Dominate the Market.
7. Are there any restraints impacting market growth?
4.; Increasing Adopting of Alternative Clean Energy Sources (Ex: Solar. Hydro).
8. Can you provide examples of recent developments in the market?
November 2022: Hyme Energy ApS announced that the company is partnering with Bornholms Energi & Forsyning (BEOF) to build its first molten salt thermal energy storage demonstrator on the Danish island of Bornholm. The storage facility is scheduled for completion in 2024 and will have a capacity of 1 MW/20 MWh. It will provide heat, power, and ancillary services to the local network.
9. What pricing options are available for accessing the report?
Pricing options include single-user, multi-user, and enterprise licenses priced at USD 4750, USD 5250, and USD 8750 respectively.
10. Is the market size provided in terms of value or volume?
The market size is provided in terms of value, measured in billion.
11. Are there any specific market keywords associated with the report?
Yes, the market keyword associated with the report is "Molten Salt Thermal Energy Storage Industry," which aids in identifying and referencing the specific market segment covered.
12. How do I determine which pricing option suits my needs best?
The pricing options vary based on user requirements and access needs. Individual users may opt for single-user licenses, while businesses requiring broader access may choose multi-user or enterprise licenses for cost-effective access to the report.
13. Are there any additional resources or data provided in the Molten Salt Thermal Energy Storage Industry report?
While the report offers comprehensive insights, it's advisable to review the specific contents or supplementary materials provided to ascertain if additional resources or data are available.
14. How can I stay updated on further developments or reports in the Molten Salt Thermal Energy Storage Industry?
To stay informed about further developments, trends, and reports in the Molten Salt Thermal Energy Storage Industry, consider subscribing to industry newsletters, following relevant companies and organizations, or regularly checking reputable industry news sources and publications.
Methodology
Step 1 - Identification of Relevant Samples Size from Population Database


Step 2 - Approaches for Defining Global Market Size (Value, Volume* & Price*)

Note*: In applicable scenarios
Step 3 - Data Sources
Primary Research
- Web Analytics
- Survey Reports
- Research Institute
- Latest Research Reports
- Opinion Leaders
Secondary Research
- Annual Reports
- White Paper
- Latest Press Release
- Industry Association
- Paid Database
- Investor Presentations

Step 4 - Data Triangulation
Involves using different sources of information in order to increase the validity of a study
These sources are likely to be stakeholders in a program - participants, other researchers, program staff, other community members, and so on.
Then we put all data in single framework & apply various statistical tools to find out the dynamic on the market.
During the analysis stage, feedback from the stakeholder groups would be compared to determine areas of agreement as well as areas of divergence