
Key Insights
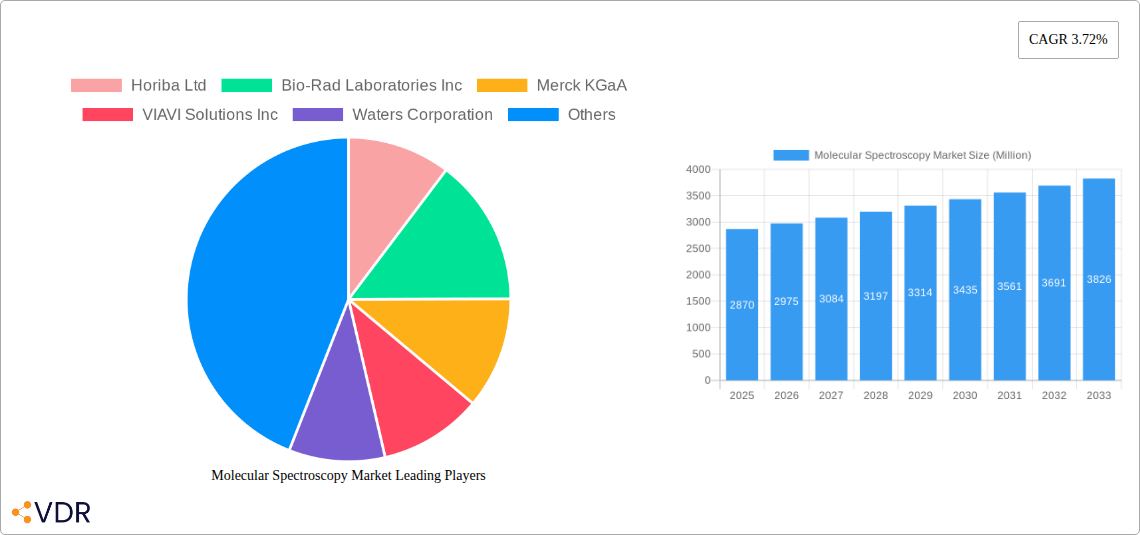
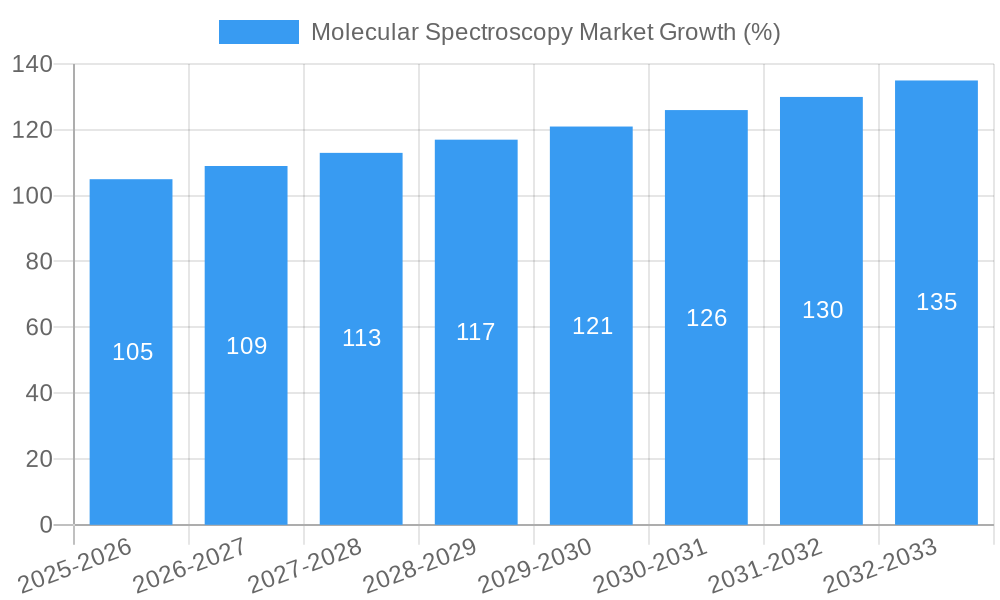
The global molecular spectroscopy market, valued at $2.87 billion in 2025, is projected to experience robust growth, driven by increasing demand across diverse sectors. A compound annual growth rate (CAGR) of 3.72% from 2025 to 2033 indicates a significant expansion in market size. This growth is fueled by several key factors. Firstly, the pharmaceutical and biotechnology industries heavily rely on molecular spectroscopy for drug discovery, development, and quality control, creating consistent demand. Secondly, advancements in spectroscopy technologies, such as the development of miniaturized and portable devices, are lowering costs and expanding accessibility, driving market penetration. Furthermore, stringent regulatory requirements for food and beverage safety and environmental monitoring are boosting the adoption of spectroscopic techniques for quality assurance and contaminant detection. The increasing focus on academic research and development in related fields also contributes to market expansion. Specific applications like NMR and Raman spectroscopy are witnessing high growth due to their versatility and ability to provide detailed molecular information.
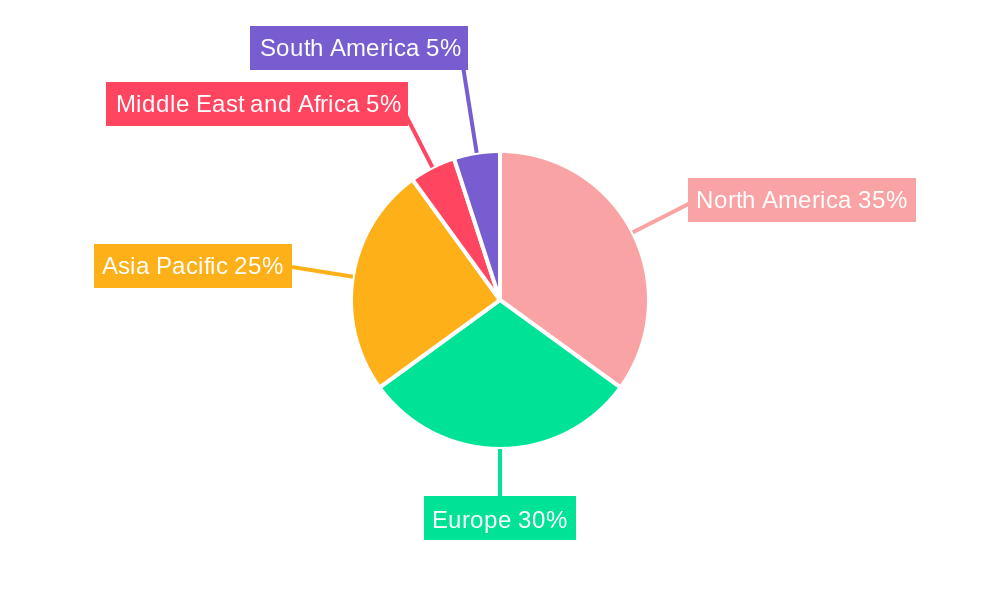
However, certain market restraints exist. The high initial investment required for advanced spectroscopy equipment can be a barrier for smaller enterprises. Moreover, the complexity of data analysis and interpretation demands skilled personnel, limiting the widespread adoption of these techniques in certain regions. Despite these challenges, the continued innovation in technology, coupled with rising demand across various sectors, positions the molecular spectroscopy market for sustained growth in the forecast period. The geographic distribution of the market is expected to be diverse, with North America and Europe maintaining a significant market share due to established research infrastructure and advanced healthcare systems, while Asia-Pacific is projected to witness the fastest growth, driven by rising investments in research and development, particularly in emerging economies like China and India.
Molecular Spectroscopy Market: A Comprehensive Report (2019-2033)
This comprehensive report provides an in-depth analysis of the Molecular Spectroscopy Market, encompassing market dynamics, growth trends, regional analysis, product landscape, key players, and future outlook. The study period covers 2019-2033, with 2025 as the base and estimated year. The report segments the market by type of spectroscopy (NMR, Raman, UV-Visible, Mass, Infrared, Near-Infrared, and Others) and application (Pharmaceutical, Food & Beverage, Biotechnology & Biopharmaceuticals, Environmental, Academic Research, and Others). The parent market is the analytical instrumentation market, and the child market is the spectroscopy market. The total market value in 2025 is estimated at $XX Million, projected to reach $YY Million by 2033, exhibiting a CAGR of Z%.
Molecular Spectroscopy Market Dynamics & Structure
The Molecular Spectroscopy market is characterized by moderate concentration, with key players holding significant market share. Technological innovation, particularly in miniaturization, enhanced sensitivity, and automation, are primary growth drivers. Stringent regulatory frameworks governing analytical techniques in various industries influence market adoption. The market faces competition from alternative analytical methods, but the inherent advantages of molecular spectroscopy, such as specificity and versatility, ensure its continued relevance. Mergers and acquisitions (M&A) activity is moderate, primarily focused on expanding product portfolios and geographic reach.
- Market Concentration: Moderately concentrated, with the top 5 players holding approximately XX% of the market share in 2025.
- Technological Innovation: Focus on higher throughput, improved sensitivity, and user-friendly interfaces.
- Regulatory Landscape: Stringent regulations in pharmaceutical and environmental testing drive demand for validated instruments.
- Competitive Substitutes: Chromatography and other analytical techniques pose competitive pressure.
- M&A Activity: Moderate level of M&A activity, with an average of XX deals annually during the historical period (2019-2024).
- Innovation Barriers: High R&D costs and complex regulatory approvals hinder faster innovation.
Molecular Spectroscopy Market Growth Trends & Insights
The Molecular Spectroscopy market witnessed steady growth during the historical period (2019-2024), driven by increasing demand across various application areas. The pharmaceutical and biotechnology sectors are major contributors, fueled by drug discovery, development, and quality control needs. Food and beverage testing also contributes significantly, driven by safety and quality regulations. Technological advancements, such as the development of portable and handheld spectrometers, are expanding market accessibility. Shifting consumer preferences toward healthier and safer products are indirectly boosting market growth.
- Market Size Evolution: Market size increased from $XX Million in 2019 to an estimated $XX Million in 2025.
- Adoption Rates: Adoption is highest in pharmaceutical and biotechnology sectors, followed by food & beverage and environmental testing.
- Technological Disruptions: Miniaturization, improved sensitivity, and automation are key disruptive technologies.
- Consumer Behavior Shifts: Growing demand for safe and high-quality products drives adoption across diverse sectors.
Dominant Regions, Countries, or Segments in Molecular Spectroscopy Market
North America currently holds the largest market share, driven by strong research investment and robust regulatory frameworks. Europe follows closely, with a significant presence in pharmaceutical and biotechnology industries. Asia-Pacific is witnessing the fastest growth, fueled by increasing healthcare expenditure and industrial development. Within spectroscopy types, the demand for Mass Spectroscopy and Raman Spectroscopy is relatively high due to their versatility and wide range of applications. Pharmaceutical applications constitute the largest segment by application.
- Leading Region: North America, driven by strong R&D spending and established regulatory frameworks.
- Key Drivers (North America): High adoption rates in pharmaceutical and biotechnology, coupled with advanced research infrastructure.
- Key Drivers (Europe): Strong presence of pharmaceutical and biotechnology companies, coupled with stringent regulatory standards.
- Key Drivers (Asia-Pacific): Rapid economic growth, increasing healthcare expenditure, and rising awareness of quality control measures.
- Dominant Spectroscopy Type: Mass Spectroscopy and Raman Spectroscopy due to their versatile applications.
- Dominant Application: Pharmaceutical Applications, due to stringent quality control and regulatory requirements.
Molecular Spectroscopy Market Product Landscape
Recent innovations focus on improving sensitivity, portability, and ease of use. Miniaturized spectrometers are gaining popularity, offering enhanced flexibility and reducing operational costs. Advanced software and data analysis tools enhance experimental workflow efficiency and data interpretation. Unique selling propositions revolve around improved signal-to-noise ratios, faster analysis times, and user-friendly interfaces. Key technological advancements include the integration of artificial intelligence for automated data analysis.
Key Drivers, Barriers & Challenges in Molecular Spectroscopy Market
Key Drivers:
- Increasing demand for quality control and safety testing in various industries.
- Technological advancements leading to improved instrument performance and reduced costs.
- Stringent regulatory compliance requirements driving adoption.
Key Barriers & Challenges:
- High initial investment costs associated with purchasing sophisticated instruments.
- Need for skilled personnel to operate and interpret the data.
- Competition from alternative analytical techniques. This leads to approximately a XX% reduction in market growth annually.
Emerging Opportunities in Molecular Spectroscopy Market
- Expansion into emerging economies with growing healthcare and industrial sectors.
- Development of novel applications in fields such as environmental monitoring and food safety.
- Integration of spectroscopy with other analytical techniques for comprehensive analysis.
Growth Accelerators in the Molecular Spectroscopy Market Industry
Technological breakthroughs, especially in miniaturization, automation, and AI integration, are significant growth catalysts. Strategic partnerships between instrument manufacturers and end-users foster innovation and market penetration. Expansion into untapped markets, such as point-of-care diagnostics, presents significant opportunities for long-term growth.
Key Players Shaping the Molecular Spectroscopy Market Market
- Horiba Ltd
- Bio-Rad Laboratories Inc
- Merck KGaA
- VIAVI Solutions Inc
- Waters Corporation
- Danaher Corporation
- Agilent Technologies Inc
- Thermo Fischer Scientific Inc
- Jeol Ltd
- Keit Ltd
- PerkinElmer Inc
- Thorlabs Inc
- Bruker Corporation
- Shimadzu Corporation
Notable Milestones in Molecular Spectroscopy Market Sector
- 2020: Launch of a new generation of portable Raman spectrometer by Horiba Ltd.
- 2021: Acquisition of a smaller spectroscopy company by Thermo Fisher Scientific Inc., expanding their product portfolio.
- 2022: Introduction of AI-powered data analysis software by Agilent Technologies Inc.
- 2023: Significant investment in R&D by Bruker Corporation to enhance sensitivity and throughput.
- 2024: Strategic partnership between Waters Corporation and a biotechnology firm for joint development of new applications.
In-Depth Molecular Spectroscopy Market Market Outlook
The Molecular Spectroscopy market is poised for continued growth, driven by technological advancements, increasing demand across various applications, and expansion into new markets. Strategic partnerships, acquisitions, and investments in R&D will shape the competitive landscape. The long-term outlook remains positive, with substantial growth potential in emerging economies and innovative applications.
Molecular Spectroscopy Market Segmentation
-
1. Type of Spectroscopy
- 1.1. NMR Spectroscopy
- 1.2. Raman Spectroscopy
- 1.3. UV-visible Spectroscopy
- 1.4. Mass Spectroscopy
- 1.5. Infrared Spectroscopy
- 1.6. Near-infrared Spectroscopy
- 1.7. Other Types of Spectroscopy
-
2. Application
- 2.1. Pharmaceutical Applications
- 2.2. Food and Beverage Testing
- 2.3. Biotechnology and Biopharmaceutical Applications
- 2.4. Environmental Testing
- 2.5. Academic Research
- 2.6. Other Applications
Molecular Spectroscopy Market Segmentation By Geography
-
1. North America
- 1.1. United States
- 1.2. Canada
- 1.3. Mexico
-
2. Europe
- 2.1. Germany
- 2.2. United Kingdom
- 2.3. France
- 2.4. Italy
- 2.5. Spain
- 2.6. Rest of Europe
-
3. Asia Pacific
- 3.1. China
- 3.2. Japan
- 3.3. India
- 3.4. Australia
- 3.5. South Korea
- 3.6. Rest of Asia Pacific
-
4. Middle East and Africa
- 4.1. GCC
- 4.2. South Africa
- 4.3. Rest of Middle East and Africa
-
5. South America
- 5.1. Brazil
- 5.2. Argentina
- 5.3. Rest of South America
Molecular Spectroscopy Market REPORT HIGHLIGHTS
| Aspects | Details |
|---|---|
| Study Period | 2019-2033 |
| Base Year | 2024 |
| Estimated Year | 2025 |
| Forecast Period | 2025-2033 |
| Historical Period | 2019-2024 |
| Growth Rate | CAGR of 3.72% from 2019-2033 |
| Segmentation |
|
Table of Contents
- 1. Introduction
- 1.1. Research Scope
- 1.2. Market Segmentation
- 1.3. Research Methodology
- 1.4. Definitions and Assumptions
- 2. Executive Summary
- 2.1. Introduction
- 3. Market Dynamics
- 3.1. Introduction
- 3.2. Market Drivers
- 3.2.1. Rapid Adoption in the Pharmaceutical Industry; Penetration of MS Technology in Various Verticals; Increased Emphasis for Discovery of Newer Molecules by Pharmaceuticals
- 3.3. Market Restrains
- 3.3.1. High Cost of Maintenance and Installation Charges; Need of Technically Skilled Personnel
- 3.4. Market Trends
- 3.4.1. The NMR Spectroscopy Segment is Expected to Observe Good Growth Over the Forecast Period
- 4. Market Factor Analysis
- 4.1. Porters Five Forces
- 4.2. Supply/Value Chain
- 4.3. PESTEL analysis
- 4.4. Market Entropy
- 4.5. Patent/Trademark Analysis
- 5. Global Molecular Spectroscopy Market Analysis, Insights and Forecast, 2019-2031
- 5.1. Market Analysis, Insights and Forecast - by Type of Spectroscopy
- 5.1.1. NMR Spectroscopy
- 5.1.2. Raman Spectroscopy
- 5.1.3. UV-visible Spectroscopy
- 5.1.4. Mass Spectroscopy
- 5.1.5. Infrared Spectroscopy
- 5.1.6. Near-infrared Spectroscopy
- 5.1.7. Other Types of Spectroscopy
- 5.2. Market Analysis, Insights and Forecast - by Application
- 5.2.1. Pharmaceutical Applications
- 5.2.2. Food and Beverage Testing
- 5.2.3. Biotechnology and Biopharmaceutical Applications
- 5.2.4. Environmental Testing
- 5.2.5. Academic Research
- 5.2.6. Other Applications
- 5.3. Market Analysis, Insights and Forecast - by Region
- 5.3.1. North America
- 5.3.2. Europe
- 5.3.3. Asia Pacific
- 5.3.4. Middle East and Africa
- 5.3.5. South America
- 5.1. Market Analysis, Insights and Forecast - by Type of Spectroscopy
- 6. North America Molecular Spectroscopy Market Analysis, Insights and Forecast, 2019-2031
- 6.1. Market Analysis, Insights and Forecast - by Type of Spectroscopy
- 6.1.1. NMR Spectroscopy
- 6.1.2. Raman Spectroscopy
- 6.1.3. UV-visible Spectroscopy
- 6.1.4. Mass Spectroscopy
- 6.1.5. Infrared Spectroscopy
- 6.1.6. Near-infrared Spectroscopy
- 6.1.7. Other Types of Spectroscopy
- 6.2. Market Analysis, Insights and Forecast - by Application
- 6.2.1. Pharmaceutical Applications
- 6.2.2. Food and Beverage Testing
- 6.2.3. Biotechnology and Biopharmaceutical Applications
- 6.2.4. Environmental Testing
- 6.2.5. Academic Research
- 6.2.6. Other Applications
- 6.1. Market Analysis, Insights and Forecast - by Type of Spectroscopy
- 7. Europe Molecular Spectroscopy Market Analysis, Insights and Forecast, 2019-2031
- 7.1. Market Analysis, Insights and Forecast - by Type of Spectroscopy
- 7.1.1. NMR Spectroscopy
- 7.1.2. Raman Spectroscopy
- 7.1.3. UV-visible Spectroscopy
- 7.1.4. Mass Spectroscopy
- 7.1.5. Infrared Spectroscopy
- 7.1.6. Near-infrared Spectroscopy
- 7.1.7. Other Types of Spectroscopy
- 7.2. Market Analysis, Insights and Forecast - by Application
- 7.2.1. Pharmaceutical Applications
- 7.2.2. Food and Beverage Testing
- 7.2.3. Biotechnology and Biopharmaceutical Applications
- 7.2.4. Environmental Testing
- 7.2.5. Academic Research
- 7.2.6. Other Applications
- 7.1. Market Analysis, Insights and Forecast - by Type of Spectroscopy
- 8. Asia Pacific Molecular Spectroscopy Market Analysis, Insights and Forecast, 2019-2031
- 8.1. Market Analysis, Insights and Forecast - by Type of Spectroscopy
- 8.1.1. NMR Spectroscopy
- 8.1.2. Raman Spectroscopy
- 8.1.3. UV-visible Spectroscopy
- 8.1.4. Mass Spectroscopy
- 8.1.5. Infrared Spectroscopy
- 8.1.6. Near-infrared Spectroscopy
- 8.1.7. Other Types of Spectroscopy
- 8.2. Market Analysis, Insights and Forecast - by Application
- 8.2.1. Pharmaceutical Applications
- 8.2.2. Food and Beverage Testing
- 8.2.3. Biotechnology and Biopharmaceutical Applications
- 8.2.4. Environmental Testing
- 8.2.5. Academic Research
- 8.2.6. Other Applications
- 8.1. Market Analysis, Insights and Forecast - by Type of Spectroscopy
- 9. Middle East and Africa Molecular Spectroscopy Market Analysis, Insights and Forecast, 2019-2031
- 9.1. Market Analysis, Insights and Forecast - by Type of Spectroscopy
- 9.1.1. NMR Spectroscopy
- 9.1.2. Raman Spectroscopy
- 9.1.3. UV-visible Spectroscopy
- 9.1.4. Mass Spectroscopy
- 9.1.5. Infrared Spectroscopy
- 9.1.6. Near-infrared Spectroscopy
- 9.1.7. Other Types of Spectroscopy
- 9.2. Market Analysis, Insights and Forecast - by Application
- 9.2.1. Pharmaceutical Applications
- 9.2.2. Food and Beverage Testing
- 9.2.3. Biotechnology and Biopharmaceutical Applications
- 9.2.4. Environmental Testing
- 9.2.5. Academic Research
- 9.2.6. Other Applications
- 9.1. Market Analysis, Insights and Forecast - by Type of Spectroscopy
- 10. South America Molecular Spectroscopy Market Analysis, Insights and Forecast, 2019-2031
- 10.1. Market Analysis, Insights and Forecast - by Type of Spectroscopy
- 10.1.1. NMR Spectroscopy
- 10.1.2. Raman Spectroscopy
- 10.1.3. UV-visible Spectroscopy
- 10.1.4. Mass Spectroscopy
- 10.1.5. Infrared Spectroscopy
- 10.1.6. Near-infrared Spectroscopy
- 10.1.7. Other Types of Spectroscopy
- 10.2. Market Analysis, Insights and Forecast - by Application
- 10.2.1. Pharmaceutical Applications
- 10.2.2. Food and Beverage Testing
- 10.2.3. Biotechnology and Biopharmaceutical Applications
- 10.2.4. Environmental Testing
- 10.2.5. Academic Research
- 10.2.6. Other Applications
- 10.1. Market Analysis, Insights and Forecast - by Type of Spectroscopy
- 11. North America Molecular Spectroscopy Market Analysis, Insights and Forecast, 2019-2031
- 11.1. Market Analysis, Insights and Forecast - By Country/Sub-region
- 11.1.1 United States
- 11.1.2 Canada
- 11.1.3 Mexico
- 12. Europe Molecular Spectroscopy Market Analysis, Insights and Forecast, 2019-2031
- 12.1. Market Analysis, Insights and Forecast - By Country/Sub-region
- 12.1.1 Germany
- 12.1.2 United Kingdom
- 12.1.3 France
- 12.1.4 Italy
- 12.1.5 Spain
- 12.1.6 Rest of Europe
- 13. Asia Pacific Molecular Spectroscopy Market Analysis, Insights and Forecast, 2019-2031
- 13.1. Market Analysis, Insights and Forecast - By Country/Sub-region
- 13.1.1 China
- 13.1.2 Japan
- 13.1.3 India
- 13.1.4 Australia
- 13.1.5 South Korea
- 13.1.6 Rest of Asia Pacific
- 14. Middle East and Africa Molecular Spectroscopy Market Analysis, Insights and Forecast, 2019-2031
- 14.1. Market Analysis, Insights and Forecast - By Country/Sub-region
- 14.1.1 GCC
- 14.1.2 South Africa
- 14.1.3 Rest of Middle East and Africa
- 15. South America Molecular Spectroscopy Market Analysis, Insights and Forecast, 2019-2031
- 15.1. Market Analysis, Insights and Forecast - By Country/Sub-region
- 15.1.1 Brazil
- 15.1.2 Argentina
- 15.1.3 Rest of South America
- 16. Competitive Analysis
- 16.1. Global Market Share Analysis 2024
- 16.2. Company Profiles
- 16.2.1 Horiba Ltd
- 16.2.1.1. Overview
- 16.2.1.2. Products
- 16.2.1.3. SWOT Analysis
- 16.2.1.4. Recent Developments
- 16.2.1.5. Financials (Based on Availability)
- 16.2.2 Bio-Rad Laboratories Inc
- 16.2.2.1. Overview
- 16.2.2.2. Products
- 16.2.2.3. SWOT Analysis
- 16.2.2.4. Recent Developments
- 16.2.2.5. Financials (Based on Availability)
- 16.2.3 Merck KGaA
- 16.2.3.1. Overview
- 16.2.3.2. Products
- 16.2.3.3. SWOT Analysis
- 16.2.3.4. Recent Developments
- 16.2.3.5. Financials (Based on Availability)
- 16.2.4 VIAVI Solutions Inc
- 16.2.4.1. Overview
- 16.2.4.2. Products
- 16.2.4.3. SWOT Analysis
- 16.2.4.4. Recent Developments
- 16.2.4.5. Financials (Based on Availability)
- 16.2.5 Waters Corporation
- 16.2.5.1. Overview
- 16.2.5.2. Products
- 16.2.5.3. SWOT Analysis
- 16.2.5.4. Recent Developments
- 16.2.5.5. Financials (Based on Availability)
- 16.2.6 Danaher Corporation
- 16.2.6.1. Overview
- 16.2.6.2. Products
- 16.2.6.3. SWOT Analysis
- 16.2.6.4. Recent Developments
- 16.2.6.5. Financials (Based on Availability)
- 16.2.7 Agilent Technologies Inc
- 16.2.7.1. Overview
- 16.2.7.2. Products
- 16.2.7.3. SWOT Analysis
- 16.2.7.4. Recent Developments
- 16.2.7.5. Financials (Based on Availability)
- 16.2.8 Thermo Fischer Scientific Inc
- 16.2.8.1. Overview
- 16.2.8.2. Products
- 16.2.8.3. SWOT Analysis
- 16.2.8.4. Recent Developments
- 16.2.8.5. Financials (Based on Availability)
- 16.2.9 Jeol Ltd
- 16.2.9.1. Overview
- 16.2.9.2. Products
- 16.2.9.3. SWOT Analysis
- 16.2.9.4. Recent Developments
- 16.2.9.5. Financials (Based on Availability)
- 16.2.10 Keit Ltd
- 16.2.10.1. Overview
- 16.2.10.2. Products
- 16.2.10.3. SWOT Analysis
- 16.2.10.4. Recent Developments
- 16.2.10.5. Financials (Based on Availability)
- 16.2.11 PerkinElmer Inc
- 16.2.11.1. Overview
- 16.2.11.2. Products
- 16.2.11.3. SWOT Analysis
- 16.2.11.4. Recent Developments
- 16.2.11.5. Financials (Based on Availability)
- 16.2.12 Thorlabs Inc
- 16.2.12.1. Overview
- 16.2.12.2. Products
- 16.2.12.3. SWOT Analysis
- 16.2.12.4. Recent Developments
- 16.2.12.5. Financials (Based on Availability)
- 16.2.13 Bruker Corporation
- 16.2.13.1. Overview
- 16.2.13.2. Products
- 16.2.13.3. SWOT Analysis
- 16.2.13.4. Recent Developments
- 16.2.13.5. Financials (Based on Availability)
- 16.2.14 Shimadzu Corporation
- 16.2.14.1. Overview
- 16.2.14.2. Products
- 16.2.14.3. SWOT Analysis
- 16.2.14.4. Recent Developments
- 16.2.14.5. Financials (Based on Availability)
- 16.2.1 Horiba Ltd
List of Figures
- Figure 1: Global Molecular Spectroscopy Market Revenue Breakdown (Million, %) by Region 2024 & 2032
- Figure 2: Global Molecular Spectroscopy Market Volume Breakdown (K Unit, %) by Region 2024 & 2032
- Figure 3: North America Molecular Spectroscopy Market Revenue (Million), by Country 2024 & 2032
- Figure 4: North America Molecular Spectroscopy Market Volume (K Unit), by Country 2024 & 2032
- Figure 5: North America Molecular Spectroscopy Market Revenue Share (%), by Country 2024 & 2032
- Figure 6: North America Molecular Spectroscopy Market Volume Share (%), by Country 2024 & 2032
- Figure 7: Europe Molecular Spectroscopy Market Revenue (Million), by Country 2024 & 2032
- Figure 8: Europe Molecular Spectroscopy Market Volume (K Unit), by Country 2024 & 2032
- Figure 9: Europe Molecular Spectroscopy Market Revenue Share (%), by Country 2024 & 2032
- Figure 10: Europe Molecular Spectroscopy Market Volume Share (%), by Country 2024 & 2032
- Figure 11: Asia Pacific Molecular Spectroscopy Market Revenue (Million), by Country 2024 & 2032
- Figure 12: Asia Pacific Molecular Spectroscopy Market Volume (K Unit), by Country 2024 & 2032
- Figure 13: Asia Pacific Molecular Spectroscopy Market Revenue Share (%), by Country 2024 & 2032
- Figure 14: Asia Pacific Molecular Spectroscopy Market Volume Share (%), by Country 2024 & 2032
- Figure 15: Middle East and Africa Molecular Spectroscopy Market Revenue (Million), by Country 2024 & 2032
- Figure 16: Middle East and Africa Molecular Spectroscopy Market Volume (K Unit), by Country 2024 & 2032
- Figure 17: Middle East and Africa Molecular Spectroscopy Market Revenue Share (%), by Country 2024 & 2032
- Figure 18: Middle East and Africa Molecular Spectroscopy Market Volume Share (%), by Country 2024 & 2032
- Figure 19: South America Molecular Spectroscopy Market Revenue (Million), by Country 2024 & 2032
- Figure 20: South America Molecular Spectroscopy Market Volume (K Unit), by Country 2024 & 2032
- Figure 21: South America Molecular Spectroscopy Market Revenue Share (%), by Country 2024 & 2032
- Figure 22: South America Molecular Spectroscopy Market Volume Share (%), by Country 2024 & 2032
- Figure 23: North America Molecular Spectroscopy Market Revenue (Million), by Type of Spectroscopy 2024 & 2032
- Figure 24: North America Molecular Spectroscopy Market Volume (K Unit), by Type of Spectroscopy 2024 & 2032
- Figure 25: North America Molecular Spectroscopy Market Revenue Share (%), by Type of Spectroscopy 2024 & 2032
- Figure 26: North America Molecular Spectroscopy Market Volume Share (%), by Type of Spectroscopy 2024 & 2032
- Figure 27: North America Molecular Spectroscopy Market Revenue (Million), by Application 2024 & 2032
- Figure 28: North America Molecular Spectroscopy Market Volume (K Unit), by Application 2024 & 2032
- Figure 29: North America Molecular Spectroscopy Market Revenue Share (%), by Application 2024 & 2032
- Figure 30: North America Molecular Spectroscopy Market Volume Share (%), by Application 2024 & 2032
- Figure 31: North America Molecular Spectroscopy Market Revenue (Million), by Country 2024 & 2032
- Figure 32: North America Molecular Spectroscopy Market Volume (K Unit), by Country 2024 & 2032
- Figure 33: North America Molecular Spectroscopy Market Revenue Share (%), by Country 2024 & 2032
- Figure 34: North America Molecular Spectroscopy Market Volume Share (%), by Country 2024 & 2032
- Figure 35: Europe Molecular Spectroscopy Market Revenue (Million), by Type of Spectroscopy 2024 & 2032
- Figure 36: Europe Molecular Spectroscopy Market Volume (K Unit), by Type of Spectroscopy 2024 & 2032
- Figure 37: Europe Molecular Spectroscopy Market Revenue Share (%), by Type of Spectroscopy 2024 & 2032
- Figure 38: Europe Molecular Spectroscopy Market Volume Share (%), by Type of Spectroscopy 2024 & 2032
- Figure 39: Europe Molecular Spectroscopy Market Revenue (Million), by Application 2024 & 2032
- Figure 40: Europe Molecular Spectroscopy Market Volume (K Unit), by Application 2024 & 2032
- Figure 41: Europe Molecular Spectroscopy Market Revenue Share (%), by Application 2024 & 2032
- Figure 42: Europe Molecular Spectroscopy Market Volume Share (%), by Application 2024 & 2032
- Figure 43: Europe Molecular Spectroscopy Market Revenue (Million), by Country 2024 & 2032
- Figure 44: Europe Molecular Spectroscopy Market Volume (K Unit), by Country 2024 & 2032
- Figure 45: Europe Molecular Spectroscopy Market Revenue Share (%), by Country 2024 & 2032
- Figure 46: Europe Molecular Spectroscopy Market Volume Share (%), by Country 2024 & 2032
- Figure 47: Asia Pacific Molecular Spectroscopy Market Revenue (Million), by Type of Spectroscopy 2024 & 2032
- Figure 48: Asia Pacific Molecular Spectroscopy Market Volume (K Unit), by Type of Spectroscopy 2024 & 2032
- Figure 49: Asia Pacific Molecular Spectroscopy Market Revenue Share (%), by Type of Spectroscopy 2024 & 2032
- Figure 50: Asia Pacific Molecular Spectroscopy Market Volume Share (%), by Type of Spectroscopy 2024 & 2032
- Figure 51: Asia Pacific Molecular Spectroscopy Market Revenue (Million), by Application 2024 & 2032
- Figure 52: Asia Pacific Molecular Spectroscopy Market Volume (K Unit), by Application 2024 & 2032
- Figure 53: Asia Pacific Molecular Spectroscopy Market Revenue Share (%), by Application 2024 & 2032
- Figure 54: Asia Pacific Molecular Spectroscopy Market Volume Share (%), by Application 2024 & 2032
- Figure 55: Asia Pacific Molecular Spectroscopy Market Revenue (Million), by Country 2024 & 2032
- Figure 56: Asia Pacific Molecular Spectroscopy Market Volume (K Unit), by Country 2024 & 2032
- Figure 57: Asia Pacific Molecular Spectroscopy Market Revenue Share (%), by Country 2024 & 2032
- Figure 58: Asia Pacific Molecular Spectroscopy Market Volume Share (%), by Country 2024 & 2032
- Figure 59: Middle East and Africa Molecular Spectroscopy Market Revenue (Million), by Type of Spectroscopy 2024 & 2032
- Figure 60: Middle East and Africa Molecular Spectroscopy Market Volume (K Unit), by Type of Spectroscopy 2024 & 2032
- Figure 61: Middle East and Africa Molecular Spectroscopy Market Revenue Share (%), by Type of Spectroscopy 2024 & 2032
- Figure 62: Middle East and Africa Molecular Spectroscopy Market Volume Share (%), by Type of Spectroscopy 2024 & 2032
- Figure 63: Middle East and Africa Molecular Spectroscopy Market Revenue (Million), by Application 2024 & 2032
- Figure 64: Middle East and Africa Molecular Spectroscopy Market Volume (K Unit), by Application 2024 & 2032
- Figure 65: Middle East and Africa Molecular Spectroscopy Market Revenue Share (%), by Application 2024 & 2032
- Figure 66: Middle East and Africa Molecular Spectroscopy Market Volume Share (%), by Application 2024 & 2032
- Figure 67: Middle East and Africa Molecular Spectroscopy Market Revenue (Million), by Country 2024 & 2032
- Figure 68: Middle East and Africa Molecular Spectroscopy Market Volume (K Unit), by Country 2024 & 2032
- Figure 69: Middle East and Africa Molecular Spectroscopy Market Revenue Share (%), by Country 2024 & 2032
- Figure 70: Middle East and Africa Molecular Spectroscopy Market Volume Share (%), by Country 2024 & 2032
- Figure 71: South America Molecular Spectroscopy Market Revenue (Million), by Type of Spectroscopy 2024 & 2032
- Figure 72: South America Molecular Spectroscopy Market Volume (K Unit), by Type of Spectroscopy 2024 & 2032
- Figure 73: South America Molecular Spectroscopy Market Revenue Share (%), by Type of Spectroscopy 2024 & 2032
- Figure 74: South America Molecular Spectroscopy Market Volume Share (%), by Type of Spectroscopy 2024 & 2032
- Figure 75: South America Molecular Spectroscopy Market Revenue (Million), by Application 2024 & 2032
- Figure 76: South America Molecular Spectroscopy Market Volume (K Unit), by Application 2024 & 2032
- Figure 77: South America Molecular Spectroscopy Market Revenue Share (%), by Application 2024 & 2032
- Figure 78: South America Molecular Spectroscopy Market Volume Share (%), by Application 2024 & 2032
- Figure 79: South America Molecular Spectroscopy Market Revenue (Million), by Country 2024 & 2032
- Figure 80: South America Molecular Spectroscopy Market Volume (K Unit), by Country 2024 & 2032
- Figure 81: South America Molecular Spectroscopy Market Revenue Share (%), by Country 2024 & 2032
- Figure 82: South America Molecular Spectroscopy Market Volume Share (%), by Country 2024 & 2032
List of Tables
- Table 1: Global Molecular Spectroscopy Market Revenue Million Forecast, by Region 2019 & 2032
- Table 2: Global Molecular Spectroscopy Market Volume K Unit Forecast, by Region 2019 & 2032
- Table 3: Global Molecular Spectroscopy Market Revenue Million Forecast, by Type of Spectroscopy 2019 & 2032
- Table 4: Global Molecular Spectroscopy Market Volume K Unit Forecast, by Type of Spectroscopy 2019 & 2032
- Table 5: Global Molecular Spectroscopy Market Revenue Million Forecast, by Application 2019 & 2032
- Table 6: Global Molecular Spectroscopy Market Volume K Unit Forecast, by Application 2019 & 2032
- Table 7: Global Molecular Spectroscopy Market Revenue Million Forecast, by Region 2019 & 2032
- Table 8: Global Molecular Spectroscopy Market Volume K Unit Forecast, by Region 2019 & 2032
- Table 9: Global Molecular Spectroscopy Market Revenue Million Forecast, by Country 2019 & 2032
- Table 10: Global Molecular Spectroscopy Market Volume K Unit Forecast, by Country 2019 & 2032
- Table 11: United States Molecular Spectroscopy Market Revenue (Million) Forecast, by Application 2019 & 2032
- Table 12: United States Molecular Spectroscopy Market Volume (K Unit) Forecast, by Application 2019 & 2032
- Table 13: Canada Molecular Spectroscopy Market Revenue (Million) Forecast, by Application 2019 & 2032
- Table 14: Canada Molecular Spectroscopy Market Volume (K Unit) Forecast, by Application 2019 & 2032
- Table 15: Mexico Molecular Spectroscopy Market Revenue (Million) Forecast, by Application 2019 & 2032
- Table 16: Mexico Molecular Spectroscopy Market Volume (K Unit) Forecast, by Application 2019 & 2032
- Table 17: Global Molecular Spectroscopy Market Revenue Million Forecast, by Country 2019 & 2032
- Table 18: Global Molecular Spectroscopy Market Volume K Unit Forecast, by Country 2019 & 2032
- Table 19: Germany Molecular Spectroscopy Market Revenue (Million) Forecast, by Application 2019 & 2032
- Table 20: Germany Molecular Spectroscopy Market Volume (K Unit) Forecast, by Application 2019 & 2032
- Table 21: United Kingdom Molecular Spectroscopy Market Revenue (Million) Forecast, by Application 2019 & 2032
- Table 22: United Kingdom Molecular Spectroscopy Market Volume (K Unit) Forecast, by Application 2019 & 2032
- Table 23: France Molecular Spectroscopy Market Revenue (Million) Forecast, by Application 2019 & 2032
- Table 24: France Molecular Spectroscopy Market Volume (K Unit) Forecast, by Application 2019 & 2032
- Table 25: Italy Molecular Spectroscopy Market Revenue (Million) Forecast, by Application 2019 & 2032
- Table 26: Italy Molecular Spectroscopy Market Volume (K Unit) Forecast, by Application 2019 & 2032
- Table 27: Spain Molecular Spectroscopy Market Revenue (Million) Forecast, by Application 2019 & 2032
- Table 28: Spain Molecular Spectroscopy Market Volume (K Unit) Forecast, by Application 2019 & 2032
- Table 29: Rest of Europe Molecular Spectroscopy Market Revenue (Million) Forecast, by Application 2019 & 2032
- Table 30: Rest of Europe Molecular Spectroscopy Market Volume (K Unit) Forecast, by Application 2019 & 2032
- Table 31: Global Molecular Spectroscopy Market Revenue Million Forecast, by Country 2019 & 2032
- Table 32: Global Molecular Spectroscopy Market Volume K Unit Forecast, by Country 2019 & 2032
- Table 33: China Molecular Spectroscopy Market Revenue (Million) Forecast, by Application 2019 & 2032
- Table 34: China Molecular Spectroscopy Market Volume (K Unit) Forecast, by Application 2019 & 2032
- Table 35: Japan Molecular Spectroscopy Market Revenue (Million) Forecast, by Application 2019 & 2032
- Table 36: Japan Molecular Spectroscopy Market Volume (K Unit) Forecast, by Application 2019 & 2032
- Table 37: India Molecular Spectroscopy Market Revenue (Million) Forecast, by Application 2019 & 2032
- Table 38: India Molecular Spectroscopy Market Volume (K Unit) Forecast, by Application 2019 & 2032
- Table 39: Australia Molecular Spectroscopy Market Revenue (Million) Forecast, by Application 2019 & 2032
- Table 40: Australia Molecular Spectroscopy Market Volume (K Unit) Forecast, by Application 2019 & 2032
- Table 41: South Korea Molecular Spectroscopy Market Revenue (Million) Forecast, by Application 2019 & 2032
- Table 42: South Korea Molecular Spectroscopy Market Volume (K Unit) Forecast, by Application 2019 & 2032
- Table 43: Rest of Asia Pacific Molecular Spectroscopy Market Revenue (Million) Forecast, by Application 2019 & 2032
- Table 44: Rest of Asia Pacific Molecular Spectroscopy Market Volume (K Unit) Forecast, by Application 2019 & 2032
- Table 45: Global Molecular Spectroscopy Market Revenue Million Forecast, by Country 2019 & 2032
- Table 46: Global Molecular Spectroscopy Market Volume K Unit Forecast, by Country 2019 & 2032
- Table 47: GCC Molecular Spectroscopy Market Revenue (Million) Forecast, by Application 2019 & 2032
- Table 48: GCC Molecular Spectroscopy Market Volume (K Unit) Forecast, by Application 2019 & 2032
- Table 49: South Africa Molecular Spectroscopy Market Revenue (Million) Forecast, by Application 2019 & 2032
- Table 50: South Africa Molecular Spectroscopy Market Volume (K Unit) Forecast, by Application 2019 & 2032
- Table 51: Rest of Middle East and Africa Molecular Spectroscopy Market Revenue (Million) Forecast, by Application 2019 & 2032
- Table 52: Rest of Middle East and Africa Molecular Spectroscopy Market Volume (K Unit) Forecast, by Application 2019 & 2032
- Table 53: Global Molecular Spectroscopy Market Revenue Million Forecast, by Country 2019 & 2032
- Table 54: Global Molecular Spectroscopy Market Volume K Unit Forecast, by Country 2019 & 2032
- Table 55: Brazil Molecular Spectroscopy Market Revenue (Million) Forecast, by Application 2019 & 2032
- Table 56: Brazil Molecular Spectroscopy Market Volume (K Unit) Forecast, by Application 2019 & 2032
- Table 57: Argentina Molecular Spectroscopy Market Revenue (Million) Forecast, by Application 2019 & 2032
- Table 58: Argentina Molecular Spectroscopy Market Volume (K Unit) Forecast, by Application 2019 & 2032
- Table 59: Rest of South America Molecular Spectroscopy Market Revenue (Million) Forecast, by Application 2019 & 2032
- Table 60: Rest of South America Molecular Spectroscopy Market Volume (K Unit) Forecast, by Application 2019 & 2032
- Table 61: Global Molecular Spectroscopy Market Revenue Million Forecast, by Type of Spectroscopy 2019 & 2032
- Table 62: Global Molecular Spectroscopy Market Volume K Unit Forecast, by Type of Spectroscopy 2019 & 2032
- Table 63: Global Molecular Spectroscopy Market Revenue Million Forecast, by Application 2019 & 2032
- Table 64: Global Molecular Spectroscopy Market Volume K Unit Forecast, by Application 2019 & 2032
- Table 65: Global Molecular Spectroscopy Market Revenue Million Forecast, by Country 2019 & 2032
- Table 66: Global Molecular Spectroscopy Market Volume K Unit Forecast, by Country 2019 & 2032
- Table 67: United States Molecular Spectroscopy Market Revenue (Million) Forecast, by Application 2019 & 2032
- Table 68: United States Molecular Spectroscopy Market Volume (K Unit) Forecast, by Application 2019 & 2032
- Table 69: Canada Molecular Spectroscopy Market Revenue (Million) Forecast, by Application 2019 & 2032
- Table 70: Canada Molecular Spectroscopy Market Volume (K Unit) Forecast, by Application 2019 & 2032
- Table 71: Mexico Molecular Spectroscopy Market Revenue (Million) Forecast, by Application 2019 & 2032
- Table 72: Mexico Molecular Spectroscopy Market Volume (K Unit) Forecast, by Application 2019 & 2032
- Table 73: Global Molecular Spectroscopy Market Revenue Million Forecast, by Type of Spectroscopy 2019 & 2032
- Table 74: Global Molecular Spectroscopy Market Volume K Unit Forecast, by Type of Spectroscopy 2019 & 2032
- Table 75: Global Molecular Spectroscopy Market Revenue Million Forecast, by Application 2019 & 2032
- Table 76: Global Molecular Spectroscopy Market Volume K Unit Forecast, by Application 2019 & 2032
- Table 77: Global Molecular Spectroscopy Market Revenue Million Forecast, by Country 2019 & 2032
- Table 78: Global Molecular Spectroscopy Market Volume K Unit Forecast, by Country 2019 & 2032
- Table 79: Germany Molecular Spectroscopy Market Revenue (Million) Forecast, by Application 2019 & 2032
- Table 80: Germany Molecular Spectroscopy Market Volume (K Unit) Forecast, by Application 2019 & 2032
- Table 81: United Kingdom Molecular Spectroscopy Market Revenue (Million) Forecast, by Application 2019 & 2032
- Table 82: United Kingdom Molecular Spectroscopy Market Volume (K Unit) Forecast, by Application 2019 & 2032
- Table 83: France Molecular Spectroscopy Market Revenue (Million) Forecast, by Application 2019 & 2032
- Table 84: France Molecular Spectroscopy Market Volume (K Unit) Forecast, by Application 2019 & 2032
- Table 85: Italy Molecular Spectroscopy Market Revenue (Million) Forecast, by Application 2019 & 2032
- Table 86: Italy Molecular Spectroscopy Market Volume (K Unit) Forecast, by Application 2019 & 2032
- Table 87: Spain Molecular Spectroscopy Market Revenue (Million) Forecast, by Application 2019 & 2032
- Table 88: Spain Molecular Spectroscopy Market Volume (K Unit) Forecast, by Application 2019 & 2032
- Table 89: Rest of Europe Molecular Spectroscopy Market Revenue (Million) Forecast, by Application 2019 & 2032
- Table 90: Rest of Europe Molecular Spectroscopy Market Volume (K Unit) Forecast, by Application 2019 & 2032
- Table 91: Global Molecular Spectroscopy Market Revenue Million Forecast, by Type of Spectroscopy 2019 & 2032
- Table 92: Global Molecular Spectroscopy Market Volume K Unit Forecast, by Type of Spectroscopy 2019 & 2032
- Table 93: Global Molecular Spectroscopy Market Revenue Million Forecast, by Application 2019 & 2032
- Table 94: Global Molecular Spectroscopy Market Volume K Unit Forecast, by Application 2019 & 2032
- Table 95: Global Molecular Spectroscopy Market Revenue Million Forecast, by Country 2019 & 2032
- Table 96: Global Molecular Spectroscopy Market Volume K Unit Forecast, by Country 2019 & 2032
- Table 97: China Molecular Spectroscopy Market Revenue (Million) Forecast, by Application 2019 & 2032
- Table 98: China Molecular Spectroscopy Market Volume (K Unit) Forecast, by Application 2019 & 2032
- Table 99: Japan Molecular Spectroscopy Market Revenue (Million) Forecast, by Application 2019 & 2032
- Table 100: Japan Molecular Spectroscopy Market Volume (K Unit) Forecast, by Application 2019 & 2032
- Table 101: India Molecular Spectroscopy Market Revenue (Million) Forecast, by Application 2019 & 2032
- Table 102: India Molecular Spectroscopy Market Volume (K Unit) Forecast, by Application 2019 & 2032
- Table 103: Australia Molecular Spectroscopy Market Revenue (Million) Forecast, by Application 2019 & 2032
- Table 104: Australia Molecular Spectroscopy Market Volume (K Unit) Forecast, by Application 2019 & 2032
- Table 105: South Korea Molecular Spectroscopy Market Revenue (Million) Forecast, by Application 2019 & 2032
- Table 106: South Korea Molecular Spectroscopy Market Volume (K Unit) Forecast, by Application 2019 & 2032
- Table 107: Rest of Asia Pacific Molecular Spectroscopy Market Revenue (Million) Forecast, by Application 2019 & 2032
- Table 108: Rest of Asia Pacific Molecular Spectroscopy Market Volume (K Unit) Forecast, by Application 2019 & 2032
- Table 109: Global Molecular Spectroscopy Market Revenue Million Forecast, by Type of Spectroscopy 2019 & 2032
- Table 110: Global Molecular Spectroscopy Market Volume K Unit Forecast, by Type of Spectroscopy 2019 & 2032
- Table 111: Global Molecular Spectroscopy Market Revenue Million Forecast, by Application 2019 & 2032
- Table 112: Global Molecular Spectroscopy Market Volume K Unit Forecast, by Application 2019 & 2032
- Table 113: Global Molecular Spectroscopy Market Revenue Million Forecast, by Country 2019 & 2032
- Table 114: Global Molecular Spectroscopy Market Volume K Unit Forecast, by Country 2019 & 2032
- Table 115: GCC Molecular Spectroscopy Market Revenue (Million) Forecast, by Application 2019 & 2032
- Table 116: GCC Molecular Spectroscopy Market Volume (K Unit) Forecast, by Application 2019 & 2032
- Table 117: South Africa Molecular Spectroscopy Market Revenue (Million) Forecast, by Application 2019 & 2032
- Table 118: South Africa Molecular Spectroscopy Market Volume (K Unit) Forecast, by Application 2019 & 2032
- Table 119: Rest of Middle East and Africa Molecular Spectroscopy Market Revenue (Million) Forecast, by Application 2019 & 2032
- Table 120: Rest of Middle East and Africa Molecular Spectroscopy Market Volume (K Unit) Forecast, by Application 2019 & 2032
- Table 121: Global Molecular Spectroscopy Market Revenue Million Forecast, by Type of Spectroscopy 2019 & 2032
- Table 122: Global Molecular Spectroscopy Market Volume K Unit Forecast, by Type of Spectroscopy 2019 & 2032
- Table 123: Global Molecular Spectroscopy Market Revenue Million Forecast, by Application 2019 & 2032
- Table 124: Global Molecular Spectroscopy Market Volume K Unit Forecast, by Application 2019 & 2032
- Table 125: Global Molecular Spectroscopy Market Revenue Million Forecast, by Country 2019 & 2032
- Table 126: Global Molecular Spectroscopy Market Volume K Unit Forecast, by Country 2019 & 2032
- Table 127: Brazil Molecular Spectroscopy Market Revenue (Million) Forecast, by Application 2019 & 2032
- Table 128: Brazil Molecular Spectroscopy Market Volume (K Unit) Forecast, by Application 2019 & 2032
- Table 129: Argentina Molecular Spectroscopy Market Revenue (Million) Forecast, by Application 2019 & 2032
- Table 130: Argentina Molecular Spectroscopy Market Volume (K Unit) Forecast, by Application 2019 & 2032
- Table 131: Rest of South America Molecular Spectroscopy Market Revenue (Million) Forecast, by Application 2019 & 2032
- Table 132: Rest of South America Molecular Spectroscopy Market Volume (K Unit) Forecast, by Application 2019 & 2032
Frequently Asked Questions
1. What is the projected Compound Annual Growth Rate (CAGR) of the Molecular Spectroscopy Market?
The projected CAGR is approximately 3.72%.
2. Which companies are prominent players in the Molecular Spectroscopy Market?
Key companies in the market include Horiba Ltd, Bio-Rad Laboratories Inc, Merck KGaA, VIAVI Solutions Inc, Waters Corporation, Danaher Corporation, Agilent Technologies Inc, Thermo Fischer Scientific Inc, Jeol Ltd, Keit Ltd, PerkinElmer Inc, Thorlabs Inc, Bruker Corporation, Shimadzu Corporation.
3. What are the main segments of the Molecular Spectroscopy Market?
The market segments include Type of Spectroscopy, Application.
4. Can you provide details about the market size?
The market size is estimated to be USD 2.87 Million as of 2022.
5. What are some drivers contributing to market growth?
Rapid Adoption in the Pharmaceutical Industry; Penetration of MS Technology in Various Verticals; Increased Emphasis for Discovery of Newer Molecules by Pharmaceuticals.
6. What are the notable trends driving market growth?
The NMR Spectroscopy Segment is Expected to Observe Good Growth Over the Forecast Period.
7. Are there any restraints impacting market growth?
High Cost of Maintenance and Installation Charges; Need of Technically Skilled Personnel.
8. Can you provide examples of recent developments in the market?
N/A
9. What pricing options are available for accessing the report?
Pricing options include single-user, multi-user, and enterprise licenses priced at USD 4750, USD 5250, and USD 8750 respectively.
10. Is the market size provided in terms of value or volume?
The market size is provided in terms of value, measured in Million and volume, measured in K Unit.
11. Are there any specific market keywords associated with the report?
Yes, the market keyword associated with the report is "Molecular Spectroscopy Market," which aids in identifying and referencing the specific market segment covered.
12. How do I determine which pricing option suits my needs best?
The pricing options vary based on user requirements and access needs. Individual users may opt for single-user licenses, while businesses requiring broader access may choose multi-user or enterprise licenses for cost-effective access to the report.
13. Are there any additional resources or data provided in the Molecular Spectroscopy Market report?
While the report offers comprehensive insights, it's advisable to review the specific contents or supplementary materials provided to ascertain if additional resources or data are available.
14. How can I stay updated on further developments or reports in the Molecular Spectroscopy Market?
To stay informed about further developments, trends, and reports in the Molecular Spectroscopy Market, consider subscribing to industry newsletters, following relevant companies and organizations, or regularly checking reputable industry news sources and publications.
Methodology
Step 1 - Identification of Relevant Samples Size from Population Database


Step 2 - Approaches for Defining Global Market Size (Value, Volume* & Price*)

Note*: In applicable scenarios
Step 3 - Data Sources
Primary Research
- Web Analytics
- Survey Reports
- Research Institute
- Latest Research Reports
- Opinion Leaders
Secondary Research
- Annual Reports
- White Paper
- Latest Press Release
- Industry Association
- Paid Database
- Investor Presentations

Step 4 - Data Triangulation
Involves using different sources of information in order to increase the validity of a study
These sources are likely to be stakeholders in a program - participants, other researchers, program staff, other community members, and so on.
Then we put all data in single framework & apply various statistical tools to find out the dynamic on the market.
During the analysis stage, feedback from the stakeholder groups would be compared to determine areas of agreement as well as areas of divergence


