

Key Insights
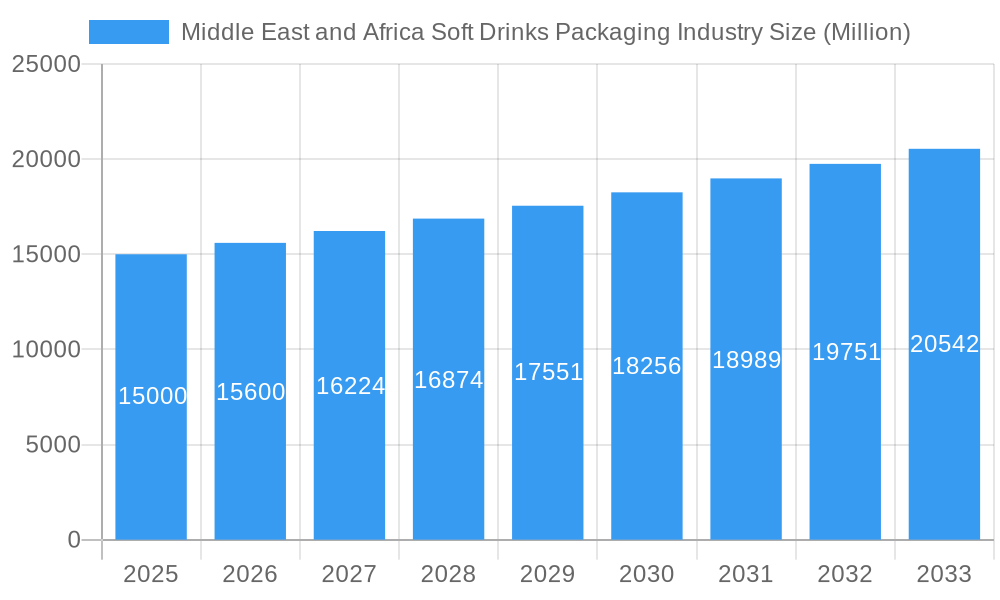
The Middle East and Africa (MEA) soft drinks packaging market is poised for significant expansion, fueled by escalating disposable incomes, rapid urbanization, and a growing populace in key economies such as the UAE and Saudi Arabia. Evolving consumer demand for convenient, on-the-go beverage consumption is also a key driver, stimulating innovation in packaging solutions. While plastic packaging continues to dominate due to its cost-efficiency and adaptability, a notable trend towards sustainable alternatives, including paper and paperboard, is emerging. This shift is largely influenced by increasing environmental awareness and regulatory mandates promoting eco-friendly practices. Bottled water and Ready-to-Drink (RTD) beverages represent substantial market segments, underscoring their widespread consumer appeal. Despite robust growth prospects, the market faces challenges such as volatile raw material costs and the imperative to align with dynamic consumer preferences for packaging aesthetics and functionality. The competitive arena features both global leaders and regional enterprises, fostering a vibrant ecosystem of strategic alliances, mergers, and acquisitions aimed at market share expansion and technological advancement. The forecast period (2025-2033) anticipates sustained growth, projecting a Compound Annual Growth Rate (CAGR) of 5.1%. The estimated market size in 2025 is 49.6 billion, with further substantial growth anticipated by the end of the forecast period, driven by regional demand for convenient and sustainable packaging formats.
Middle East and Africa Soft Drinks Packaging Industry Market Size (In Billion)
Africa's specific market growth within this sector is intrinsically linked to economic development and infrastructure enhancement. While nations like South Africa represent more mature markets, other African regions offer considerable untapped potential. Growth trajectories will be shaped by the increasing adoption of modern retail channels, improvements in cold chain logistics, and the expanding middle class. Notwithstanding these challenges, the long-term outlook remains optimistic, propelled by demographic expansion, continued urbanization, and a gradual transition towards sophisticated packaging. Companies are increasingly focusing on localized strategies to cater to specific cultural preferences and logistical requirements, suggesting a rise in manufacturing investments within key African nations to meet escalating demand.
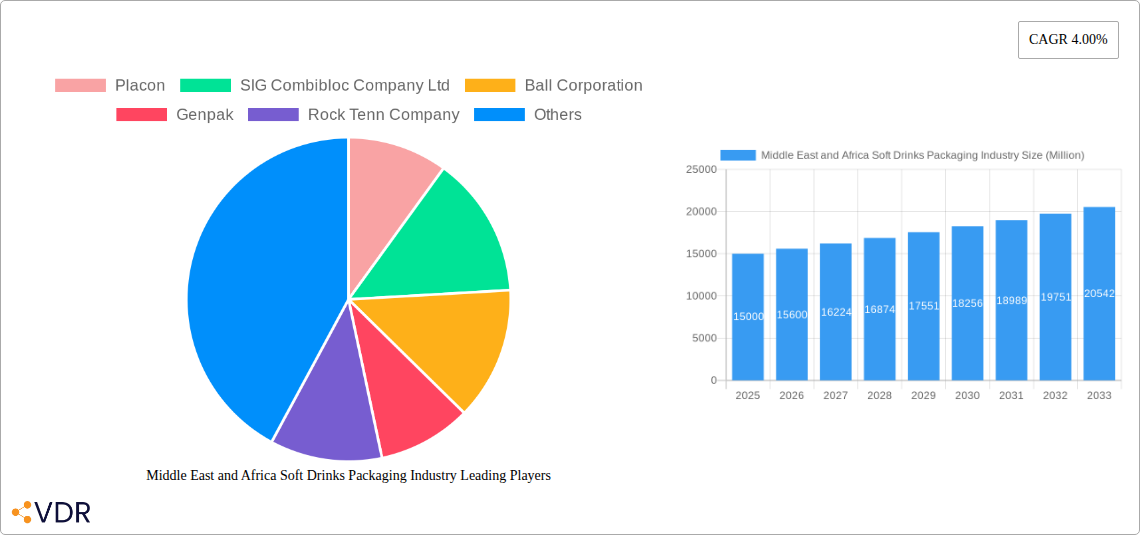
Middle East and Africa Soft Drinks Packaging Industry Company Market Share
Middle East & Africa Soft Drinks Packaging Industry Market Report: 2019-2033
This comprehensive report provides a detailed analysis of the Middle East and Africa soft drinks packaging industry, covering market dynamics, growth trends, key players, and future outlook. The study period spans 2019-2033, with 2025 as the base and estimated year. The report utilizes data from 2019-2024 (historical period) to forecast market trends from 2025-2033 (forecast period). This report is crucial for industry professionals, investors, and strategic decision-makers seeking in-depth insights into this dynamic market.
Middle East and Africa Soft Drinks Packaging Industry Market Dynamics & Structure
This section analyzes the competitive landscape, technological advancements, regulatory environment, and market trends within the Middle East and Africa soft drinks packaging industry. The analysis encompasses market concentration, innovation drivers, regulatory frameworks, competitive substitutes, end-user demographics, and M&A activities. Quantitative insights, such as market share percentages and M&A deal volumes (in Million units), will be provided alongside qualitative assessments of innovation barriers and other influencing factors.
- Market Concentration: The market is characterized by a xx% market share held by the top 5 players, indicating a moderately concentrated market. Further analysis will dissect market share by material type and region.
- Technological Innovation: Key drivers include advancements in lightweighting, sustainable materials (e.g., biodegradable plastics), and improved printing technologies. Barriers include high initial investment costs and a lack of skilled labor in some regions.
- Regulatory Framework: Governments in the region are increasingly focusing on regulations related to material recyclability, food safety, and environmental sustainability.
- Competitive Substitutes: The industry faces competition from alternative packaging solutions, including flexible packaging and reusable containers.
- End-User Demographics: Growing urbanization and changing consumer preferences (e.g., demand for convenience and on-the-go consumption) are significant drivers.
- M&A Trends: The past five years have witnessed xx M&A deals, primarily focused on expanding market reach and acquiring specialized technologies.
Middle East and Africa Soft Drinks Packaging Industry Growth Trends & Insights
This section provides a detailed analysis of the market size evolution, adoption rates, technological disruptions, and consumer behavior shifts within the Middle East and Africa soft drinks packaging market. This in-depth analysis utilizes XXX (specify data source) to provide comprehensive insights into the sector's growth trajectory. Specific metrics, including the Compound Annual Growth Rate (CAGR) and market penetration rates, will be provided to offer a deeper understanding of market dynamics. The analysis covers market size projections, adoption of innovative packaging solutions, and impacts of technological advancements and shifting consumer preferences.
Dominant Regions, Countries, or Segments in Middle East and Africa Soft Drinks Packaging Industry
This section identifies the leading regions, countries, and segments (by primary material—plastic, paper and paperboard, glass, metal, others; by type—bottled water, juices, RTD beverages, sports drinks, others; and by region—UAE, Saudi Arabia, South Africa, Egypt, others) driving market growth. The analysis will focus on the factors contributing to their dominance, including market share, growth potential, economic policies, and infrastructure development. Quantitative data (in Million units) on market size and growth rates will be presented for each leading segment.
- Dominant Region: The UAE and Saudi Arabia currently hold the largest market share, driven by high per capita consumption of soft drinks and robust economic growth.
- Dominant Material: Plastic packaging currently dominates due to its cost-effectiveness and versatility, however, growing environmental concerns are driving a shift towards sustainable alternatives.
- Dominant Product Type: Bottled water and carbonated soft drinks currently represent the largest segments.
- Key Drivers: Increasing disposable incomes, urbanization, and the expansion of retail channels are driving market growth across all segments.
Middle East and Africa Soft Drinks Packaging Industry Product Landscape
This section details the latest product innovations, applications, and performance metrics of soft drinks packaging in the Middle East and Africa. It highlights the unique selling propositions (USPs) and technological advancements driving market competition. Specific examples of innovative packaging solutions and their key features will be included, addressing functionality, sustainability, and consumer appeal.
Key Drivers, Barriers & Challenges in Middle East and Africa Soft Drinks Packaging Industry
This section outlines the key factors driving market growth and the significant challenges hindering its expansion.
Key Drivers:
- Growing demand for convenient and on-the-go consumption.
- Increasing disposable incomes and urbanization.
- Rising adoption of sustainable and eco-friendly packaging solutions.
- Technological advancements in packaging materials and design.
Key Challenges:
- Fluctuating raw material prices.
- Stringent regulatory compliance requirements for food safety and sustainability.
- Intense competition among packaging manufacturers.
- Supply chain disruptions, particularly concerning transportation and logistics. This has impacted overall output by an estimated xx Million units in the past year.
Emerging Opportunities in Middle East and Africa Soft Drinks Packaging Industry
This section explores emerging trends and opportunities within the market, focusing on areas with untapped potential. This includes opportunities to tap into growing consumer segments, the increasing demand for eco-friendly and sustainable packaging solutions, the need for lightweight packaging to improve transportation efficiency, and technological advancements to enhance packaging design and functionality.
Growth Accelerators in the Middle East and Africa Soft Drinks Packaging Industry Industry
This section focuses on catalysts driving long-term growth, such as technological innovation, strategic partnerships, and market expansion strategies. The successful implementation of government policies promoting sustainability is expected to significantly boost the market. Furthermore, strategic collaborations between packaging companies and soft drink manufacturers are expected to propel the growth of the industry.
Key Players Shaping the Middle East and Africa Soft Drinks Packaging Industry Market
- Placon
- SIG Combibloc Company Ltd
- Ball Corporation
- Genpak
- Rock Tenn Company
- Alcoa In
- Graham Packaging Company
- Tetra Pak International
- Rexam inc
- Nuconic Packaging
- Crown Holdings Incorporated
- Pactiv LLC
- The Scoular Company
- Toyo Seikan Group Holdings Ltd
- Owens-Illinois Inc
- Amcor Ltd
Notable Milestones in Middle East and Africa Soft Drinks Packaging Industry Sector
- November 2021: UFlex plans a $100 million investment in a new UAE facility for its innovative aseptic liquid packaging technology. This signals a significant push toward advanced packaging solutions in the MENA region.
- October 2020: Nestlé Egypt launches a plastic recycling initiative in partnership with the Egyptian government, indicating a growing focus on sustainability within the industry.
- August 2020: INDEVCO Paper Containers launches a new line of corrugated separators in response to COVID-19 social distancing measures, showcasing adaptability and innovation during challenging times.
In-Depth Middle East and Africa Soft Drinks Packaging Industry Market Outlook
The Middle East and Africa soft drinks packaging market is poised for significant growth over the forecast period. Technological advancements, increasing environmental awareness, and the focus on sustainable packaging will create significant opportunities for industry players. Strategic partnerships and investments in innovative solutions will further shape the market's trajectory. The market is projected to reach xx Million units by 2033, driven by the factors mentioned above.
Middle East and Africa Soft Drinks Packaging Industry Segmentation
-
1. Primary Material Used
- 1.1. Plastic
- 1.2. Paper and Paperboard
- 1.3. Glass
- 1.4. Metal
- 1.5. Others
-
2. Type
- 2.1. Bottles Water
- 2.2. Juices
- 2.3. RTD Beverages
- 2.4. Sport Drinks
- 2.5. Others
Middle East and Africa Soft Drinks Packaging Industry Segmentation By Geography
-
1. Middle East
- 1.1. Saudi Arabia
- 1.2. United Arab Emirates
- 1.3. Israel
- 1.4. Qatar
- 1.5. Kuwait
- 1.6. Oman
- 1.7. Bahrain
- 1.8. Jordan
- 1.9. Lebanon
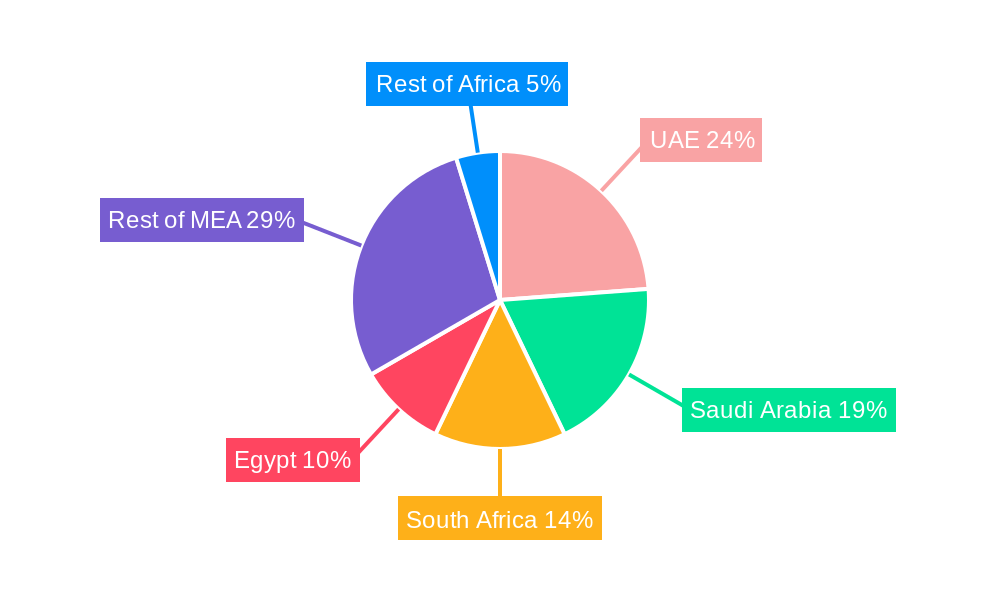
Middle East and Africa Soft Drinks Packaging Industry Regional Market Share
Geographic Coverage of Middle East and Africa Soft Drinks Packaging Industry
Middle East and Africa Soft Drinks Packaging Industry REPORT HIGHLIGHTS
| Aspects | Details |
|---|---|
| Study Period | 2020-2034 |
| Base Year | 2025 |
| Estimated Year | 2026 |
| Forecast Period | 2026-2034 |
| Historical Period | 2020-2025 |
| Growth Rate | CAGR of 5.1% from 2020-2034 |
| Segmentation |
|
Table of Contents
- 1. Introduction
- 1.1. Research Scope
- 1.2. Market Segmentation
- 1.3. Research Objective
- 1.4. Definitions and Assumptions
- 2. Executive Summary
- 2.1. Market Snapshot
- 3. Market Dynamics
- 3.1. Market Drivers
- 3.2. Market Restrains
- 3.3. Market Trends
- 3.4. Market Opportunities
- 4. Market Factor Analysis
- 4.1. Porters Five Forces
- 4.1.1. Bargaining Power of Suppliers
- 4.1.2. Bargaining Power of Buyers
- 4.1.3. Threat of New Entrants
- 4.1.4. Threat of Substitutes
- 4.1.5. Competitive Rivalry
- 4.2. PESTEL analysis
- 4.3. BCG Analysis
- 4.3.1. Stars (High Growth, High Market Share)
- 4.3.2. Cash Cows (Low Growth, High Market Share)
- 4.3.3. Question Mark (High Growth, Low Market Share)
- 4.3.4. Dogs (Low Growth, Low Market Share)
- 4.4. Ansoff Matrix Analysis
- 4.5. Supply Chain Analysis
- 4.6. Regulatory Landscape
- 4.7. Current Market Potential and Opportunity Assessment (TAM–SAM–SOM Framework)
- 4.8. VDR Analyst Note
- 4.1. Porters Five Forces
- 5. Market Analysis, Insights and Forecast 2021-2033
- 5.1. Market Analysis, Insights and Forecast - by Primary Material Used
- 5.1.1. Plastic
- 5.1.2. Paper and Paperboard
- 5.1.3. Glass
- 5.1.4. Metal
- 5.1.5. Others
- 5.2. Market Analysis, Insights and Forecast - by Type
- 5.2.1. Bottles Water
- 5.2.2. Juices
- 5.2.3. RTD Beverages
- 5.2.4. Sport Drinks
- 5.2.5. Others
- 5.3. Market Analysis, Insights and Forecast - by Region
- 5.3.1. Middle East
- 5.1. Market Analysis, Insights and Forecast - by Primary Material Used
- 6. Middle East and Africa Soft Drinks Packaging Industry Analysis, Insights and Forecast, 2021-2033
- 6.1. Market Analysis, Insights and Forecast - by Primary Material Used
- 6.1.1. Plastic
- 6.1.2. Paper and Paperboard
- 6.1.3. Glass
- 6.1.4. Metal
- 6.1.5. Others
- 6.2. Market Analysis, Insights and Forecast - by Type
- 6.2.1. Bottles Water
- 6.2.2. Juices
- 6.2.3. RTD Beverages
- 6.2.4. Sport Drinks
- 6.2.5. Others
- 6.1. Market Analysis, Insights and Forecast - by Primary Material Used
- 7. Competitive Analysis
- 7.1. Company Profiles
- 7.1.1 Placon
- 7.1.1.1. Company Overview
- 7.1.1.2. Products
- 7.1.1.3. Company Financials
- 7.1.1.4. SWOT Analysis
- 7.1.2 SIG Combibloc Company Ltd
- 7.1.2.1. Company Overview
- 7.1.2.2. Products
- 7.1.2.3. Company Financials
- 7.1.2.4. SWOT Analysis
- 7.1.3 Ball Corporation
- 7.1.3.1. Company Overview
- 7.1.3.2. Products
- 7.1.3.3. Company Financials
- 7.1.3.4. SWOT Analysis
- 7.1.4 Genpak
- 7.1.4.1. Company Overview
- 7.1.4.2. Products
- 7.1.4.3. Company Financials
- 7.1.4.4. SWOT Analysis
- 7.1.5 Rock Tenn Company
- 7.1.5.1. Company Overview
- 7.1.5.2. Products
- 7.1.5.3. Company Financials
- 7.1.5.4. SWOT Analysis
- 7.1.6 Alcoa In
- 7.1.6.1. Company Overview
- 7.1.6.2. Products
- 7.1.6.3. Company Financials
- 7.1.6.4. SWOT Analysis
- 7.1.7 Graham Packaging Company
- 7.1.7.1. Company Overview
- 7.1.7.2. Products
- 7.1.7.3. Company Financials
- 7.1.7.4. SWOT Analysis
- 7.1.8 Tetra Pak International
- 7.1.8.1. Company Overview
- 7.1.8.2. Products
- 7.1.8.3. Company Financials
- 7.1.8.4. SWOT Analysis
- 7.1.9 Rexam inc
- 7.1.9.1. Company Overview
- 7.1.9.2. Products
- 7.1.9.3. Company Financials
- 7.1.9.4. SWOT Analysis
- 7.1.10 Nuconic Packaging
- 7.1.10.1. Company Overview
- 7.1.10.2. Products
- 7.1.10.3. Company Financials
- 7.1.10.4. SWOT Analysis
- 7.1.11 Crown Holdings Incorporated
- 7.1.11.1. Company Overview
- 7.1.11.2. Products
- 7.1.11.3. Company Financials
- 7.1.11.4. SWOT Analysis
- 7.1.12 Pactiv LLC
- 7.1.12.1. Company Overview
- 7.1.12.2. Products
- 7.1.12.3. Company Financials
- 7.1.12.4. SWOT Analysis
- 7.1.13 The Scoular Company
- 7.1.13.1. Company Overview
- 7.1.13.2. Products
- 7.1.13.3. Company Financials
- 7.1.13.4. SWOT Analysis
- 7.1.14 Toyo Seikan Group Holdings Ltd
- 7.1.14.1. Company Overview
- 7.1.14.2. Products
- 7.1.14.3. Company Financials
- 7.1.14.4. SWOT Analysis
- 7.1.15 Owens-Illinois Inc
- 7.1.15.1. Company Overview
- 7.1.15.2. Products
- 7.1.15.3. Company Financials
- 7.1.15.4. SWOT Analysis
- 7.1.16 Amcor Ltd
- 7.1.16.1. Company Overview
- 7.1.16.2. Products
- 7.1.16.3. Company Financials
- 7.1.16.4. SWOT Analysis
- 7.1.1 Placon
- 7.2. Market Entropy
- 7.2.1 Company's Key Areas Served
- 7.2.2 Recent Developments
- 7.3. Company Market Share Analysis 2025
- 7.3.1 Top 5 Companies Market Share Analysis
- 7.3.2 Top 3 Companies Market Share Analysis
- 7.4. List of Potential Customers
- 8. Research Methodology
List of Figures
- Figure 1: Middle East and Africa Soft Drinks Packaging Industry Revenue Breakdown (billion, %) by Product 2025 & 2033
- Figure 2: Middle East and Africa Soft Drinks Packaging Industry Share (%) by Company 2025
List of Tables
- Table 1: Middle East and Africa Soft Drinks Packaging Industry Revenue billion Forecast, by Primary Material Used 2020 & 2033
- Table 2: Middle East and Africa Soft Drinks Packaging Industry Revenue billion Forecast, by Type 2020 & 2033
- Table 3: Middle East and Africa Soft Drinks Packaging Industry Revenue billion Forecast, by Region 2020 & 2033
- Table 4: Middle East and Africa Soft Drinks Packaging Industry Revenue billion Forecast, by Primary Material Used 2020 & 2033
- Table 5: Middle East and Africa Soft Drinks Packaging Industry Revenue billion Forecast, by Type 2020 & 2033
- Table 6: Middle East and Africa Soft Drinks Packaging Industry Revenue billion Forecast, by Country 2020 & 2033
- Table 7: Saudi Arabia Middle East and Africa Soft Drinks Packaging Industry Revenue (billion) Forecast, by Application 2020 & 2033
- Table 8: United Arab Emirates Middle East and Africa Soft Drinks Packaging Industry Revenue (billion) Forecast, by Application 2020 & 2033
- Table 9: Israel Middle East and Africa Soft Drinks Packaging Industry Revenue (billion) Forecast, by Application 2020 & 2033
- Table 10: Qatar Middle East and Africa Soft Drinks Packaging Industry Revenue (billion) Forecast, by Application 2020 & 2033
- Table 11: Kuwait Middle East and Africa Soft Drinks Packaging Industry Revenue (billion) Forecast, by Application 2020 & 2033
- Table 12: Oman Middle East and Africa Soft Drinks Packaging Industry Revenue (billion) Forecast, by Application 2020 & 2033
- Table 13: Bahrain Middle East and Africa Soft Drinks Packaging Industry Revenue (billion) Forecast, by Application 2020 & 2033
- Table 14: Jordan Middle East and Africa Soft Drinks Packaging Industry Revenue (billion) Forecast, by Application 2020 & 2033
- Table 15: Lebanon Middle East and Africa Soft Drinks Packaging Industry Revenue (billion) Forecast, by Application 2020 & 2033
Frequently Asked Questions
1. What is the projected Compound Annual Growth Rate (CAGR) of the Middle East and Africa Soft Drinks Packaging Industry?
The projected CAGR is approximately 5.1%.
2. Which companies are prominent players in the Middle East and Africa Soft Drinks Packaging Industry?
Key companies in the market include Placon, SIG Combibloc Company Ltd, Ball Corporation, Genpak, Rock Tenn Company, Alcoa In, Graham Packaging Company, Tetra Pak International, Rexam inc, Nuconic Packaging, Crown Holdings Incorporated, Pactiv LLC, The Scoular Company, Toyo Seikan Group Holdings Ltd, Owens-Illinois Inc, Amcor Ltd.
3. What are the main segments of the Middle East and Africa Soft Drinks Packaging Industry?
The market segments include Primary Material Used, Type.
4. Can you provide details about the market size?
The market size is estimated to be USD 49.6 billion as of 2022.
5. What are some drivers contributing to market growth?
Increasing Soft Drink Consumption; Increased demand for convenience packaging from consumers.
6. What are the notable trends driving market growth?
Saudi Arabia to hold the highest market.
7. Are there any restraints impacting market growth?
Environmental concerns regarding usage of plastic; Stringent Government Regulations.
8. Can you provide examples of recent developments in the market?
November 2021 - UFlex, the India-based multinational flexible packaging products company, is looking to set up a second manufacturing facility in the UAE, as the company is gearing up to launch its 'foil stamping' technology - said to be a global first innovation in aseptic liquid packaging material - in the Middle East and North Africa (MENA) market. The second manufacturing plant would involve an investment of about $100 million. The company is considering setting up a manufacturing facility for the new product in the UAE to make it a hub for its global expansion plans.
9. What pricing options are available for accessing the report?
Pricing options include single-user, multi-user, and enterprise licenses priced at USD 3800, USD 4500, and USD 5800 respectively.
10. Is the market size provided in terms of value or volume?
The market size is provided in terms of value, measured in billion.
11. Are there any specific market keywords associated with the report?
Yes, the market keyword associated with the report is "Middle East and Africa Soft Drinks Packaging Industry," which aids in identifying and referencing the specific market segment covered.
12. How do I determine which pricing option suits my needs best?
The pricing options vary based on user requirements and access needs. Individual users may opt for single-user licenses, while businesses requiring broader access may choose multi-user or enterprise licenses for cost-effective access to the report.
13. Are there any additional resources or data provided in the Middle East and Africa Soft Drinks Packaging Industry report?
While the report offers comprehensive insights, it's advisable to review the specific contents or supplementary materials provided to ascertain if additional resources or data are available.
14. How can I stay updated on further developments or reports in the Middle East and Africa Soft Drinks Packaging Industry?
To stay informed about further developments, trends, and reports in the Middle East and Africa Soft Drinks Packaging Industry, consider subscribing to industry newsletters, following relevant companies and organizations, or regularly checking reputable industry news sources and publications.
Methodology
Step 1 - Identification of Relevant Samples Size from Population Database


Step 2 - Approaches for Defining Global Market Size (Value, Volume* & Price*)

Note*: In applicable scenarios
Step 3 - Data Sources
Primary Research
- Web Analytics
- Survey Reports
- Research Institute
- Latest Research Reports
- Opinion Leaders
Secondary Research
- Annual Reports
- White Paper
- Latest Press Release
- Industry Association
- Paid Database
- Investor Presentations

Step 4 - Data Triangulation
Involves using different sources of information in order to increase the validity of a study
These sources are likely to be stakeholders in a program - participants, other researchers, program staff, other community members, and so on.
Then we put all data in single framework & apply various statistical tools to find out the dynamic on the market.
During the analysis stage, feedback from the stakeholder groups would be compared to determine areas of agreement as well as areas of divergence