

Key Insights
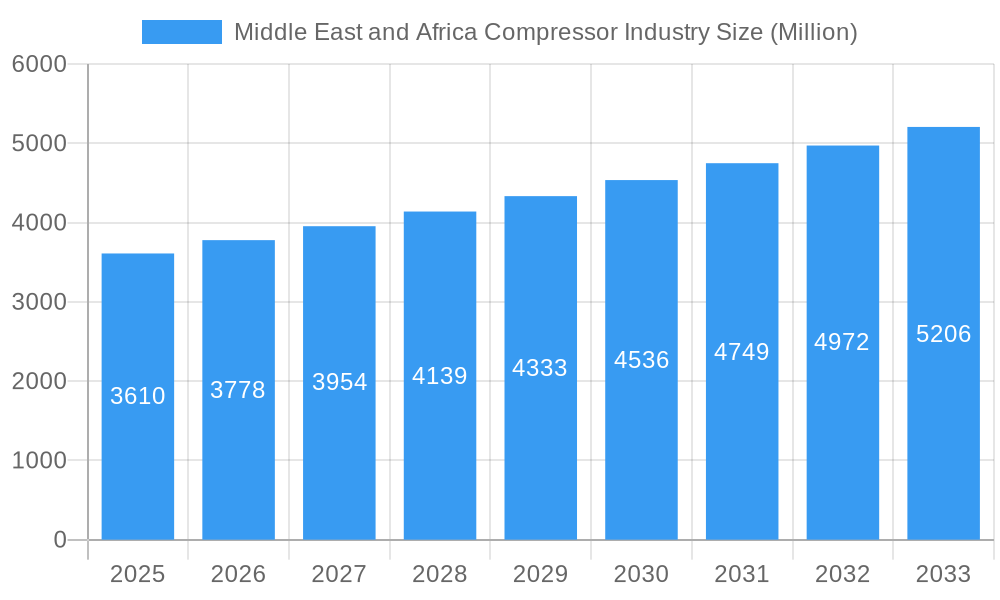
The Middle East and Africa compressor market, valued at $3.61 billion in 2025, is projected to experience robust growth, exceeding a compound annual growth rate (CAGR) of 4.59% from 2025 to 2033. This expansion is fueled by several key drivers. The burgeoning oil and gas industry, particularly in Saudi Arabia, the UAE, and Nigeria, necessitates sophisticated compression technologies for extraction, processing, and transportation. Simultaneously, the power sector's increasing reliance on natural gas and the expansion of renewable energy projects (requiring air compressors for construction and operation) are significant contributors to market growth. Furthermore, the manufacturing and chemical/petrochemical sectors, experiencing industrialization across the region, are driving demand for various compressor types, including positive displacement and dynamic compressors. Growth is further supported by government investments in infrastructure development and industrial diversification initiatives.
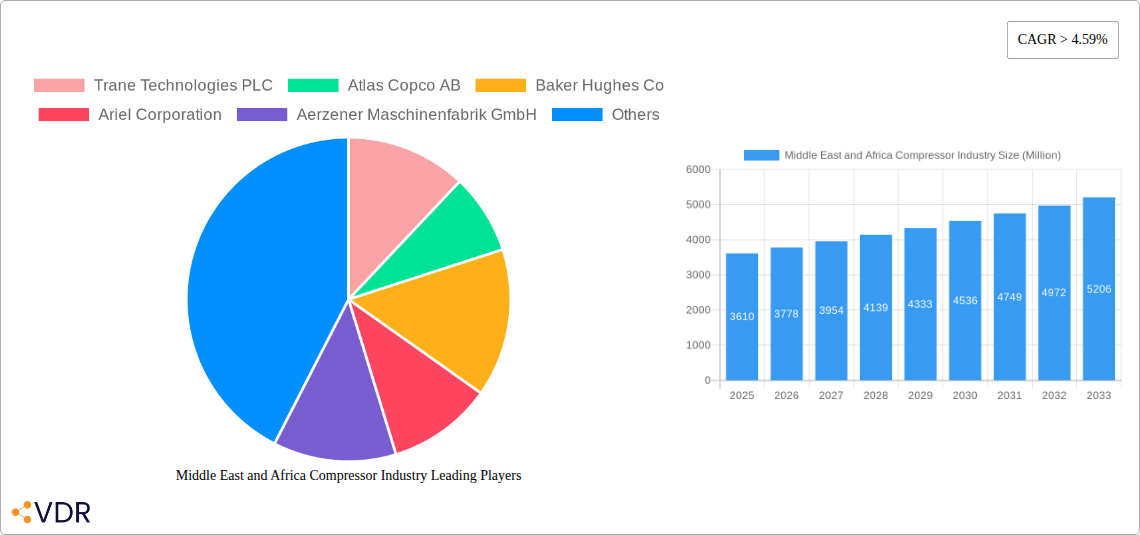
Middle East and Africa Compressor Industry Market Size (In Billion)
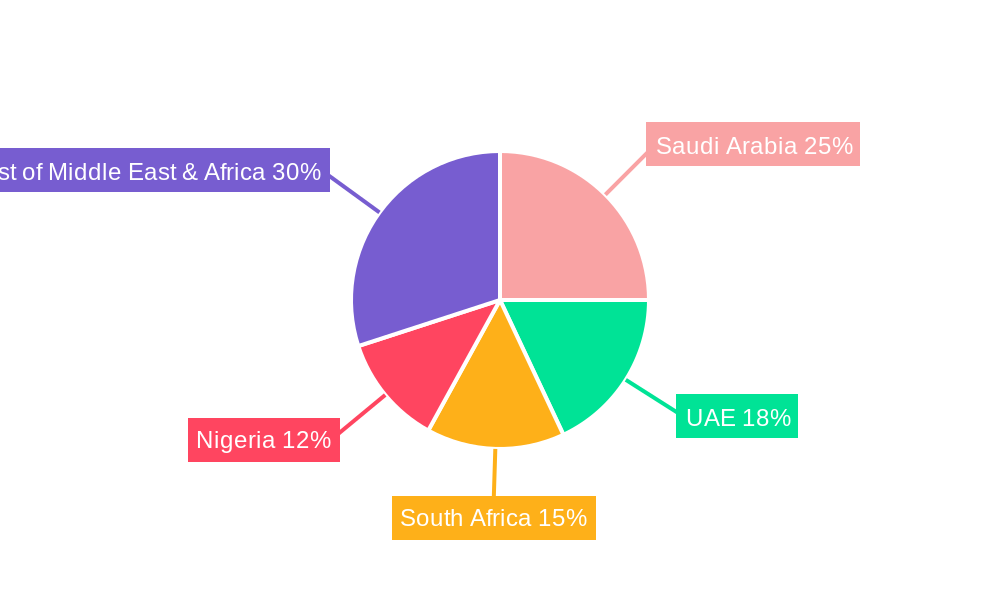
However, the market faces certain challenges. Fluctuations in global oil prices can impact investment in oil and gas related projects, potentially slowing down market growth. Furthermore, political instability in some regions may disrupt operations and deter investments. Nevertheless, the long-term outlook remains positive, driven by sustained economic growth and infrastructure development across the Middle East and Africa. The market segmentation, with significant contributions from Saudi Arabia, the UAE, and South Africa, showcases the regional disparities in development and infrastructure investment. While the "Rest of Middle East and Africa" segment displays considerable potential, unlocking this requires targeted strategies to address infrastructural gaps and promote sustainable industrial development. Major players like Trane Technologies, Atlas Copco, and Baker Hughes are vying for market share, employing competitive strategies focused on technological innovation and localized support.
Middle East and Africa Compressor Industry Company Market Share
Middle East & Africa Compressor Industry Market Report: 2019-2033
This comprehensive report provides an in-depth analysis of the Middle East and Africa compressor industry, offering invaluable insights for industry professionals, investors, and strategic planners. With a focus on market dynamics, growth trends, and key players, this report covers the period from 2019 to 2033, providing both historical data and future projections. The report segments the market by type (Positive Displacement, Dynamic), end-user (Oil and Gas Industry, Power Sector, Manufacturing Sector, Chemicals and Petrochemical Industry, Other End Users), and geography (Saudi Arabia, United Arab Emirates, South Africa, Nigeria, Rest of Middle East & Africa). Expect detailed analysis of market size (in Million units), CAGR, and market share for key players and segments.
Middle East and Africa Compressor Industry Market Dynamics & Structure
The Middle East and Africa compressor market is characterized by moderate concentration, with several multinational corporations holding significant market share. Technological innovation, driven by the need for energy efficiency and reduced emissions, is a key driver. Stringent regulatory frameworks concerning environmental protection influence product development and adoption. Competitive product substitutes, such as alternative energy sources, pose a challenge, while M&A activity remains relatively low compared to other regions.
- Market Concentration: The top 6 players account for approximately 64% of the market share in 2025.
- Technological Innovation: Focus on energy-efficient compressors and digitalization to improve monitoring and predictive maintenance.
- Regulatory Framework: Growing emphasis on environmental regulations pushes the adoption of eco-friendly compressors.
- Competitive Substitutes: The emergence of renewable energy sources presents a long-term challenge.
- M&A Activity: Relatively low M&A activity, with a predicted xx deals in the forecast period (2025-2033).
- End-User Demographics: Growth is largely driven by the Oil & Gas, Power, and Manufacturing sectors.
Middle East and Africa Compressor Industry Growth Trends & Insights
The Middle East and Africa compressor market experienced steady growth from 2019 to 2024, driven primarily by infrastructure development, industrialization, and the expansion of the oil and gas sector. The market is projected to continue its growth trajectory, albeit at a moderate pace, during the forecast period (2025-2033). Adoption rates are influenced by economic growth, technological advancements, and government initiatives. Technological disruptions, such as the increasing adoption of smart compressors, are reshaping the market landscape.
- Market Size: The market size in 2025 is estimated at xx Million units and is projected to reach xx Million units by 2033.
- CAGR: A projected CAGR of xx% is anticipated from 2025 to 2033.
- Market Penetration: The market penetration rate is xx% in 2025 and is expected to reach xx% by 2033.
- Technological Disruptions: Adoption of IoT-enabled compressors and predictive maintenance technologies is gaining momentum.
Dominant Regions, Countries, or Segments in Middle East and Africa Compressor Industry
The Oil and Gas industry remains the dominant end-user segment, followed by the Power and Manufacturing sectors. Among the countries, Saudi Arabia, the United Arab Emirates, and South Africa are the leading markets, driven by their robust economic growth and industrial activity. Positive displacement compressors represent a larger market share than dynamic compressors, due to higher demand from Oil & Gas and industrial applications.
- Leading Regions/Countries: Saudi Arabia, UAE, and South Africa.
- Leading Segment (End-User): Oil & Gas Industry.
- Leading Segment (Type): Positive Displacement Compressors.
- Key Drivers: Government investments in infrastructure projects, economic diversification strategies, and the growth of industrial sectors.
Middle East and Africa Compressor Industry Product Landscape
The Middle East and Africa compressor market offers a diverse range of products, catering to various industrial applications. The focus is on high-efficiency, reliable, and environmentally friendly compressors. Recent innovations include the integration of advanced control systems, digitalization for remote monitoring and predictive maintenance capabilities, and the development of smaller, lighter compressors for specialized applications. Key selling propositions include energy efficiency, reduced maintenance costs, and extended lifespan.
Key Drivers, Barriers & Challenges in Middle East and Africa Compressor Industry
Key Drivers: Increased industrialization and infrastructure development, expansion of the oil and gas sector, growing demand for energy-efficient solutions.
Challenges: Fluctuations in oil prices, political instability in certain regions, competition from established players, and potential supply chain disruptions. The impact of these challenges is estimated to reduce market growth by approximately xx% over the forecast period.
Emerging Opportunities in Middle East and Africa Compressor Industry
Significant opportunities exist in the renewable energy sector, particularly with the growing adoption of solar and wind power. Further market expansion can be achieved through penetration in developing countries and focusing on specialized industrial applications.
Growth Accelerators in the Middle East and Africa Compressor Industry
Technological advancements, including the development of energy-efficient and smart compressors, will fuel long-term growth. Strategic partnerships between manufacturers and end-users, coupled with government incentives for energy efficiency, will further accelerate market expansion.
Key Players Shaping the Middle East and Africa Compressor Industry Market
- Trane Technologies PLC
- Atlas Copco AB
- Baker Hughes Co
- Ariel Corporation
- Aerzener Maschinenfabrik GmbH
- Siemens AG
- Kaeser Kompressoren GmbH
- General Electric Company
- Mitsubishi Heavy Industries Ltd
Notable Milestones in Middle East and Africa Compressor Industry Sector
- Jul 2023: Integrated Air Solutions partners with ELGi, FS-Elliott, and ABC Compressors for comprehensive compressor solutions in South Africa. This signifies increased focus on after-sales services.
- Apr 2023: Baker Hughes secures a major order from Qatar Energy for the North Field South project, boosting demand for high-capacity compressors. This highlights the growing LNG sector's impact on the compressor market.
In-Depth Middle East and Africa Compressor Industry Market Outlook
The Middle East and Africa compressor market exhibits promising long-term growth potential, fueled by ongoing industrialization, infrastructure development, and the increasing demand for energy-efficient technologies. Strategic investments in research and development, coupled with strategic partnerships and effective marketing strategies, will further solidify market expansion and capture untapped opportunities in various sectors.
Middle East and Africa Compressor Industry Segmentation
-
1. Type
- 1.1. Positive Displacement
- 1.2. Dynamic
-
2. End User
- 2.1. Oil and Gas Industry
- 2.2. Power Sector
- 2.3. Manufacturing Sector
- 2.4. Chemicals and Petrochemical Industry
- 2.5. Other End Users
-
3. Middle-East and Africa
- 3.1. Saudi Arabia
- 3.2. United Arab Emirates
- 3.3. South Africa
- 3.4. Nigeria
- 3.5. Rest of Middle-East and Africa
Middle East and Africa Compressor Industry Segmentation By Geography
-
1. Middle East
- 1.1. Saudi Arabia
- 1.2. United Arab Emirates
- 1.3. Israel
- 1.4. Qatar
- 1.5. Kuwait
- 1.6. Oman
- 1.7. Bahrain
- 1.8. Jordan
- 1.9. Lebanon
Middle East and Africa Compressor Industry Regional Market Share
Geographic Coverage of Middle East and Africa Compressor Industry
Middle East and Africa Compressor Industry REPORT HIGHLIGHTS
| Aspects | Details |
|---|---|
| Study Period | 2020-2034 |
| Base Year | 2025 |
| Estimated Year | 2026 |
| Forecast Period | 2026-2034 |
| Historical Period | 2020-2025 |
| Growth Rate | CAGR of > 4.59% from 2020-2034 |
| Segmentation |
|
Table of Contents
- 1. Introduction
- 1.1. Research Scope
- 1.2. Market Segmentation
- 1.3. Research Objective
- 1.4. Definitions and Assumptions
- 2. Executive Summary
- 2.1. Market Snapshot
- 3. Market Dynamics
- 3.1. Market Drivers
- 3.2. Market Restrains
- 3.3. Market Trends
- 3.4. Market Opportunities
- 4. Market Factor Analysis
- 4.1. Porters Five Forces
- 4.1.1. Bargaining Power of Suppliers
- 4.1.2. Bargaining Power of Buyers
- 4.1.3. Threat of New Entrants
- 4.1.4. Threat of Substitutes
- 4.1.5. Competitive Rivalry
- 4.2. PESTEL analysis
- 4.3. BCG Analysis
- 4.3.1. Stars (High Growth, High Market Share)
- 4.3.2. Cash Cows (Low Growth, High Market Share)
- 4.3.3. Question Mark (High Growth, Low Market Share)
- 4.3.4. Dogs (Low Growth, Low Market Share)
- 4.4. Ansoff Matrix Analysis
- 4.5. Supply Chain Analysis
- 4.6. Regulatory Landscape
- 4.7. Current Market Potential and Opportunity Assessment (TAM–SAM–SOM Framework)
- 4.8. VDR Analyst Note
- 4.1. Porters Five Forces
- 5. Market Analysis, Insights and Forecast 2021-2033
- 5.1. Market Analysis, Insights and Forecast - by Type
- 5.1.1. Positive Displacement
- 5.1.2. Dynamic
- 5.2. Market Analysis, Insights and Forecast - by End User
- 5.2.1. Oil and Gas Industry
- 5.2.2. Power Sector
- 5.2.3. Manufacturing Sector
- 5.2.4. Chemicals and Petrochemical Industry
- 5.2.5. Other End Users
- 5.3. Market Analysis, Insights and Forecast - by Middle-East and Africa
- 5.3.1. Saudi Arabia
- 5.3.2. United Arab Emirates
- 5.3.3. South Africa
- 5.3.4. Nigeria
- 5.3.5. Rest of Middle-East and Africa
- 5.4. Market Analysis, Insights and Forecast - by Region
- 5.4.1. Middle East
- 5.1. Market Analysis, Insights and Forecast - by Type
- 6. Middle East and Africa Compressor Industry Analysis, Insights and Forecast, 2021-2033
- 6.1. Market Analysis, Insights and Forecast - by Type
- 6.1.1. Positive Displacement
- 6.1.2. Dynamic
- 6.2. Market Analysis, Insights and Forecast - by End User
- 6.2.1. Oil and Gas Industry
- 6.2.2. Power Sector
- 6.2.3. Manufacturing Sector
- 6.2.4. Chemicals and Petrochemical Industry
- 6.2.5. Other End Users
- 6.3. Market Analysis, Insights and Forecast - by Middle-East and Africa
- 6.3.1. Saudi Arabia
- 6.3.2. United Arab Emirates
- 6.3.3. South Africa
- 6.3.4. Nigeria
- 6.3.5. Rest of Middle-East and Africa
- 6.1. Market Analysis, Insights and Forecast - by Type
- 7. Competitive Analysis
- 7.1. Company Profiles
- 7.1.1 Trane Technologies PLC
- 7.1.1.1. Company Overview
- 7.1.1.2. Products
- 7.1.1.3. Company Financials
- 7.1.1.4. SWOT Analysis
- 7.1.2 Atlas Copco AB
- 7.1.2.1. Company Overview
- 7.1.2.2. Products
- 7.1.2.3. Company Financials
- 7.1.2.4. SWOT Analysis
- 7.1.3 Baker Hughes Co
- 7.1.3.1. Company Overview
- 7.1.3.2. Products
- 7.1.3.3. Company Financials
- 7.1.3.4. SWOT Analysis
- 7.1.4 Ariel Corporation
- 7.1.4.1. Company Overview
- 7.1.4.2. Products
- 7.1.4.3. Company Financials
- 7.1.4.4. SWOT Analysis
- 7.1.5 Aerzener Maschinenfabrik GmbH
- 7.1.5.1. Company Overview
- 7.1.5.2. Products
- 7.1.5.3. Company Financials
- 7.1.5.4. SWOT Analysis
- 7.1.6 Siemens AG
- 7.1.6.1. Company Overview
- 7.1.6.2. Products
- 7.1.6.3. Company Financials
- 7.1.6.4. SWOT Analysis
- 7.1.7 Kaeser Kompressoren GmbH*List Not Exhaustive 6 4 Market Shar
- 7.1.7.1. Company Overview
- 7.1.7.2. Products
- 7.1.7.3. Company Financials
- 7.1.7.4. SWOT Analysis
- 7.1.8 General Electric Company
- 7.1.8.1. Company Overview
- 7.1.8.2. Products
- 7.1.8.3. Company Financials
- 7.1.8.4. SWOT Analysis
- 7.1.9 Mitsubishi Heavy Industries Ltd
- 7.1.9.1. Company Overview
- 7.1.9.2. Products
- 7.1.9.3. Company Financials
- 7.1.9.4. SWOT Analysis
- 7.1.1 Trane Technologies PLC
- 7.2. Market Entropy
- 7.2.1 Company's Key Areas Served
- 7.2.2 Recent Developments
- 7.3. Company Market Share Analysis 2025
- 7.3.1 Top 5 Companies Market Share Analysis
- 7.3.2 Top 3 Companies Market Share Analysis
- 7.4. List of Potential Customers
- 8. Research Methodology
List of Figures
- Figure 1: Middle East and Africa Compressor Industry Revenue Breakdown (Million, %) by Product 2025 & 2033
- Figure 2: Middle East and Africa Compressor Industry Share (%) by Company 2025
List of Tables
- Table 1: Middle East and Africa Compressor Industry Revenue Million Forecast, by Type 2020 & 2033
- Table 2: Middle East and Africa Compressor Industry Volume K Units Forecast, by Type 2020 & 2033
- Table 3: Middle East and Africa Compressor Industry Revenue Million Forecast, by End User 2020 & 2033
- Table 4: Middle East and Africa Compressor Industry Volume K Units Forecast, by End User 2020 & 2033
- Table 5: Middle East and Africa Compressor Industry Revenue Million Forecast, by Middle-East and Africa 2020 & 2033
- Table 6: Middle East and Africa Compressor Industry Volume K Units Forecast, by Middle-East and Africa 2020 & 2033
- Table 7: Middle East and Africa Compressor Industry Revenue Million Forecast, by Region 2020 & 2033
- Table 8: Middle East and Africa Compressor Industry Volume K Units Forecast, by Region 2020 & 2033
- Table 9: Middle East and Africa Compressor Industry Revenue Million Forecast, by Type 2020 & 2033
- Table 10: Middle East and Africa Compressor Industry Volume K Units Forecast, by Type 2020 & 2033
- Table 11: Middle East and Africa Compressor Industry Revenue Million Forecast, by End User 2020 & 2033
- Table 12: Middle East and Africa Compressor Industry Volume K Units Forecast, by End User 2020 & 2033
- Table 13: Middle East and Africa Compressor Industry Revenue Million Forecast, by Middle-East and Africa 2020 & 2033
- Table 14: Middle East and Africa Compressor Industry Volume K Units Forecast, by Middle-East and Africa 2020 & 2033
- Table 15: Middle East and Africa Compressor Industry Revenue Million Forecast, by Country 2020 & 2033
- Table 16: Middle East and Africa Compressor Industry Volume K Units Forecast, by Country 2020 & 2033
- Table 17: Saudi Arabia Middle East and Africa Compressor Industry Revenue (Million) Forecast, by Application 2020 & 2033
- Table 18: Saudi Arabia Middle East and Africa Compressor Industry Volume (K Units) Forecast, by Application 2020 & 2033
- Table 19: United Arab Emirates Middle East and Africa Compressor Industry Revenue (Million) Forecast, by Application 2020 & 2033
- Table 20: United Arab Emirates Middle East and Africa Compressor Industry Volume (K Units) Forecast, by Application 2020 & 2033
- Table 21: Israel Middle East and Africa Compressor Industry Revenue (Million) Forecast, by Application 2020 & 2033
- Table 22: Israel Middle East and Africa Compressor Industry Volume (K Units) Forecast, by Application 2020 & 2033
- Table 23: Qatar Middle East and Africa Compressor Industry Revenue (Million) Forecast, by Application 2020 & 2033
- Table 24: Qatar Middle East and Africa Compressor Industry Volume (K Units) Forecast, by Application 2020 & 2033
- Table 25: Kuwait Middle East and Africa Compressor Industry Revenue (Million) Forecast, by Application 2020 & 2033
- Table 26: Kuwait Middle East and Africa Compressor Industry Volume (K Units) Forecast, by Application 2020 & 2033
- Table 27: Oman Middle East and Africa Compressor Industry Revenue (Million) Forecast, by Application 2020 & 2033
- Table 28: Oman Middle East and Africa Compressor Industry Volume (K Units) Forecast, by Application 2020 & 2033
- Table 29: Bahrain Middle East and Africa Compressor Industry Revenue (Million) Forecast, by Application 2020 & 2033
- Table 30: Bahrain Middle East and Africa Compressor Industry Volume (K Units) Forecast, by Application 2020 & 2033
- Table 31: Jordan Middle East and Africa Compressor Industry Revenue (Million) Forecast, by Application 2020 & 2033
- Table 32: Jordan Middle East and Africa Compressor Industry Volume (K Units) Forecast, by Application 2020 & 2033
- Table 33: Lebanon Middle East and Africa Compressor Industry Revenue (Million) Forecast, by Application 2020 & 2033
- Table 34: Lebanon Middle East and Africa Compressor Industry Volume (K Units) Forecast, by Application 2020 & 2033
Frequently Asked Questions
1. What is the projected Compound Annual Growth Rate (CAGR) of the Middle East and Africa Compressor Industry?
The projected CAGR is approximately > 4.59%.
2. Which companies are prominent players in the Middle East and Africa Compressor Industry?
Key companies in the market include Trane Technologies PLC, Atlas Copco AB, Baker Hughes Co, Ariel Corporation, Aerzener Maschinenfabrik GmbH, Siemens AG, Kaeser Kompressoren GmbH*List Not Exhaustive 6 4 Market Shar, General Electric Company, Mitsubishi Heavy Industries Ltd.
3. What are the main segments of the Middle East and Africa Compressor Industry?
The market segments include Type, End User, Middle-East and Africa.
4. Can you provide details about the market size?
The market size is estimated to be USD 3.61 Million as of 2022.
5. What are some drivers contributing to market growth?
4.; Growing Oil and Gas Industry4.; Rapid Growth in the Industrial Sector.
6. What are the notable trends driving market growth?
Oil and Gas Industry Segment Expected to Dominate the Market.
7. Are there any restraints impacting market growth?
4.; Fluctuation in Oil and Gas Prices.
8. Can you provide examples of recent developments in the market?
Jul 2023: Integrated Air Solutions announced that the company partnered with ELGi, FS-Elliott, and the local service agent for ABC Compressors to provide completed operations and maintenance solutions for their compressors in South Africa.
9. What pricing options are available for accessing the report?
Pricing options include single-user, multi-user, and enterprise licenses priced at USD 4750, USD 5250, and USD 8750 respectively.
10. Is the market size provided in terms of value or volume?
The market size is provided in terms of value, measured in Million and volume, measured in K Units.
11. Are there any specific market keywords associated with the report?
Yes, the market keyword associated with the report is "Middle East and Africa Compressor Industry," which aids in identifying and referencing the specific market segment covered.
12. How do I determine which pricing option suits my needs best?
The pricing options vary based on user requirements and access needs. Individual users may opt for single-user licenses, while businesses requiring broader access may choose multi-user or enterprise licenses for cost-effective access to the report.
13. Are there any additional resources or data provided in the Middle East and Africa Compressor Industry report?
While the report offers comprehensive insights, it's advisable to review the specific contents or supplementary materials provided to ascertain if additional resources or data are available.
14. How can I stay updated on further developments or reports in the Middle East and Africa Compressor Industry?
To stay informed about further developments, trends, and reports in the Middle East and Africa Compressor Industry, consider subscribing to industry newsletters, following relevant companies and organizations, or regularly checking reputable industry news sources and publications.
Methodology
Step 1 - Identification of Relevant Samples Size from Population Database


Step 2 - Approaches for Defining Global Market Size (Value, Volume* & Price*)

Note*: In applicable scenarios
Step 3 - Data Sources
Primary Research
- Web Analytics
- Survey Reports
- Research Institute
- Latest Research Reports
- Opinion Leaders
Secondary Research
- Annual Reports
- White Paper
- Latest Press Release
- Industry Association
- Paid Database
- Investor Presentations

Step 4 - Data Triangulation
Involves using different sources of information in order to increase the validity of a study
These sources are likely to be stakeholders in a program - participants, other researchers, program staff, other community members, and so on.
Then we put all data in single framework & apply various statistical tools to find out the dynamic on the market.
During the analysis stage, feedback from the stakeholder groups would be compared to determine areas of agreement as well as areas of divergence