

Key Insights
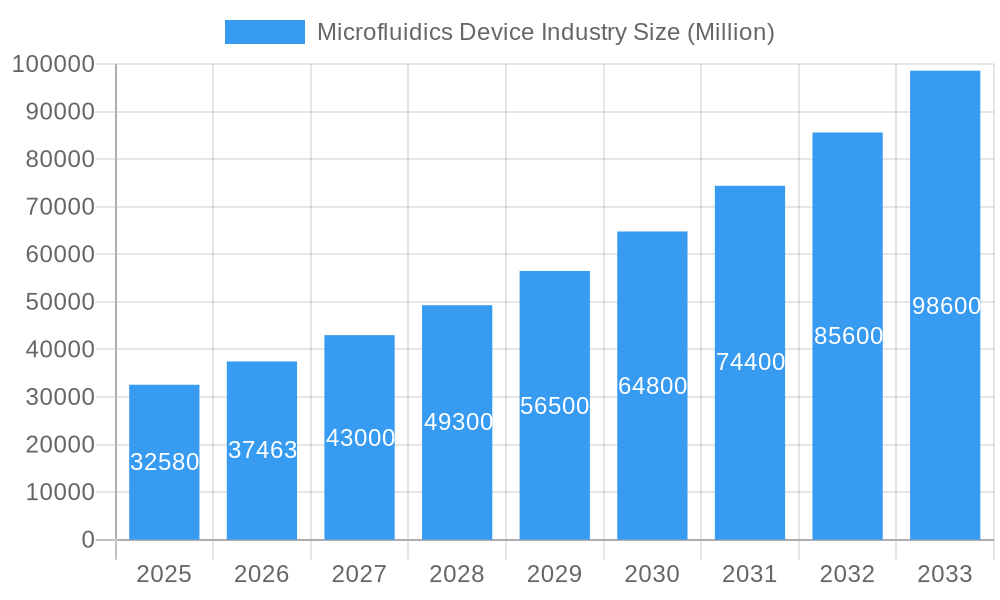
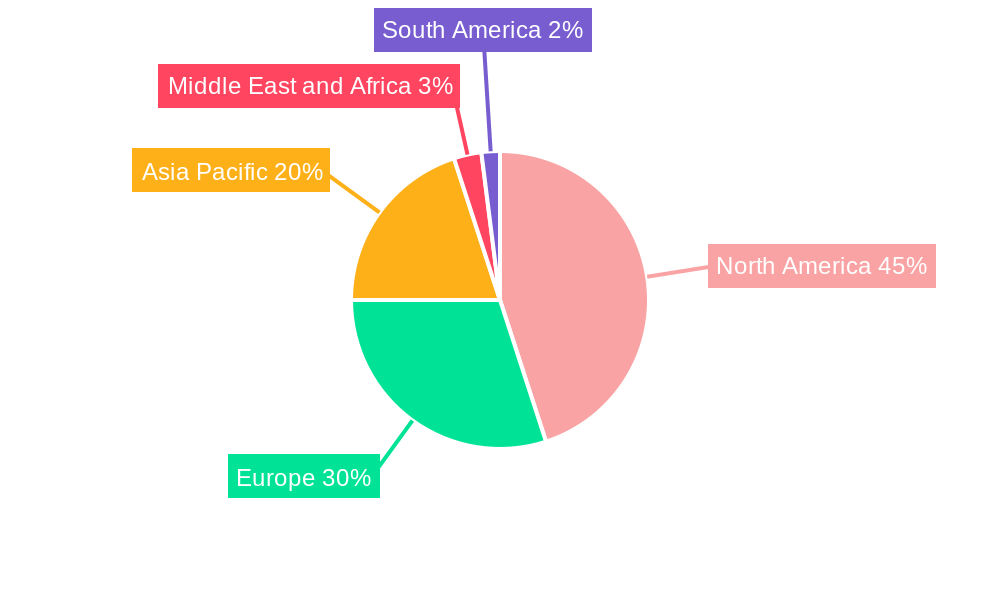
The global microfluidics device market is experiencing robust growth, projected to reach \$32.58 billion in 2025 and exhibiting a Compound Annual Growth Rate (CAGR) of 14.79% from 2025 to 2033. This expansion is fueled by several key drivers. The increasing prevalence of chronic diseases globally necessitates advanced diagnostic tools, driving demand for point-of-care diagnostics based on microfluidic technology. Simultaneously, the pharmaceutical and biotechnology sectors are heavily investing in microfluidic platforms for drug discovery, development, and high-throughput screening, accelerating market growth. Furthermore, technological advancements leading to miniaturization, improved functionality, and cost-effectiveness of microfluidic devices are expanding their applications across various sectors. The market is segmented by product type (microfluidic-based devices and components), application (drug delivery, point-of-care diagnostics, pharmaceutical and biotechnology research, clinical diagnostics, and other applications), and material (polymer, silicone, glass, and other materials). North America currently holds a significant market share due to strong R&D investments and the presence of major players, but the Asia-Pacific region is expected to witness substantial growth in the coming years, driven by rising healthcare expenditure and increasing adoption in emerging economies.
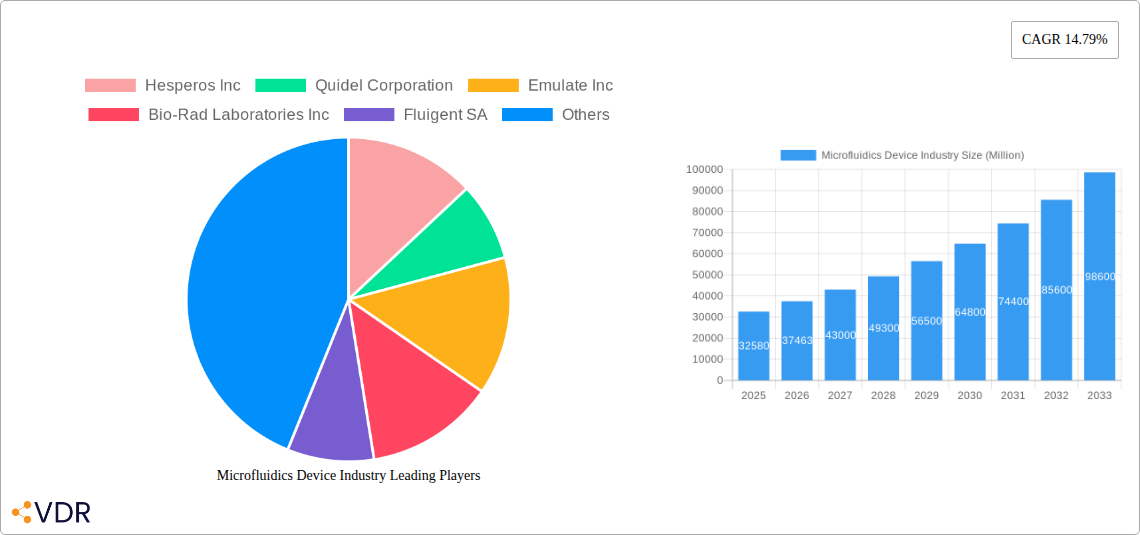
Microfluidics Device Industry Market Size (In Billion)
The competitive landscape comprises both established players like Bio-Rad Laboratories, Agilent Technologies, and Illumina, as well as emerging companies focusing on specialized applications. Strategic partnerships, collaborations, and acquisitions are expected to intensify, shaping the market dynamics. The restraints on market growth include the high initial investment costs associated with microfluidic device development and manufacturing, along with regulatory hurdles and the need for skilled personnel to operate and maintain these sophisticated systems. However, the continuous innovation in microfluidic technologies, coupled with decreasing costs and increasing accessibility, is anticipated to overcome these challenges and further propel market expansion over the forecast period. The increasing adoption of microfluidics in personalized medicine and other emerging fields promises to create further growth opportunities in the future, solidifying its position as a crucial technology in various scientific and healthcare sectors.
Microfluidics Device Industry Company Market Share
Microfluidics Device Industry Market Report: 2019-2033
This comprehensive report provides a detailed analysis of the Microfluidics Device industry, encompassing market dynamics, growth trends, regional segmentation, product landscape, and key players. The study period covers 2019-2033, with a base year of 2025 and a forecast period of 2025-2033. The report utilizes data from the historical period (2019-2024) to offer accurate predictions and valuable insights for industry professionals. The total market size in 2025 is estimated at xx Million units.
Microfluidics Device Industry Market Dynamics & Structure
The microfluidics device market is characterized by a moderately concentrated landscape, with several major players holding significant market share. Technological innovation, particularly in miniaturization and integration, is a key driver. Stringent regulatory frameworks, especially in healthcare applications, influence market growth. Competitive substitutes, such as conventional lab-on-a-chip technologies, pose a challenge. The end-user demographics are primarily comprised of pharmaceutical and biotechnology companies, research institutions, and diagnostic labs. M&A activity has been moderate, with xx deals recorded in the past five years, reflecting consolidation and expansion strategies.
- Market Concentration: Moderately concentrated, with top 5 players holding approximately xx% market share in 2025.
- Innovation Drivers: Miniaturization, automation, integration with other technologies (e.g., AI, IoT).
- Regulatory Landscape: Stringent regulations in healthcare applications (e.g., FDA approvals).
- Competitive Substitutes: Conventional lab-on-a-chip technologies.
- End-User Demographics: Pharmaceutical & biotech companies, research institutions, diagnostic labs.
- M&A Trends: xx M&A deals in the past five years, driven by consolidation and expansion.
Microfluidics Device Industry Growth Trends & Insights
The global microfluidics device market is experiencing robust growth, driven by increasing demand for point-of-care diagnostics, personalized medicine, and high-throughput screening in drug discovery. The market size is projected to reach xx Million units by 2033, exhibiting a CAGR of xx% during the forecast period. Technological advancements, such as the integration of microfluidics with other technologies, are further fueling market expansion. Adoption rates are increasing across various applications, reflecting the versatility and efficiency of microfluidic devices. Consumer behavior shifts towards faster, more accurate, and cost-effective diagnostics are bolstering market demand. This growth is further amplified by increasing government funding for research and development in the life sciences sector.
Dominant Regions, Countries, or Segments in Microfluidics Device Industry
North America currently dominates the microfluidics device market, followed by Europe, driven by robust research and development activities and early adoption of advanced technologies. Within the segments, the pharmaceutical and biotechnology research application holds the largest market share, followed by point-of-care diagnostics. Polymer materials dominate the material segment due to their cost-effectiveness and versatility. Strong growth is anticipated in Asia-Pacific due to rising healthcare expenditure and increasing investments in biotechnology.
- Leading Region: North America (xx% market share in 2025)
- Dominant Application: Pharmaceutical and Biotechnology Research (xx% market share in 2025)
- Leading Material: Polymer (xx% market share in 2025)
- Key Drivers: Strong R&D investments, high healthcare expenditure, favorable regulatory environment, and increasing government funding.
Microfluidics Device Industry Product Landscape
The microfluidics device market offers a diverse range of products, including microfluidic-based devices for various applications and microfluidic components like pumps, valves, and sensors. Recent innovations focus on improved sensitivity, miniaturization, portability, and integration with other analytical technologies. Unique selling propositions include increased throughput, reduced sample volume requirements, and cost-effectiveness. Advancements in material science, manufacturing processes, and software integration continue to improve device performance and expand applications.
Key Drivers, Barriers & Challenges in Microfluidics Device Industry
Key Drivers: Increasing demand for personalized medicine, point-of-care diagnostics, high-throughput screening, and automation in life sciences research. Advancements in material science, enabling the creation of more efficient and cost-effective devices. Government funding and support for R&D.
Challenges: High initial investment costs, complex manufacturing processes, stringent regulatory approvals, and competition from alternative technologies. Supply chain disruptions can also affect production and availability. These factors can cumulatively reduce market growth by an estimated xx% annually.
Emerging Opportunities in Microfluidics Device Industry
Emerging opportunities lie in the development of microfluidic devices for personalized medicine, rapid diagnostics, environmental monitoring, and food safety applications. Untapped markets in developing countries with increasing healthcare infrastructure present significant potential. The integration of microfluidics with artificial intelligence and machine learning offers exciting opportunities for enhanced data analysis and automation.
Growth Accelerators in the Microfluidics Device Industry
Long-term growth will be driven by technological breakthroughs in materials science and device miniaturization, coupled with strategic partnerships between microfluidics companies and pharmaceutical/biotech firms. Expansion into new applications and markets, particularly in developing economies, will fuel further expansion.
Key Players Shaping the Microfluidics Device Industry Market
- Hesperos Inc
- Quidel Corporation
- Emulate Inc
- Bio-Rad Laboratories Inc
- Fluigent SA
- ZEON CORPORATION
- Dolomite Microfluidics (Blacktrace Holdings Ltd)
- Micronit Microfluidics
- Biosurfit SA
- Bartels-Mikrotechnik
- Sphere Fluidics Limited
- Agilent Technologies Inc
- UFluidix
- PerkinElmer Inc
- Illumina Inc
- FluIdigm Corporation
- Nanomix Inc
Notable Milestones in Microfluidics Device Industry Sector
- November 2023: Microfluidics (IDEX MPT) launched a new processor for production-scale cell disruption, impacting vaccine and gene therapy manufacturing.
- January 2023: SCIEX launched the Intabio ZT system, a fully integrated microfluidic platform for protein analysis, enhancing capabilities in diagnostics and research.
In-Depth Microfluidics Device Industry Market Outlook
The future of the microfluidics device market is bright, with continued growth driven by technological advancements and expanding applications. Strategic partnerships, investments in R&D, and expansion into new markets will shape the industry's landscape. The market's potential is significant, with opportunities across various sectors and geographies.
Microfluidics Device Industry Segmentation
-
1. Product Type
- 1.1. Microfluidic-based Devices
-
1.2. Microfluidic Components
- 1.2.1. Microfluidic Chips
- 1.2.2. Micro Pumps
- 1.2.3. Microneedles
- 1.2.4. Other Product Types
-
2. Application
- 2.1. Drug Delivery
- 2.2. Point-of-care Diagnostics
- 2.3. Pharmaceutical and Biotechnology Research
-
3. Material
- 3.1. Polymer
- 3.2. Silicone
- 3.3. Glass
Microfluidics Device Industry Segmentation By Geography
-
1. North America
- 1.1. United States
- 1.2. Canada
- 1.3. Mexico
-
2. Europe
- 2.1. France
- 2.2. United Kingdom
- 2.3. Germany
- 2.4. Italy
- 2.5. Spain
- 2.6. Rest of Europe
-
3. Asia Pacific
- 3.1. China
- 3.2. Japan
- 3.3. India
- 3.4. Australia
- 3.5. South Korea
- 3.6. Rest of Asia Pacific
-
4. Middle East and Africa
- 4.1. GCC
- 4.2. South Africa
- 4.3. Rest of Middle East and Africa
-
5. South America
- 5.1. Brazil
- 5.2. Argentina
- 5.3. Rest of South America
Microfluidics Device Industry Regional Market Share
Geographic Coverage of Microfluidics Device Industry
Microfluidics Device Industry REPORT HIGHLIGHTS
| Aspects | Details |
|---|---|
| Study Period | 2020-2034 |
| Base Year | 2025 |
| Estimated Year | 2026 |
| Forecast Period | 2026-2034 |
| Historical Period | 2020-2025 |
| Growth Rate | CAGR of 14.79% from 2020-2034 |
| Segmentation |
|
Table of Contents
- 1. Introduction
- 1.1. Research Scope
- 1.2. Market Segmentation
- 1.3. Research Objective
- 1.4. Definitions and Assumptions
- 2. Executive Summary
- 2.1. Market Snapshot
- 3. Market Dynamics
- 3.1. Market Drivers
- 3.2. Market Restrains
- 3.3. Market Trends
- 3.4. Market Opportunities
- 4. Market Factor Analysis
- 4.1. Porters Five Forces
- 4.1.1. Bargaining Power of Suppliers
- 4.1.2. Bargaining Power of Buyers
- 4.1.3. Threat of New Entrants
- 4.1.4. Threat of Substitutes
- 4.1.5. Competitive Rivalry
- 4.2. PESTEL analysis
- 4.3. BCG Analysis
- 4.3.1. Stars (High Growth, High Market Share)
- 4.3.2. Cash Cows (Low Growth, High Market Share)
- 4.3.3. Question Mark (High Growth, Low Market Share)
- 4.3.4. Dogs (Low Growth, Low Market Share)
- 4.4. Ansoff Matrix Analysis
- 4.5. Supply Chain Analysis
- 4.6. Regulatory Landscape
- 4.7. Current Market Potential and Opportunity Assessment (TAM–SAM–SOM Framework)
- 4.8. VDR Analyst Note
- 4.1. Porters Five Forces
- 5. Market Analysis, Insights and Forecast 2021-2033
- 5.1. Market Analysis, Insights and Forecast - by Product Type
- 5.1.1. Microfluidic-based Devices
- 5.1.2. Microfluidic Components
- 5.1.2.1. Microfluidic Chips
- 5.1.2.2. Micro Pumps
- 5.1.2.3. Microneedles
- 5.1.2.4. Other Product Types
- 5.2. Market Analysis, Insights and Forecast - by Application
- 5.2.1. Drug Delivery
- 5.2.2. Point-of-care Diagnostics
- 5.2.3. Pharmaceutical and Biotechnology Research
- 5.3. Market Analysis, Insights and Forecast - by Material
- 5.3.1. Polymer
- 5.3.2. Silicone
- 5.3.3. Glass
- 5.4. Market Analysis, Insights and Forecast - by Region
- 5.4.1. North America
- 5.4.2. Europe
- 5.4.3. Asia Pacific
- 5.4.4. Middle East and Africa
- 5.4.5. South America
- 5.1. Market Analysis, Insights and Forecast - by Product Type
- 6. Global Microfluidics Device Industry Analysis, Insights and Forecast, 2021-2033
- 6.1. Market Analysis, Insights and Forecast - by Product Type
- 6.1.1. Microfluidic-based Devices
- 6.1.2. Microfluidic Components
- 6.1.2.1. Microfluidic Chips
- 6.1.2.2. Micro Pumps
- 6.1.2.3. Microneedles
- 6.1.2.4. Other Product Types
- 6.2. Market Analysis, Insights and Forecast - by Application
- 6.2.1. Drug Delivery
- 6.2.2. Point-of-care Diagnostics
- 6.2.3. Pharmaceutical and Biotechnology Research
- 6.3. Market Analysis, Insights and Forecast - by Material
- 6.3.1. Polymer
- 6.3.2. Silicone
- 6.3.3. Glass
- 6.1. Market Analysis, Insights and Forecast - by Product Type
- 7. North America Microfluidics Device Industry Analysis, Insights and Forecast, 2021-2033
- 7.1. Market Analysis, Insights and Forecast - by Product Type
- 7.1.1. Microfluidic-based Devices
- 7.1.2. Microfluidic Components
- 7.1.2.1. Microfluidic Chips
- 7.1.2.2. Micro Pumps
- 7.1.2.3. Microneedles
- 7.1.2.4. Other Product Types
- 7.2. Market Analysis, Insights and Forecast - by Application
- 7.2.1. Drug Delivery
- 7.2.2. Point-of-care Diagnostics
- 7.2.3. Pharmaceutical and Biotechnology Research
- 7.3. Market Analysis, Insights and Forecast - by Material
- 7.3.1. Polymer
- 7.3.2. Silicone
- 7.3.3. Glass
- 7.1. Market Analysis, Insights and Forecast - by Product Type
- 8. Europe Microfluidics Device Industry Analysis, Insights and Forecast, 2021-2033
- 8.1. Market Analysis, Insights and Forecast - by Product Type
- 8.1.1. Microfluidic-based Devices
- 8.1.2. Microfluidic Components
- 8.1.2.1. Microfluidic Chips
- 8.1.2.2. Micro Pumps
- 8.1.2.3. Microneedles
- 8.1.2.4. Other Product Types
- 8.2. Market Analysis, Insights and Forecast - by Application
- 8.2.1. Drug Delivery
- 8.2.2. Point-of-care Diagnostics
- 8.2.3. Pharmaceutical and Biotechnology Research
- 8.3. Market Analysis, Insights and Forecast - by Material
- 8.3.1. Polymer
- 8.3.2. Silicone
- 8.3.3. Glass
- 8.1. Market Analysis, Insights and Forecast - by Product Type
- 9. Asia Pacific Microfluidics Device Industry Analysis, Insights and Forecast, 2021-2033
- 9.1. Market Analysis, Insights and Forecast - by Product Type
- 9.1.1. Microfluidic-based Devices
- 9.1.2. Microfluidic Components
- 9.1.2.1. Microfluidic Chips
- 9.1.2.2. Micro Pumps
- 9.1.2.3. Microneedles
- 9.1.2.4. Other Product Types
- 9.2. Market Analysis, Insights and Forecast - by Application
- 9.2.1. Drug Delivery
- 9.2.2. Point-of-care Diagnostics
- 9.2.3. Pharmaceutical and Biotechnology Research
- 9.3. Market Analysis, Insights and Forecast - by Material
- 9.3.1. Polymer
- 9.3.2. Silicone
- 9.3.3. Glass
- 9.1. Market Analysis, Insights and Forecast - by Product Type
- 10. Middle East and Africa Microfluidics Device Industry Analysis, Insights and Forecast, 2021-2033
- 10.1. Market Analysis, Insights and Forecast - by Product Type
- 10.1.1. Microfluidic-based Devices
- 10.1.2. Microfluidic Components
- 10.1.2.1. Microfluidic Chips
- 10.1.2.2. Micro Pumps
- 10.1.2.3. Microneedles
- 10.1.2.4. Other Product Types
- 10.2. Market Analysis, Insights and Forecast - by Application
- 10.2.1. Drug Delivery
- 10.2.2. Point-of-care Diagnostics
- 10.2.3. Pharmaceutical and Biotechnology Research
- 10.3. Market Analysis, Insights and Forecast - by Material
- 10.3.1. Polymer
- 10.3.2. Silicone
- 10.3.3. Glass
- 10.1. Market Analysis, Insights and Forecast - by Product Type
- 11. South America Microfluidics Device Industry Analysis, Insights and Forecast, 2021-2033
- 11.1. Market Analysis, Insights and Forecast - by Product Type
- 11.1.1. Microfluidic-based Devices
- 11.1.2. Microfluidic Components
- 11.1.2.1. Microfluidic Chips
- 11.1.2.2. Micro Pumps
- 11.1.2.3. Microneedles
- 11.1.2.4. Other Product Types
- 11.2. Market Analysis, Insights and Forecast - by Application
- 11.2.1. Drug Delivery
- 11.2.2. Point-of-care Diagnostics
- 11.2.3. Pharmaceutical and Biotechnology Research
- 11.3. Market Analysis, Insights and Forecast - by Material
- 11.3.1. Polymer
- 11.3.2. Silicone
- 11.3.3. Glass
- 11.1. Market Analysis, Insights and Forecast - by Product Type
- 12. Competitive Analysis
- 12.1. Company Profiles
- 12.1.1 Hesperos Inc
- 12.1.1.1. Company Overview
- 12.1.1.2. Products
- 12.1.1.3. Company Financials
- 12.1.1.4. SWOT Analysis
- 12.1.2 Quidel Corporation
- 12.1.2.1. Company Overview
- 12.1.2.2. Products
- 12.1.2.3. Company Financials
- 12.1.2.4. SWOT Analysis
- 12.1.3 Emulate Inc
- 12.1.3.1. Company Overview
- 12.1.3.2. Products
- 12.1.3.3. Company Financials
- 12.1.3.4. SWOT Analysis
- 12.1.4 Bio-Rad Laboratories Inc
- 12.1.4.1. Company Overview
- 12.1.4.2. Products
- 12.1.4.3. Company Financials
- 12.1.4.4. SWOT Analysis
- 12.1.5 Fluigent SA
- 12.1.5.1. Company Overview
- 12.1.5.2. Products
- 12.1.5.3. Company Financials
- 12.1.5.4. SWOT Analysis
- 12.1.6 ZEON CORPORATION
- 12.1.6.1. Company Overview
- 12.1.6.2. Products
- 12.1.6.3. Company Financials
- 12.1.6.4. SWOT Analysis
- 12.1.7 Dolomite Microfluidics (Blacktrace Holdings Ltd)
- 12.1.7.1. Company Overview
- 12.1.7.2. Products
- 12.1.7.3. Company Financials
- 12.1.7.4. SWOT Analysis
- 12.1.8 Micronit Microfluidics
- 12.1.8.1. Company Overview
- 12.1.8.2. Products
- 12.1.8.3. Company Financials
- 12.1.8.4. SWOT Analysis
- 12.1.9 Biosurfit SA
- 12.1.9.1. Company Overview
- 12.1.9.2. Products
- 12.1.9.3. Company Financials
- 12.1.9.4. SWOT Analysis
- 12.1.10 Bartels-Mikrotechnik
- 12.1.10.1. Company Overview
- 12.1.10.2. Products
- 12.1.10.3. Company Financials
- 12.1.10.4. SWOT Analysis
- 12.1.11 Sphere Fluidics Limited
- 12.1.11.1. Company Overview
- 12.1.11.2. Products
- 12.1.11.3. Company Financials
- 12.1.11.4. SWOT Analysis
- 12.1.12 Agilent Technologies Inc
- 12.1.12.1. Company Overview
- 12.1.12.2. Products
- 12.1.12.3. Company Financials
- 12.1.12.4. SWOT Analysis
- 12.1.13 UFluidix
- 12.1.13.1. Company Overview
- 12.1.13.2. Products
- 12.1.13.3. Company Financials
- 12.1.13.4. SWOT Analysis
- 12.1.14 PerkinElmer Inc
- 12.1.14.1. Company Overview
- 12.1.14.2. Products
- 12.1.14.3. Company Financials
- 12.1.14.4. SWOT Analysis
- 12.1.15 Illumina Inc
- 12.1.15.1. Company Overview
- 12.1.15.2. Products
- 12.1.15.3. Company Financials
- 12.1.15.4. SWOT Analysis
- 12.1.16 FluIdigm Corporation
- 12.1.16.1. Company Overview
- 12.1.16.2. Products
- 12.1.16.3. Company Financials
- 12.1.16.4. SWOT Analysis
- 12.1.17 Nanomix Inc
- 12.1.17.1. Company Overview
- 12.1.17.2. Products
- 12.1.17.3. Company Financials
- 12.1.17.4. SWOT Analysis
- 12.1.1 Hesperos Inc
- 12.2. Market Entropy
- 12.2.1 Company's Key Areas Served
- 12.2.2 Recent Developments
- 12.3. Company Market Share Analysis 2025
- 12.3.1 Top 5 Companies Market Share Analysis
- 12.3.2 Top 3 Companies Market Share Analysis
- 12.4. List of Potential Customers
- 13. Research Methodology
List of Figures
- Figure 1: Global Microfluidics Device Industry Revenue Breakdown (Million, %) by Region 2025 & 2033
- Figure 2: Global Microfluidics Device Industry Volume Breakdown (K Unit, %) by Region 2025 & 2033
- Figure 3: North America Microfluidics Device Industry Revenue (Million), by Product Type 2025 & 2033
- Figure 4: North America Microfluidics Device Industry Volume (K Unit), by Product Type 2025 & 2033
- Figure 5: North America Microfluidics Device Industry Revenue Share (%), by Product Type 2025 & 2033
- Figure 6: North America Microfluidics Device Industry Volume Share (%), by Product Type 2025 & 2033
- Figure 7: North America Microfluidics Device Industry Revenue (Million), by Application 2025 & 2033
- Figure 8: North America Microfluidics Device Industry Volume (K Unit), by Application 2025 & 2033
- Figure 9: North America Microfluidics Device Industry Revenue Share (%), by Application 2025 & 2033
- Figure 10: North America Microfluidics Device Industry Volume Share (%), by Application 2025 & 2033
- Figure 11: North America Microfluidics Device Industry Revenue (Million), by Material 2025 & 2033
- Figure 12: North America Microfluidics Device Industry Volume (K Unit), by Material 2025 & 2033
- Figure 13: North America Microfluidics Device Industry Revenue Share (%), by Material 2025 & 2033
- Figure 14: North America Microfluidics Device Industry Volume Share (%), by Material 2025 & 2033
- Figure 15: North America Microfluidics Device Industry Revenue (Million), by Country 2025 & 2033
- Figure 16: North America Microfluidics Device Industry Volume (K Unit), by Country 2025 & 2033
- Figure 17: North America Microfluidics Device Industry Revenue Share (%), by Country 2025 & 2033
- Figure 18: North America Microfluidics Device Industry Volume Share (%), by Country 2025 & 2033
- Figure 19: Europe Microfluidics Device Industry Revenue (Million), by Product Type 2025 & 2033
- Figure 20: Europe Microfluidics Device Industry Volume (K Unit), by Product Type 2025 & 2033
- Figure 21: Europe Microfluidics Device Industry Revenue Share (%), by Product Type 2025 & 2033
- Figure 22: Europe Microfluidics Device Industry Volume Share (%), by Product Type 2025 & 2033
- Figure 23: Europe Microfluidics Device Industry Revenue (Million), by Application 2025 & 2033
- Figure 24: Europe Microfluidics Device Industry Volume (K Unit), by Application 2025 & 2033
- Figure 25: Europe Microfluidics Device Industry Revenue Share (%), by Application 2025 & 2033
- Figure 26: Europe Microfluidics Device Industry Volume Share (%), by Application 2025 & 2033
- Figure 27: Europe Microfluidics Device Industry Revenue (Million), by Material 2025 & 2033
- Figure 28: Europe Microfluidics Device Industry Volume (K Unit), by Material 2025 & 2033
- Figure 29: Europe Microfluidics Device Industry Revenue Share (%), by Material 2025 & 2033
- Figure 30: Europe Microfluidics Device Industry Volume Share (%), by Material 2025 & 2033
- Figure 31: Europe Microfluidics Device Industry Revenue (Million), by Country 2025 & 2033
- Figure 32: Europe Microfluidics Device Industry Volume (K Unit), by Country 2025 & 2033
- Figure 33: Europe Microfluidics Device Industry Revenue Share (%), by Country 2025 & 2033
- Figure 34: Europe Microfluidics Device Industry Volume Share (%), by Country 2025 & 2033
- Figure 35: Asia Pacific Microfluidics Device Industry Revenue (Million), by Product Type 2025 & 2033
- Figure 36: Asia Pacific Microfluidics Device Industry Volume (K Unit), by Product Type 2025 & 2033
- Figure 37: Asia Pacific Microfluidics Device Industry Revenue Share (%), by Product Type 2025 & 2033
- Figure 38: Asia Pacific Microfluidics Device Industry Volume Share (%), by Product Type 2025 & 2033
- Figure 39: Asia Pacific Microfluidics Device Industry Revenue (Million), by Application 2025 & 2033
- Figure 40: Asia Pacific Microfluidics Device Industry Volume (K Unit), by Application 2025 & 2033
- Figure 41: Asia Pacific Microfluidics Device Industry Revenue Share (%), by Application 2025 & 2033
- Figure 42: Asia Pacific Microfluidics Device Industry Volume Share (%), by Application 2025 & 2033
- Figure 43: Asia Pacific Microfluidics Device Industry Revenue (Million), by Material 2025 & 2033
- Figure 44: Asia Pacific Microfluidics Device Industry Volume (K Unit), by Material 2025 & 2033
- Figure 45: Asia Pacific Microfluidics Device Industry Revenue Share (%), by Material 2025 & 2033
- Figure 46: Asia Pacific Microfluidics Device Industry Volume Share (%), by Material 2025 & 2033
- Figure 47: Asia Pacific Microfluidics Device Industry Revenue (Million), by Country 2025 & 2033
- Figure 48: Asia Pacific Microfluidics Device Industry Volume (K Unit), by Country 2025 & 2033
- Figure 49: Asia Pacific Microfluidics Device Industry Revenue Share (%), by Country 2025 & 2033
- Figure 50: Asia Pacific Microfluidics Device Industry Volume Share (%), by Country 2025 & 2033
- Figure 51: Middle East and Africa Microfluidics Device Industry Revenue (Million), by Product Type 2025 & 2033
- Figure 52: Middle East and Africa Microfluidics Device Industry Volume (K Unit), by Product Type 2025 & 2033
- Figure 53: Middle East and Africa Microfluidics Device Industry Revenue Share (%), by Product Type 2025 & 2033
- Figure 54: Middle East and Africa Microfluidics Device Industry Volume Share (%), by Product Type 2025 & 2033
- Figure 55: Middle East and Africa Microfluidics Device Industry Revenue (Million), by Application 2025 & 2033
- Figure 56: Middle East and Africa Microfluidics Device Industry Volume (K Unit), by Application 2025 & 2033
- Figure 57: Middle East and Africa Microfluidics Device Industry Revenue Share (%), by Application 2025 & 2033
- Figure 58: Middle East and Africa Microfluidics Device Industry Volume Share (%), by Application 2025 & 2033
- Figure 59: Middle East and Africa Microfluidics Device Industry Revenue (Million), by Material 2025 & 2033
- Figure 60: Middle East and Africa Microfluidics Device Industry Volume (K Unit), by Material 2025 & 2033
- Figure 61: Middle East and Africa Microfluidics Device Industry Revenue Share (%), by Material 2025 & 2033
- Figure 62: Middle East and Africa Microfluidics Device Industry Volume Share (%), by Material 2025 & 2033
- Figure 63: Middle East and Africa Microfluidics Device Industry Revenue (Million), by Country 2025 & 2033
- Figure 64: Middle East and Africa Microfluidics Device Industry Volume (K Unit), by Country 2025 & 2033
- Figure 65: Middle East and Africa Microfluidics Device Industry Revenue Share (%), by Country 2025 & 2033
- Figure 66: Middle East and Africa Microfluidics Device Industry Volume Share (%), by Country 2025 & 2033
- Figure 67: South America Microfluidics Device Industry Revenue (Million), by Product Type 2025 & 2033
- Figure 68: South America Microfluidics Device Industry Volume (K Unit), by Product Type 2025 & 2033
- Figure 69: South America Microfluidics Device Industry Revenue Share (%), by Product Type 2025 & 2033
- Figure 70: South America Microfluidics Device Industry Volume Share (%), by Product Type 2025 & 2033
- Figure 71: South America Microfluidics Device Industry Revenue (Million), by Application 2025 & 2033
- Figure 72: South America Microfluidics Device Industry Volume (K Unit), by Application 2025 & 2033
- Figure 73: South America Microfluidics Device Industry Revenue Share (%), by Application 2025 & 2033
- Figure 74: South America Microfluidics Device Industry Volume Share (%), by Application 2025 & 2033
- Figure 75: South America Microfluidics Device Industry Revenue (Million), by Material 2025 & 2033
- Figure 76: South America Microfluidics Device Industry Volume (K Unit), by Material 2025 & 2033
- Figure 77: South America Microfluidics Device Industry Revenue Share (%), by Material 2025 & 2033
- Figure 78: South America Microfluidics Device Industry Volume Share (%), by Material 2025 & 2033
- Figure 79: South America Microfluidics Device Industry Revenue (Million), by Country 2025 & 2033
- Figure 80: South America Microfluidics Device Industry Volume (K Unit), by Country 2025 & 2033
- Figure 81: South America Microfluidics Device Industry Revenue Share (%), by Country 2025 & 2033
- Figure 82: South America Microfluidics Device Industry Volume Share (%), by Country 2025 & 2033
List of Tables
- Table 1: Global Microfluidics Device Industry Revenue Million Forecast, by Product Type 2020 & 2033
- Table 2: Global Microfluidics Device Industry Volume K Unit Forecast, by Product Type 2020 & 2033
- Table 3: Global Microfluidics Device Industry Revenue Million Forecast, by Application 2020 & 2033
- Table 4: Global Microfluidics Device Industry Volume K Unit Forecast, by Application 2020 & 2033
- Table 5: Global Microfluidics Device Industry Revenue Million Forecast, by Material 2020 & 2033
- Table 6: Global Microfluidics Device Industry Volume K Unit Forecast, by Material 2020 & 2033
- Table 7: Global Microfluidics Device Industry Revenue Million Forecast, by Region 2020 & 2033
- Table 8: Global Microfluidics Device Industry Volume K Unit Forecast, by Region 2020 & 2033
- Table 9: Global Microfluidics Device Industry Revenue Million Forecast, by Product Type 2020 & 2033
- Table 10: Global Microfluidics Device Industry Volume K Unit Forecast, by Product Type 2020 & 2033
- Table 11: Global Microfluidics Device Industry Revenue Million Forecast, by Application 2020 & 2033
- Table 12: Global Microfluidics Device Industry Volume K Unit Forecast, by Application 2020 & 2033
- Table 13: Global Microfluidics Device Industry Revenue Million Forecast, by Material 2020 & 2033
- Table 14: Global Microfluidics Device Industry Volume K Unit Forecast, by Material 2020 & 2033
- Table 15: Global Microfluidics Device Industry Revenue Million Forecast, by Country 2020 & 2033
- Table 16: Global Microfluidics Device Industry Volume K Unit Forecast, by Country 2020 & 2033
- Table 17: United States Microfluidics Device Industry Revenue (Million) Forecast, by Application 2020 & 2033
- Table 18: United States Microfluidics Device Industry Volume (K Unit) Forecast, by Application 2020 & 2033
- Table 19: Canada Microfluidics Device Industry Revenue (Million) Forecast, by Application 2020 & 2033
- Table 20: Canada Microfluidics Device Industry Volume (K Unit) Forecast, by Application 2020 & 2033
- Table 21: Mexico Microfluidics Device Industry Revenue (Million) Forecast, by Application 2020 & 2033
- Table 22: Mexico Microfluidics Device Industry Volume (K Unit) Forecast, by Application 2020 & 2033
- Table 23: Global Microfluidics Device Industry Revenue Million Forecast, by Product Type 2020 & 2033
- Table 24: Global Microfluidics Device Industry Volume K Unit Forecast, by Product Type 2020 & 2033
- Table 25: Global Microfluidics Device Industry Revenue Million Forecast, by Application 2020 & 2033
- Table 26: Global Microfluidics Device Industry Volume K Unit Forecast, by Application 2020 & 2033
- Table 27: Global Microfluidics Device Industry Revenue Million Forecast, by Material 2020 & 2033
- Table 28: Global Microfluidics Device Industry Volume K Unit Forecast, by Material 2020 & 2033
- Table 29: Global Microfluidics Device Industry Revenue Million Forecast, by Country 2020 & 2033
- Table 30: Global Microfluidics Device Industry Volume K Unit Forecast, by Country 2020 & 2033
- Table 31: France Microfluidics Device Industry Revenue (Million) Forecast, by Application 2020 & 2033
- Table 32: France Microfluidics Device Industry Volume (K Unit) Forecast, by Application 2020 & 2033
- Table 33: United Kingdom Microfluidics Device Industry Revenue (Million) Forecast, by Application 2020 & 2033
- Table 34: United Kingdom Microfluidics Device Industry Volume (K Unit) Forecast, by Application 2020 & 2033
- Table 35: Germany Microfluidics Device Industry Revenue (Million) Forecast, by Application 2020 & 2033
- Table 36: Germany Microfluidics Device Industry Volume (K Unit) Forecast, by Application 2020 & 2033
- Table 37: Italy Microfluidics Device Industry Revenue (Million) Forecast, by Application 2020 & 2033
- Table 38: Italy Microfluidics Device Industry Volume (K Unit) Forecast, by Application 2020 & 2033
- Table 39: Spain Microfluidics Device Industry Revenue (Million) Forecast, by Application 2020 & 2033
- Table 40: Spain Microfluidics Device Industry Volume (K Unit) Forecast, by Application 2020 & 2033
- Table 41: Rest of Europe Microfluidics Device Industry Revenue (Million) Forecast, by Application 2020 & 2033
- Table 42: Rest of Europe Microfluidics Device Industry Volume (K Unit) Forecast, by Application 2020 & 2033
- Table 43: Global Microfluidics Device Industry Revenue Million Forecast, by Product Type 2020 & 2033
- Table 44: Global Microfluidics Device Industry Volume K Unit Forecast, by Product Type 2020 & 2033
- Table 45: Global Microfluidics Device Industry Revenue Million Forecast, by Application 2020 & 2033
- Table 46: Global Microfluidics Device Industry Volume K Unit Forecast, by Application 2020 & 2033
- Table 47: Global Microfluidics Device Industry Revenue Million Forecast, by Material 2020 & 2033
- Table 48: Global Microfluidics Device Industry Volume K Unit Forecast, by Material 2020 & 2033
- Table 49: Global Microfluidics Device Industry Revenue Million Forecast, by Country 2020 & 2033
- Table 50: Global Microfluidics Device Industry Volume K Unit Forecast, by Country 2020 & 2033
- Table 51: China Microfluidics Device Industry Revenue (Million) Forecast, by Application 2020 & 2033
- Table 52: China Microfluidics Device Industry Volume (K Unit) Forecast, by Application 2020 & 2033
- Table 53: Japan Microfluidics Device Industry Revenue (Million) Forecast, by Application 2020 & 2033
- Table 54: Japan Microfluidics Device Industry Volume (K Unit) Forecast, by Application 2020 & 2033
- Table 55: India Microfluidics Device Industry Revenue (Million) Forecast, by Application 2020 & 2033
- Table 56: India Microfluidics Device Industry Volume (K Unit) Forecast, by Application 2020 & 2033
- Table 57: Australia Microfluidics Device Industry Revenue (Million) Forecast, by Application 2020 & 2033
- Table 58: Australia Microfluidics Device Industry Volume (K Unit) Forecast, by Application 2020 & 2033
- Table 59: South Korea Microfluidics Device Industry Revenue (Million) Forecast, by Application 2020 & 2033
- Table 60: South Korea Microfluidics Device Industry Volume (K Unit) Forecast, by Application 2020 & 2033
- Table 61: Rest of Asia Pacific Microfluidics Device Industry Revenue (Million) Forecast, by Application 2020 & 2033
- Table 62: Rest of Asia Pacific Microfluidics Device Industry Volume (K Unit) Forecast, by Application 2020 & 2033
- Table 63: Global Microfluidics Device Industry Revenue Million Forecast, by Product Type 2020 & 2033
- Table 64: Global Microfluidics Device Industry Volume K Unit Forecast, by Product Type 2020 & 2033
- Table 65: Global Microfluidics Device Industry Revenue Million Forecast, by Application 2020 & 2033
- Table 66: Global Microfluidics Device Industry Volume K Unit Forecast, by Application 2020 & 2033
- Table 67: Global Microfluidics Device Industry Revenue Million Forecast, by Material 2020 & 2033
- Table 68: Global Microfluidics Device Industry Volume K Unit Forecast, by Material 2020 & 2033
- Table 69: Global Microfluidics Device Industry Revenue Million Forecast, by Country 2020 & 2033
- Table 70: Global Microfluidics Device Industry Volume K Unit Forecast, by Country 2020 & 2033
- Table 71: GCC Microfluidics Device Industry Revenue (Million) Forecast, by Application 2020 & 2033
- Table 72: GCC Microfluidics Device Industry Volume (K Unit) Forecast, by Application 2020 & 2033
- Table 73: South Africa Microfluidics Device Industry Revenue (Million) Forecast, by Application 2020 & 2033
- Table 74: South Africa Microfluidics Device Industry Volume (K Unit) Forecast, by Application 2020 & 2033
- Table 75: Rest of Middle East and Africa Microfluidics Device Industry Revenue (Million) Forecast, by Application 2020 & 2033
- Table 76: Rest of Middle East and Africa Microfluidics Device Industry Volume (K Unit) Forecast, by Application 2020 & 2033
- Table 77: Global Microfluidics Device Industry Revenue Million Forecast, by Product Type 2020 & 2033
- Table 78: Global Microfluidics Device Industry Volume K Unit Forecast, by Product Type 2020 & 2033
- Table 79: Global Microfluidics Device Industry Revenue Million Forecast, by Application 2020 & 2033
- Table 80: Global Microfluidics Device Industry Volume K Unit Forecast, by Application 2020 & 2033
- Table 81: Global Microfluidics Device Industry Revenue Million Forecast, by Material 2020 & 2033
- Table 82: Global Microfluidics Device Industry Volume K Unit Forecast, by Material 2020 & 2033
- Table 83: Global Microfluidics Device Industry Revenue Million Forecast, by Country 2020 & 2033
- Table 84: Global Microfluidics Device Industry Volume K Unit Forecast, by Country 2020 & 2033
- Table 85: Brazil Microfluidics Device Industry Revenue (Million) Forecast, by Application 2020 & 2033
- Table 86: Brazil Microfluidics Device Industry Volume (K Unit) Forecast, by Application 2020 & 2033
- Table 87: Argentina Microfluidics Device Industry Revenue (Million) Forecast, by Application 2020 & 2033
- Table 88: Argentina Microfluidics Device Industry Volume (K Unit) Forecast, by Application 2020 & 2033
- Table 89: Rest of South America Microfluidics Device Industry Revenue (Million) Forecast, by Application 2020 & 2033
- Table 90: Rest of South America Microfluidics Device Industry Volume (K Unit) Forecast, by Application 2020 & 2033
Frequently Asked Questions
1. What is the projected Compound Annual Growth Rate (CAGR) of the Microfluidics Device Industry?
The projected CAGR is approximately 14.79%.
2. Which companies are prominent players in the Microfluidics Device Industry?
Key companies in the market include Hesperos Inc, Quidel Corporation, Emulate Inc, Bio-Rad Laboratories Inc, Fluigent SA, ZEON CORPORATION, Dolomite Microfluidics (Blacktrace Holdings Ltd), Micronit Microfluidics, Biosurfit SA, Bartels-Mikrotechnik, Sphere Fluidics Limited, Agilent Technologies Inc, UFluidix, PerkinElmer Inc, Illumina Inc, FluIdigm Corporation, Nanomix Inc.
3. What are the main segments of the Microfluidics Device Industry?
The market segments include Product Type, Application, Material.
4. Can you provide details about the market size?
The market size is estimated to be USD 32.58 Million as of 2022.
5. What are some drivers contributing to market growth?
Increasing Demand for Point-of-care Testing; Increasing Incidences of Various Diseases; Faster Turn-around Time for Analysis and Improved Portability of Devices.
6. What are the notable trends driving market growth?
The Point-of-Care Diagnostics Segment is Expected to Witness Considerable Growth During the Forecast Period.
7. Are there any restraints impacting market growth?
Integration of Microfluidics Technology with Existing Workflows; Low Adoption in Developing Countries Due to High Prices.
8. Can you provide examples of recent developments in the market?
November 2023: Microfluidics, a unit of IDEX Material Processing Technology (MPT), launched Microfluidics’ newest processor, which is designed for production scale cell disruption, which is used in the manufacturing of many biological products such as antigens for vaccines and viral vectors that deliver genes for next-generation gene therapy.
9. What pricing options are available for accessing the report?
Pricing options include single-user, multi-user, and enterprise licenses priced at USD 4750, USD 5250, and USD 8750 respectively.
10. Is the market size provided in terms of value or volume?
The market size is provided in terms of value, measured in Million and volume, measured in K Unit.
11. Are there any specific market keywords associated with the report?
Yes, the market keyword associated with the report is "Microfluidics Device Industry," which aids in identifying and referencing the specific market segment covered.
12. How do I determine which pricing option suits my needs best?
The pricing options vary based on user requirements and access needs. Individual users may opt for single-user licenses, while businesses requiring broader access may choose multi-user or enterprise licenses for cost-effective access to the report.
13. Are there any additional resources or data provided in the Microfluidics Device Industry report?
While the report offers comprehensive insights, it's advisable to review the specific contents or supplementary materials provided to ascertain if additional resources or data are available.
14. How can I stay updated on further developments or reports in the Microfluidics Device Industry?
To stay informed about further developments, trends, and reports in the Microfluidics Device Industry, consider subscribing to industry newsletters, following relevant companies and organizations, or regularly checking reputable industry news sources and publications.
Methodology
Step 1 - Identification of Relevant Samples Size from Population Database


Step 2 - Approaches for Defining Global Market Size (Value, Volume* & Price*)

Note*: In applicable scenarios
Step 3 - Data Sources
Primary Research
- Web Analytics
- Survey Reports
- Research Institute
- Latest Research Reports
- Opinion Leaders
Secondary Research
- Annual Reports
- White Paper
- Latest Press Release
- Industry Association
- Paid Database
- Investor Presentations

Step 4 - Data Triangulation
Involves using different sources of information in order to increase the validity of a study
These sources are likely to be stakeholders in a program - participants, other researchers, program staff, other community members, and so on.
Then we put all data in single framework & apply various statistical tools to find out the dynamic on the market.
During the analysis stage, feedback from the stakeholder groups would be compared to determine areas of agreement as well as areas of divergence