
Key Insights
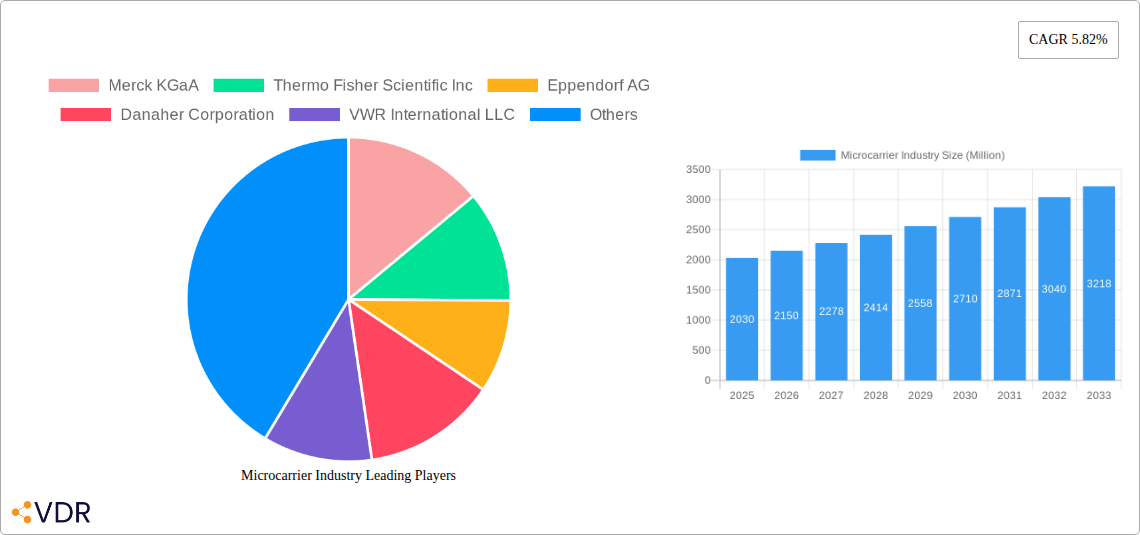
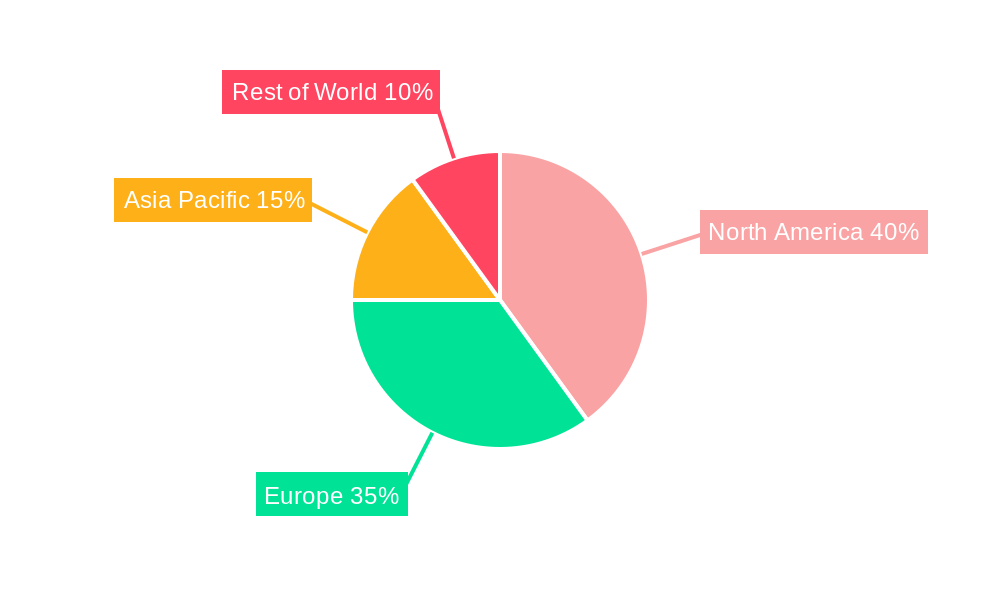
The global microcarrier market, valued at $2.03 billion in 2025, is projected to experience robust growth, driven by the increasing demand for cell-based therapies and advancements in vaccine manufacturing. A Compound Annual Growth Rate (CAGR) of 5.82% is anticipated from 2025 to 2033, indicating a significant market expansion. Key drivers include the rising prevalence of chronic diseases necessitating cell-based therapies, the growing adoption of innovative vaccine technologies, and ongoing research and development in biopharmaceutical manufacturing. The market segmentation reveals a significant portion dominated by Alginate-based and Collagen-based microcarriers due to their biocompatibility and suitability for various cell types. The Cell Therapy application segment is expected to lead the market, followed by Vaccine Manufacturing, reflecting the burgeoning biopharmaceutical industry. Geographic analysis suggests North America and Europe currently hold substantial market shares, attributed to well-established biopharmaceutical infrastructure and regulatory frameworks. However, the Asia-Pacific region is poised for significant growth, driven by increasing investments in biotechnology and rising healthcare expenditure. Competitive landscape analysis indicates key players like Merck KGaA, Thermo Fisher Scientific, and Sartorius AG are leveraging their established positions and technological capabilities to further strengthen their market dominance. While the market faces restraints such as high production costs and regulatory complexities, the overall outlook remains positive, fueled by continuous innovation and expanding applications in regenerative medicine and personalized therapies. The market is further expected to see growth spurred by technological advancements such as the development of novel materials with enhanced biocompatibility and improved cell attachment properties.
The forecast period (2025-2033) suggests a continued upward trajectory for the microcarrier market, influenced by several factors including increasing research funding for cell therapies, growing demand for personalized medicines, and the potential for microcarriers in emerging therapeutic areas such as gene therapy and immunotherapy. The market is expected to see consolidation among key players through mergers, acquisitions, and strategic partnerships, further shaping the competitive landscape. Furthermore, continuous advancements in manufacturing technologies are anticipated to improve efficiency and reduce production costs, fostering broader accessibility and adoption of microcarrier-based technologies. The emergence of novel materials and improved manufacturing processes will cater to the growing need for efficient, scalable, and cost-effective biomanufacturing solutions. This will drive wider adoption across diverse sectors, including academic research institutions and smaller biotech companies.
Microcarrier Industry Market Report: 2019-2033
This comprehensive report provides an in-depth analysis of the global microcarrier industry, encompassing market dynamics, growth trends, competitive landscape, and future outlook. With a study period spanning 2019-2033, a base year of 2025, and an estimated and forecast period of 2025-2033, this report is an essential resource for industry professionals, investors, and researchers seeking to understand this rapidly evolving market. The report segments the market by material type (Alginate-Based, Collagen-Based, Dextran-Based, Polystyrene-Based, Others) and application (Cell Therapy, Vaccine Manufacturing, Other Applications). The total market size is projected to reach xx Million units by 2033.
Microcarrier Industry Market Dynamics & Structure
The microcarrier industry is characterized by moderate concentration, with key players such as Merck KGaA, Thermo Fisher Scientific Inc., Eppendorf AG, Danaher Corporation, VWR International LLC, Lonza Group Ltd, and Sartorius AG holding significant market share. Technological innovation, particularly in biomaterial development and cell culture optimization, is a primary growth driver. Stringent regulatory frameworks, particularly concerning biopharmaceutical manufacturing, influence market dynamics. Competitive substitutes include traditional cell culture methods, but microcarriers offer advantages in scalability and efficiency. The end-user demographics primarily comprise pharmaceutical and biotechnology companies engaged in cell therapy, vaccine manufacturing, and other biopharmaceutical applications. M&A activity has been relatively moderate in recent years, with xx major deals recorded between 2019 and 2024, representing a combined value of xx Million units.
- Market Concentration: Moderately concentrated, with top 7 players holding approximately 65% market share in 2024.
- Technological Innovation: Focus on biocompatible materials, improved surface functionalities, and automated cell culture systems.
- Regulatory Framework: Stringent GMP (Good Manufacturing Practices) regulations impacting manufacturing processes and product approvals.
- Competitive Substitutes: Traditional cell culture methods pose a competitive threat, but their scalability limitations favor microcarrier adoption.
- M&A Activity: xx major deals between 2019-2024, signaling consolidation and expansion strategies within the industry.
Microcarrier Industry Growth Trends & Insights
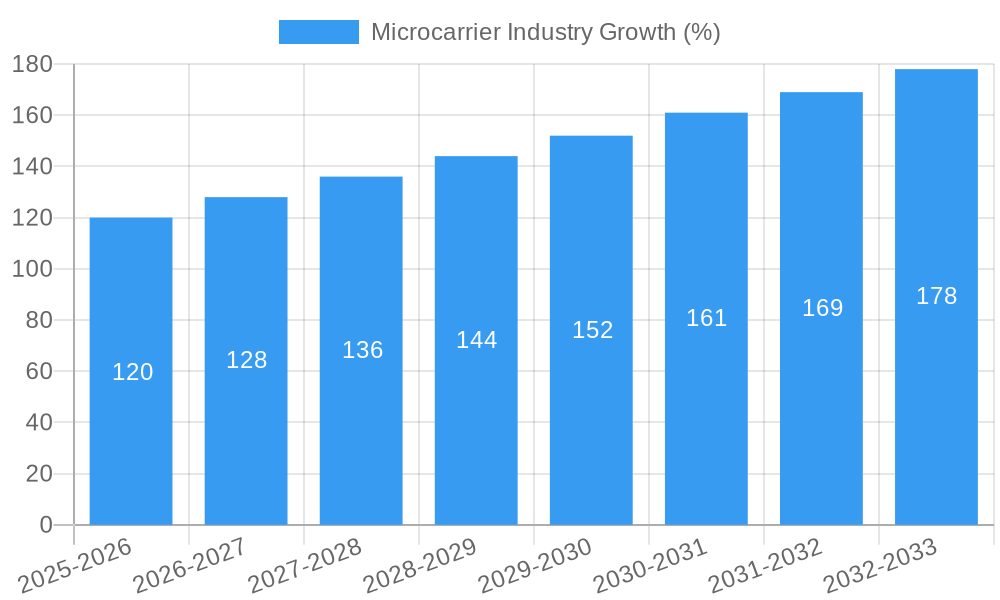
The global microcarrier market experienced robust growth during the historical period (2019-2024), driven by increasing demand for cell-based therapies and vaccines. The market size expanded from xx Million units in 2019 to xx Million units in 2024, registering a CAGR of xx%. This growth is projected to continue during the forecast period (2025-2033), with a projected CAGR of xx%, reaching xx Million units by 2033. This growth is fueled by technological advancements leading to improved cell yields, reduced production costs, and the expansion of cell therapy and vaccine development. The increasing adoption of personalized medicine and the growing prevalence of chronic diseases are additional factors driving market expansion. Consumer behavior shifts towards advanced therapies are positively influencing market demand. Technological disruptions, including automation and process intensification, are enhancing efficiency and scalability.
Dominant Regions, Countries, or Segments in Microcarrier Industry
North America currently dominates the microcarrier market, driven by robust pharmaceutical and biotechnology sectors, substantial investments in R&D, and favorable regulatory frameworks. Within material types, polystyrene-based microcarriers hold the largest market share due to their cost-effectiveness and established usage. Cell therapy applications are the leading segment, reflecting the booming cell and gene therapy industry. Europe and Asia-Pacific are also experiencing significant growth, fueled by increasing healthcare spending and technological advancements.
- North America Dominance: Strong pharmaceutical and biotech industries, substantial R&D investments, and favorable regulatory environment.
- Polystyrene-Based Microcarriers: Largest market share due to cost-effectiveness and established usage.
- Cell Therapy Application: Leading segment due to the rapid expansion of the cell and gene therapy market.
- Emerging Markets: Asia-Pacific and Europe experiencing significant growth potential due to increasing healthcare expenditure and technology adoption.
Microcarrier Industry Product Landscape
The microcarrier market offers a range of products, from standard polystyrene beads to advanced biocompatible materials like alginate and collagen. Innovations focus on improving cell attachment, enhancing cell growth, and simplifying downstream processing. Performance metrics include cell yield, viability, and product quality. Unique selling propositions often emphasize biocompatibility, scalability, and ease of use. Recent advancements include the development of novel surface modifications to promote specific cell types and microcarriers designed for automated cell culture systems.
Key Drivers, Barriers & Challenges in Microcarrier Industry
Key Drivers:
- Increasing demand for cell-based therapies and vaccines.
- Technological advancements in biomaterial development and cell culture optimization.
- Growing investments in R&D within the pharmaceutical and biotechnology industries.
Key Challenges:
- High manufacturing costs and regulatory hurdles for novel materials.
- Limited availability of skilled personnel in advanced cell culture techniques.
- Intense competition among established players and emerging companies. This leads to pressure on pricing and margins. The impact of this pressure is estimated at a 3% reduction in average industry profit margins.
Emerging Opportunities in Microcarrier Industry
Emerging opportunities include expansion into new therapeutic areas, such as regenerative medicine and immunotherapy. Development of novel biomaterials with enhanced performance characteristics and integration of microcarriers into automated cell culture systems represent significant growth avenues. The increasing adoption of personalized medicine offers further opportunities for customized microcarrier solutions. Untapped markets in developing countries present substantial growth potential as healthcare infrastructure improves.
Growth Accelerators in the Microcarrier Industry
Strategic partnerships between microcarrier manufacturers and pharmaceutical companies are accelerating market expansion. Technological breakthroughs in biomaterial design and process automation are improving efficiency and scalability, further fueling growth. Expansion into emerging markets and new applications, such as tissue engineering, contributes to long-term growth potential. Government initiatives promoting cell-based therapies also play a significant role.
Key Players Shaping the Microcarrier Industry Market
- Merck KGaA (Merck KGaA)
- Thermo Fisher Scientific Inc. (Thermo Fisher Scientific Inc.)
- Eppendorf AG (Eppendorf AG)
- Danaher Corporation (Danaher Corporation)
- VWR International LLC (VWR International LLC)
- Lonza Group Ltd (Lonza Group Ltd)
- Sartorius AG (Sartorius AG)
Notable Milestones in Microcarrier Industry Sector
- 2020: Launch of a novel alginate-based microcarrier by Lonza Group Ltd, enhancing cell attachment efficiency.
- 2021: Merck KGaA acquired a smaller microcarrier manufacturer, expanding its product portfolio.
- 2022: Thermo Fisher Scientific Inc. introduced an automated cell culture system integrating microcarrier technology.
- 2023: Sartorius AG released a new collagen-based microcarrier, optimized for stem cell expansion.
- 2024: Regulatory approval for a new polystyrene-based microcarrier in major markets.
In-Depth Microcarrier Industry Market Outlook
The future of the microcarrier industry is bright, driven by continuous innovation in biomaterials, automation, and expanding applications within the cell therapy and vaccine manufacturing sectors. Strategic partnerships and investments in R&D are poised to accelerate growth. The market is expected to continue its expansion, presenting lucrative opportunities for established players and emerging companies alike. The focus on personalized medicine and advanced therapies ensures continued demand for innovative microcarrier solutions in the years to come.
Microcarrier Industry Segmentation
-
1. Material Type
- 1.1. Alginate-Based
- 1.2. Collagen-Based
- 1.3. Dextran-Based
- 1.4. Polystyrene-Based
- 1.5. Others
-
2. Application
- 2.1. Cell Therapy
- 2.2. Vaccine Manufacturing
- 2.3. Other Applications
Microcarrier Industry Segmentation By Geography
-
1. North America
- 1.1. United States
- 1.2. Canada
- 1.3. Mexico
-
2. Europe
- 2.1. Germany
- 2.2. United Kingdom
- 2.3. France
- 2.4. Italy
- 2.5. Spain
- 2.6. Rest of Europe
-
3. Asia Pacific
- 3.1. China
- 3.2. Japan
- 3.3. India
- 3.4. Australia
- 3.5. South Korea
- 3.6. Rest of Asia Pacific
-
4. Middle East and Africa
- 4.1. GCC
- 4.2. South Africa
- 4.3. Rest of Middle East and Africa
-
5. South America
- 5.1. Brazil
- 5.2. Argentina
- 5.3. Rest of South America
Microcarrier Industry REPORT HIGHLIGHTS
| Aspects | Details |
|---|---|
| Study Period | 2019-2033 |
| Base Year | 2024 |
| Estimated Year | 2025 |
| Forecast Period | 2025-2033 |
| Historical Period | 2019-2024 |
| Growth Rate | CAGR of 5.82% from 2019-2033 |
| Segmentation |
|
Table of Contents
- 1. Introduction
- 1.1. Research Scope
- 1.2. Market Segmentation
- 1.3. Research Methodology
- 1.4. Definitions and Assumptions
- 2. Executive Summary
- 2.1. Introduction
- 3. Market Dynamics
- 3.1. Introduction
- 3.2. Market Drivers
- 3.2.1. ; Rising Demand for Cell-based Vaccines and Therapeutics; Rapid Growth of Biologics and Biosimilar Industry; Increasing R&D and Availability of Funding for Cell Therapy Research
- 3.3. Market Restrains
- 3.3.1. ; High Cost of Biologics and Cell-based Therapies; Possible Drawbacks of Microcarrier Cultures
- 3.4. Market Trends
- 3.4.1 Cell Therapy is Expected to Show Fastest Growth by Application
- 3.4.2 Over the Forecast Period
- 4. Market Factor Analysis
- 4.1. Porters Five Forces
- 4.2. Supply/Value Chain
- 4.3. PESTEL analysis
- 4.4. Market Entropy
- 4.5. Patent/Trademark Analysis
- 5. Global Microcarrier Industry Analysis, Insights and Forecast, 2019-2031
- 5.1. Market Analysis, Insights and Forecast - by Material Type
- 5.1.1. Alginate-Based
- 5.1.2. Collagen-Based
- 5.1.3. Dextran-Based
- 5.1.4. Polystyrene-Based
- 5.1.5. Others
- 5.2. Market Analysis, Insights and Forecast - by Application
- 5.2.1. Cell Therapy
- 5.2.2. Vaccine Manufacturing
- 5.2.3. Other Applications
- 5.3. Market Analysis, Insights and Forecast - by Region
- 5.3.1. North America
- 5.3.2. Europe
- 5.3.3. Asia Pacific
- 5.3.4. Middle East and Africa
- 5.3.5. South America
- 5.1. Market Analysis, Insights and Forecast - by Material Type
- 6. North America Microcarrier Industry Analysis, Insights and Forecast, 2019-2031
- 6.1. Market Analysis, Insights and Forecast - by Material Type
- 6.1.1. Alginate-Based
- 6.1.2. Collagen-Based
- 6.1.3. Dextran-Based
- 6.1.4. Polystyrene-Based
- 6.1.5. Others
- 6.2. Market Analysis, Insights and Forecast - by Application
- 6.2.1. Cell Therapy
- 6.2.2. Vaccine Manufacturing
- 6.2.3. Other Applications
- 6.1. Market Analysis, Insights and Forecast - by Material Type
- 7. Europe Microcarrier Industry Analysis, Insights and Forecast, 2019-2031
- 7.1. Market Analysis, Insights and Forecast - by Material Type
- 7.1.1. Alginate-Based
- 7.1.2. Collagen-Based
- 7.1.3. Dextran-Based
- 7.1.4. Polystyrene-Based
- 7.1.5. Others
- 7.2. Market Analysis, Insights and Forecast - by Application
- 7.2.1. Cell Therapy
- 7.2.2. Vaccine Manufacturing
- 7.2.3. Other Applications
- 7.1. Market Analysis, Insights and Forecast - by Material Type
- 8. Asia Pacific Microcarrier Industry Analysis, Insights and Forecast, 2019-2031
- 8.1. Market Analysis, Insights and Forecast - by Material Type
- 8.1.1. Alginate-Based
- 8.1.2. Collagen-Based
- 8.1.3. Dextran-Based
- 8.1.4. Polystyrene-Based
- 8.1.5. Others
- 8.2. Market Analysis, Insights and Forecast - by Application
- 8.2.1. Cell Therapy
- 8.2.2. Vaccine Manufacturing
- 8.2.3. Other Applications
- 8.1. Market Analysis, Insights and Forecast - by Material Type
- 9. Middle East and Africa Microcarrier Industry Analysis, Insights and Forecast, 2019-2031
- 9.1. Market Analysis, Insights and Forecast - by Material Type
- 9.1.1. Alginate-Based
- 9.1.2. Collagen-Based
- 9.1.3. Dextran-Based
- 9.1.4. Polystyrene-Based
- 9.1.5. Others
- 9.2. Market Analysis, Insights and Forecast - by Application
- 9.2.1. Cell Therapy
- 9.2.2. Vaccine Manufacturing
- 9.2.3. Other Applications
- 9.1. Market Analysis, Insights and Forecast - by Material Type
- 10. South America Microcarrier Industry Analysis, Insights and Forecast, 2019-2031
- 10.1. Market Analysis, Insights and Forecast - by Material Type
- 10.1.1. Alginate-Based
- 10.1.2. Collagen-Based
- 10.1.3. Dextran-Based
- 10.1.4. Polystyrene-Based
- 10.1.5. Others
- 10.2. Market Analysis, Insights and Forecast - by Application
- 10.2.1. Cell Therapy
- 10.2.2. Vaccine Manufacturing
- 10.2.3. Other Applications
- 10.1. Market Analysis, Insights and Forecast - by Material Type
- 11. North America Microcarrier Industry Analysis, Insights and Forecast, 2019-2031
- 11.1. Market Analysis, Insights and Forecast - By Country/Sub-region
- 11.1.1 United States
- 11.1.2 Canada
- 11.1.3 Mexico
- 12. Europe Microcarrier Industry Analysis, Insights and Forecast, 2019-2031
- 12.1. Market Analysis, Insights and Forecast - By Country/Sub-region
- 12.1.1 Germany
- 12.1.2 United Kingdom
- 12.1.3 France
- 12.1.4 Italy
- 12.1.5 Spain
- 12.1.6 Rest of Europe
- 13. Asia Pacific Microcarrier Industry Analysis, Insights and Forecast, 2019-2031
- 13.1. Market Analysis, Insights and Forecast - By Country/Sub-region
- 13.1.1 China
- 13.1.2 Japan
- 13.1.3 India
- 13.1.4 Australia
- 13.1.5 South Korea
- 13.1.6 Rest of Asia Pacific
- 14. Middle East and Africa Microcarrier Industry Analysis, Insights and Forecast, 2019-2031
- 14.1. Market Analysis, Insights and Forecast - By Country/Sub-region
- 14.1.1 GCC
- 14.1.2 South Africa
- 14.1.3 Rest of Middle East and Africa
- 15. South America Microcarrier Industry Analysis, Insights and Forecast, 2019-2031
- 15.1. Market Analysis, Insights and Forecast - By Country/Sub-region
- 15.1.1 Brazil
- 15.1.2 Argentina
- 15.1.3 Rest of South America
- 16. Competitive Analysis
- 16.1. Global Market Share Analysis 2024
- 16.2. Company Profiles
- 16.2.1 Merck KGaA
- 16.2.1.1. Overview
- 16.2.1.2. Products
- 16.2.1.3. SWOT Analysis
- 16.2.1.4. Recent Developments
- 16.2.1.5. Financials (Based on Availability)
- 16.2.2 Thermo Fisher Scientific Inc
- 16.2.2.1. Overview
- 16.2.2.2. Products
- 16.2.2.3. SWOT Analysis
- 16.2.2.4. Recent Developments
- 16.2.2.5. Financials (Based on Availability)
- 16.2.3 Eppendorf AG
- 16.2.3.1. Overview
- 16.2.3.2. Products
- 16.2.3.3. SWOT Analysis
- 16.2.3.4. Recent Developments
- 16.2.3.5. Financials (Based on Availability)
- 16.2.4 Danaher Corporation
- 16.2.4.1. Overview
- 16.2.4.2. Products
- 16.2.4.3. SWOT Analysis
- 16.2.4.4. Recent Developments
- 16.2.4.5. Financials (Based on Availability)
- 16.2.5 VWR International LLC
- 16.2.5.1. Overview
- 16.2.5.2. Products
- 16.2.5.3. SWOT Analysis
- 16.2.5.4. Recent Developments
- 16.2.5.5. Financials (Based on Availability)
- 16.2.6 Lonza Group Ltd
- 16.2.6.1. Overview
- 16.2.6.2. Products
- 16.2.6.3. SWOT Analysis
- 16.2.6.4. Recent Developments
- 16.2.6.5. Financials (Based on Availability)
- 16.2.7 Sartorius AG
- 16.2.7.1. Overview
- 16.2.7.2. Products
- 16.2.7.3. SWOT Analysis
- 16.2.7.4. Recent Developments
- 16.2.7.5. Financials (Based on Availability)
- 16.2.1 Merck KGaA
List of Figures
- Figure 1: Global Microcarrier Industry Revenue Breakdown (Million, %) by Region 2024 & 2032
- Figure 2: North America Microcarrier Industry Revenue (Million), by Country 2024 & 2032
- Figure 3: North America Microcarrier Industry Revenue Share (%), by Country 2024 & 2032
- Figure 4: Europe Microcarrier Industry Revenue (Million), by Country 2024 & 2032
- Figure 5: Europe Microcarrier Industry Revenue Share (%), by Country 2024 & 2032
- Figure 6: Asia Pacific Microcarrier Industry Revenue (Million), by Country 2024 & 2032
- Figure 7: Asia Pacific Microcarrier Industry Revenue Share (%), by Country 2024 & 2032
- Figure 8: Middle East and Africa Microcarrier Industry Revenue (Million), by Country 2024 & 2032
- Figure 9: Middle East and Africa Microcarrier Industry Revenue Share (%), by Country 2024 & 2032
- Figure 10: South America Microcarrier Industry Revenue (Million), by Country 2024 & 2032
- Figure 11: South America Microcarrier Industry Revenue Share (%), by Country 2024 & 2032
- Figure 12: North America Microcarrier Industry Revenue (Million), by Material Type 2024 & 2032
- Figure 13: North America Microcarrier Industry Revenue Share (%), by Material Type 2024 & 2032
- Figure 14: North America Microcarrier Industry Revenue (Million), by Application 2024 & 2032
- Figure 15: North America Microcarrier Industry Revenue Share (%), by Application 2024 & 2032
- Figure 16: North America Microcarrier Industry Revenue (Million), by Country 2024 & 2032
- Figure 17: North America Microcarrier Industry Revenue Share (%), by Country 2024 & 2032
- Figure 18: Europe Microcarrier Industry Revenue (Million), by Material Type 2024 & 2032
- Figure 19: Europe Microcarrier Industry Revenue Share (%), by Material Type 2024 & 2032
- Figure 20: Europe Microcarrier Industry Revenue (Million), by Application 2024 & 2032
- Figure 21: Europe Microcarrier Industry Revenue Share (%), by Application 2024 & 2032
- Figure 22: Europe Microcarrier Industry Revenue (Million), by Country 2024 & 2032
- Figure 23: Europe Microcarrier Industry Revenue Share (%), by Country 2024 & 2032
- Figure 24: Asia Pacific Microcarrier Industry Revenue (Million), by Material Type 2024 & 2032
- Figure 25: Asia Pacific Microcarrier Industry Revenue Share (%), by Material Type 2024 & 2032
- Figure 26: Asia Pacific Microcarrier Industry Revenue (Million), by Application 2024 & 2032
- Figure 27: Asia Pacific Microcarrier Industry Revenue Share (%), by Application 2024 & 2032
- Figure 28: Asia Pacific Microcarrier Industry Revenue (Million), by Country 2024 & 2032
- Figure 29: Asia Pacific Microcarrier Industry Revenue Share (%), by Country 2024 & 2032
- Figure 30: Middle East and Africa Microcarrier Industry Revenue (Million), by Material Type 2024 & 2032
- Figure 31: Middle East and Africa Microcarrier Industry Revenue Share (%), by Material Type 2024 & 2032
- Figure 32: Middle East and Africa Microcarrier Industry Revenue (Million), by Application 2024 & 2032
- Figure 33: Middle East and Africa Microcarrier Industry Revenue Share (%), by Application 2024 & 2032
- Figure 34: Middle East and Africa Microcarrier Industry Revenue (Million), by Country 2024 & 2032
- Figure 35: Middle East and Africa Microcarrier Industry Revenue Share (%), by Country 2024 & 2032
- Figure 36: South America Microcarrier Industry Revenue (Million), by Material Type 2024 & 2032
- Figure 37: South America Microcarrier Industry Revenue Share (%), by Material Type 2024 & 2032
- Figure 38: South America Microcarrier Industry Revenue (Million), by Application 2024 & 2032
- Figure 39: South America Microcarrier Industry Revenue Share (%), by Application 2024 & 2032
- Figure 40: South America Microcarrier Industry Revenue (Million), by Country 2024 & 2032
- Figure 41: South America Microcarrier Industry Revenue Share (%), by Country 2024 & 2032
List of Tables
- Table 1: Global Microcarrier Industry Revenue Million Forecast, by Region 2019 & 2032
- Table 2: Global Microcarrier Industry Revenue Million Forecast, by Material Type 2019 & 2032
- Table 3: Global Microcarrier Industry Revenue Million Forecast, by Application 2019 & 2032
- Table 4: Global Microcarrier Industry Revenue Million Forecast, by Region 2019 & 2032
- Table 5: Global Microcarrier Industry Revenue Million Forecast, by Country 2019 & 2032
- Table 6: United States Microcarrier Industry Revenue (Million) Forecast, by Application 2019 & 2032
- Table 7: Canada Microcarrier Industry Revenue (Million) Forecast, by Application 2019 & 2032
- Table 8: Mexico Microcarrier Industry Revenue (Million) Forecast, by Application 2019 & 2032
- Table 9: Global Microcarrier Industry Revenue Million Forecast, by Country 2019 & 2032
- Table 10: Germany Microcarrier Industry Revenue (Million) Forecast, by Application 2019 & 2032
- Table 11: United Kingdom Microcarrier Industry Revenue (Million) Forecast, by Application 2019 & 2032
- Table 12: France Microcarrier Industry Revenue (Million) Forecast, by Application 2019 & 2032
- Table 13: Italy Microcarrier Industry Revenue (Million) Forecast, by Application 2019 & 2032
- Table 14: Spain Microcarrier Industry Revenue (Million) Forecast, by Application 2019 & 2032
- Table 15: Rest of Europe Microcarrier Industry Revenue (Million) Forecast, by Application 2019 & 2032
- Table 16: Global Microcarrier Industry Revenue Million Forecast, by Country 2019 & 2032
- Table 17: China Microcarrier Industry Revenue (Million) Forecast, by Application 2019 & 2032
- Table 18: Japan Microcarrier Industry Revenue (Million) Forecast, by Application 2019 & 2032
- Table 19: India Microcarrier Industry Revenue (Million) Forecast, by Application 2019 & 2032
- Table 20: Australia Microcarrier Industry Revenue (Million) Forecast, by Application 2019 & 2032
- Table 21: South Korea Microcarrier Industry Revenue (Million) Forecast, by Application 2019 & 2032
- Table 22: Rest of Asia Pacific Microcarrier Industry Revenue (Million) Forecast, by Application 2019 & 2032
- Table 23: Global Microcarrier Industry Revenue Million Forecast, by Country 2019 & 2032
- Table 24: GCC Microcarrier Industry Revenue (Million) Forecast, by Application 2019 & 2032
- Table 25: South Africa Microcarrier Industry Revenue (Million) Forecast, by Application 2019 & 2032
- Table 26: Rest of Middle East and Africa Microcarrier Industry Revenue (Million) Forecast, by Application 2019 & 2032
- Table 27: Global Microcarrier Industry Revenue Million Forecast, by Country 2019 & 2032
- Table 28: Brazil Microcarrier Industry Revenue (Million) Forecast, by Application 2019 & 2032
- Table 29: Argentina Microcarrier Industry Revenue (Million) Forecast, by Application 2019 & 2032
- Table 30: Rest of South America Microcarrier Industry Revenue (Million) Forecast, by Application 2019 & 2032
- Table 31: Global Microcarrier Industry Revenue Million Forecast, by Material Type 2019 & 2032
- Table 32: Global Microcarrier Industry Revenue Million Forecast, by Application 2019 & 2032
- Table 33: Global Microcarrier Industry Revenue Million Forecast, by Country 2019 & 2032
- Table 34: United States Microcarrier Industry Revenue (Million) Forecast, by Application 2019 & 2032
- Table 35: Canada Microcarrier Industry Revenue (Million) Forecast, by Application 2019 & 2032
- Table 36: Mexico Microcarrier Industry Revenue (Million) Forecast, by Application 2019 & 2032
- Table 37: Global Microcarrier Industry Revenue Million Forecast, by Material Type 2019 & 2032
- Table 38: Global Microcarrier Industry Revenue Million Forecast, by Application 2019 & 2032
- Table 39: Global Microcarrier Industry Revenue Million Forecast, by Country 2019 & 2032
- Table 40: Germany Microcarrier Industry Revenue (Million) Forecast, by Application 2019 & 2032
- Table 41: United Kingdom Microcarrier Industry Revenue (Million) Forecast, by Application 2019 & 2032
- Table 42: France Microcarrier Industry Revenue (Million) Forecast, by Application 2019 & 2032
- Table 43: Italy Microcarrier Industry Revenue (Million) Forecast, by Application 2019 & 2032
- Table 44: Spain Microcarrier Industry Revenue (Million) Forecast, by Application 2019 & 2032
- Table 45: Rest of Europe Microcarrier Industry Revenue (Million) Forecast, by Application 2019 & 2032
- Table 46: Global Microcarrier Industry Revenue Million Forecast, by Material Type 2019 & 2032
- Table 47: Global Microcarrier Industry Revenue Million Forecast, by Application 2019 & 2032
- Table 48: Global Microcarrier Industry Revenue Million Forecast, by Country 2019 & 2032
- Table 49: China Microcarrier Industry Revenue (Million) Forecast, by Application 2019 & 2032
- Table 50: Japan Microcarrier Industry Revenue (Million) Forecast, by Application 2019 & 2032
- Table 51: India Microcarrier Industry Revenue (Million) Forecast, by Application 2019 & 2032
- Table 52: Australia Microcarrier Industry Revenue (Million) Forecast, by Application 2019 & 2032
- Table 53: South Korea Microcarrier Industry Revenue (Million) Forecast, by Application 2019 & 2032
- Table 54: Rest of Asia Pacific Microcarrier Industry Revenue (Million) Forecast, by Application 2019 & 2032
- Table 55: Global Microcarrier Industry Revenue Million Forecast, by Material Type 2019 & 2032
- Table 56: Global Microcarrier Industry Revenue Million Forecast, by Application 2019 & 2032
- Table 57: Global Microcarrier Industry Revenue Million Forecast, by Country 2019 & 2032
- Table 58: GCC Microcarrier Industry Revenue (Million) Forecast, by Application 2019 & 2032
- Table 59: South Africa Microcarrier Industry Revenue (Million) Forecast, by Application 2019 & 2032
- Table 60: Rest of Middle East and Africa Microcarrier Industry Revenue (Million) Forecast, by Application 2019 & 2032
- Table 61: Global Microcarrier Industry Revenue Million Forecast, by Material Type 2019 & 2032
- Table 62: Global Microcarrier Industry Revenue Million Forecast, by Application 2019 & 2032
- Table 63: Global Microcarrier Industry Revenue Million Forecast, by Country 2019 & 2032
- Table 64: Brazil Microcarrier Industry Revenue (Million) Forecast, by Application 2019 & 2032
- Table 65: Argentina Microcarrier Industry Revenue (Million) Forecast, by Application 2019 & 2032
- Table 66: Rest of South America Microcarrier Industry Revenue (Million) Forecast, by Application 2019 & 2032
Frequently Asked Questions
1. What is the projected Compound Annual Growth Rate (CAGR) of the Microcarrier Industry?
The projected CAGR is approximately 5.82%.
2. Which companies are prominent players in the Microcarrier Industry?
Key companies in the market include Merck KGaA, Thermo Fisher Scientific Inc, Eppendorf AG, Danaher Corporation, VWR International LLC, Lonza Group Ltd, Sartorius AG.
3. What are the main segments of the Microcarrier Industry?
The market segments include Material Type, Application.
4. Can you provide details about the market size?
The market size is estimated to be USD 2.03 Million as of 2022.
5. What are some drivers contributing to market growth?
; Rising Demand for Cell-based Vaccines and Therapeutics; Rapid Growth of Biologics and Biosimilar Industry; Increasing R&D and Availability of Funding for Cell Therapy Research.
6. What are the notable trends driving market growth?
Cell Therapy is Expected to Show Fastest Growth by Application. Over the Forecast Period.
7. Are there any restraints impacting market growth?
; High Cost of Biologics and Cell-based Therapies; Possible Drawbacks of Microcarrier Cultures.
8. Can you provide examples of recent developments in the market?
N/A
9. What pricing options are available for accessing the report?
Pricing options include single-user, multi-user, and enterprise licenses priced at USD 4750, USD 5250, and USD 8750 respectively.
10. Is the market size provided in terms of value or volume?
The market size is provided in terms of value, measured in Million.
11. Are there any specific market keywords associated with the report?
Yes, the market keyword associated with the report is "Microcarrier Industry," which aids in identifying and referencing the specific market segment covered.
12. How do I determine which pricing option suits my needs best?
The pricing options vary based on user requirements and access needs. Individual users may opt for single-user licenses, while businesses requiring broader access may choose multi-user or enterprise licenses for cost-effective access to the report.
13. Are there any additional resources or data provided in the Microcarrier Industry report?
While the report offers comprehensive insights, it's advisable to review the specific contents or supplementary materials provided to ascertain if additional resources or data are available.
14. How can I stay updated on further developments or reports in the Microcarrier Industry?
To stay informed about further developments, trends, and reports in the Microcarrier Industry, consider subscribing to industry newsletters, following relevant companies and organizations, or regularly checking reputable industry news sources and publications.
Methodology
Step 1 - Identification of Relevant Samples Size from Population Database


Step 2 - Approaches for Defining Global Market Size (Value, Volume* & Price*)

Note*: In applicable scenarios
Step 3 - Data Sources
Primary Research
- Web Analytics
- Survey Reports
- Research Institute
- Latest Research Reports
- Opinion Leaders
Secondary Research
- Annual Reports
- White Paper
- Latest Press Release
- Industry Association
- Paid Database
- Investor Presentations

Step 4 - Data Triangulation
Involves using different sources of information in order to increase the validity of a study
These sources are likely to be stakeholders in a program - participants, other researchers, program staff, other community members, and so on.
Then we put all data in single framework & apply various statistical tools to find out the dynamic on the market.
During the analysis stage, feedback from the stakeholder groups would be compared to determine areas of agreement as well as areas of divergence


