
Key Insights
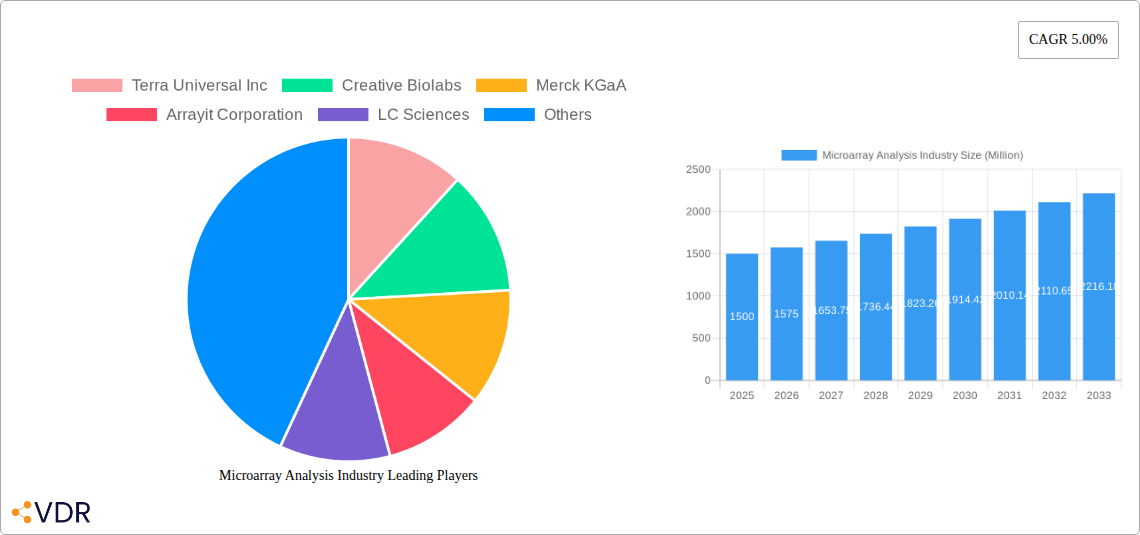
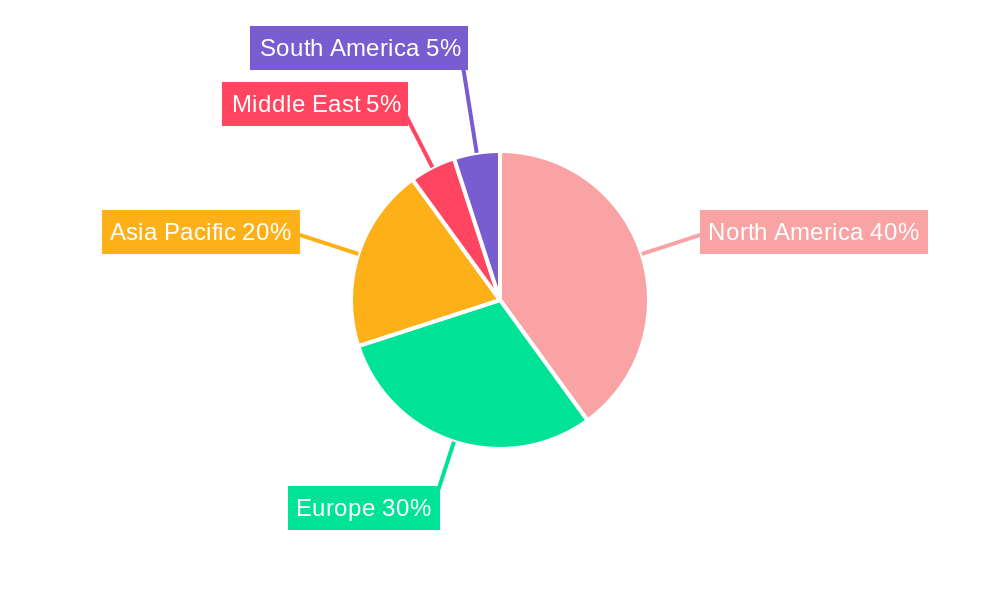
The global microarray analysis market is experiencing robust growth, driven by the increasing prevalence of chronic diseases necessitating advanced diagnostic tools and the rising demand for personalized medicine. The market's 5.00% CAGR from 2019 to 2024 suggests a considerable expansion, projected to continue over the forecast period (2025-2033). Key market segments include instruments, reagents, and services, catering to hospitals, pharmaceutical and biotechnology companies, and research institutions. North America currently holds a significant market share due to advanced research infrastructure and high healthcare expenditure, but the Asia-Pacific region is expected to exhibit substantial growth in the coming years fueled by increasing investments in healthcare and biotechnology. Technological advancements in microarray technology, such as higher throughput and improved sensitivity, are further propelling market expansion. However, the high cost of instruments and reagents and the availability of alternative technologies pose challenges to market growth. The competitive landscape comprises a mix of established players like Thermo Fisher Scientific (Affymetrix), Merck KGaA, and Bio-Rad Laboratories, alongside smaller specialized companies like Arrayit Corporation and LC Sciences. This competitive dynamic fosters innovation and the development of more affordable and efficient microarray analysis solutions.
The market segmentation highlights the crucial role of instruments in driving revenue, followed by reagents and services. The demand for microarray analysis within pharmaceutical and biotechnology companies is particularly high due to its application in drug discovery and development. Furthermore, the increasing adoption of microarrays in academic research further fuels market expansion. While the market faces restraints such as the high cost of equipment and the emergence of alternative technologies, the overall outlook remains positive. Strategic partnerships, mergers and acquisitions, and continuous innovation are expected to shape the competitive landscape and fuel future growth within the microarray analysis market. The continuous development of advanced applications within personalized medicine and oncology are expected to drive substantial market growth in the forecast period, particularly across regions with improving healthcare infrastructure.
Microarray Analysis Industry Market Report: 2019-2033
This comprehensive report provides a detailed analysis of the Microarray Analysis market, encompassing its dynamics, growth trends, dominant segments, competitive landscape, and future outlook. The report covers the period 2019-2033, with 2025 as the base year and a forecast period of 2025-2033. The study segments the market by Type (Instruments, Reagents, Services) and End-User (Hospitals, Pharmaceutical and Biotechnology Companies, Research and Academic Institutes), offering granular insights into each segment's growth trajectory.
Microarray Analysis Industry Market Dynamics & Structure
The Microarray Analysis market is characterized by a moderately fragmented structure, with several key players competing for market share. Technological innovation, particularly in high-throughput screening and data analysis techniques, is a significant driver of growth. Stringent regulatory frameworks governing the use of microarray technology in diagnostics and research influence market dynamics. Competitive pressures from alternative technologies, such as next-generation sequencing, also play a role. The market demonstrates a strong correlation with the growth of the pharmaceutical and biotechnology industries, as well as the increasing adoption of personalized medicine. M&A activities, while not exceptionally high in volume (estimated at xx deals annually in the historical period), are expected to increase as companies seek to expand their product portfolios and geographical reach. Market concentration is moderate, with the top five players holding an estimated xx% market share in 2024.
- Market Concentration: Moderately fragmented, top 5 players holding approximately xx% market share (2024).
- Technological Innovation: High-throughput screening, advanced data analysis tools are key drivers.
- Regulatory Frameworks: Stringent regulations influence market access and adoption.
- Competitive Substitutes: Next-generation sequencing poses competitive pressure.
- End-User Demographics: Growth heavily influenced by pharmaceutical, biotech, and research sectors.
- M&A Trends: Moderate activity, projected increase in future years.
Microarray Analysis Industry Growth Trends & Insights
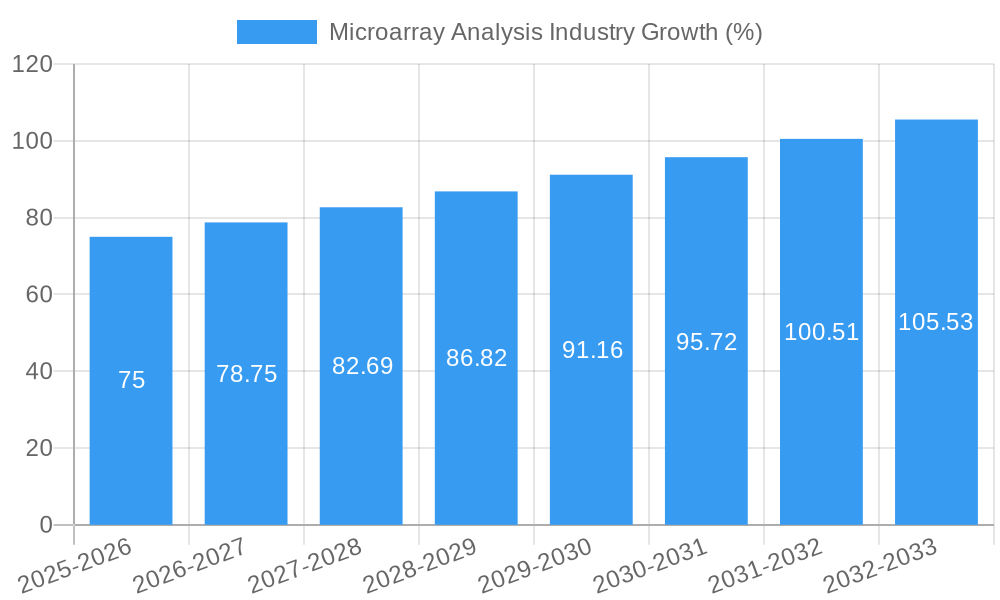
The Microarray Analysis market experienced significant growth during the historical period (2019-2024), with a Compound Annual Growth Rate (CAGR) of xx%. This growth is attributed to the increasing adoption of microarray technology in various applications, including drug discovery, disease diagnosis, and genetic research. Market penetration remains relatively high in developed regions, yet significant opportunities exist in emerging markets. Technological advancements, such as the development of more sensitive and cost-effective microarray platforms, have further fueled market expansion. Consumer behavior has shifted towards more personalized healthcare solutions, driving demand for microarray-based diagnostic and therapeutic approaches. The forecast period (2025-2033) projects a CAGR of xx%, driven by continued technological advancements, expanding applications, and growing research investments. Market size is expected to reach xx million by 2033.
Dominant Regions, Countries, or Segments in Microarray Analysis Industry
North America currently dominates the Microarray Analysis market, driven by a robust research and development ecosystem, high healthcare expenditure, and early adoption of advanced technologies. Europe follows as a significant market, while the Asia-Pacific region shows substantial growth potential due to increasing healthcare investments and a growing base of research institutes.
Leading Segments:
- Type: Reagents currently hold the largest market share, followed by Instruments and Services. The Reagents segment is expected to maintain its dominance throughout the forecast period due to the continuous demand for consumables in microarray experiments.
- End-User: Pharmaceutical and Biotechnology companies account for the largest segment, followed by Research and Academic Institutes and Hospitals. The pharmaceutical and biotechnology sector’s continued investment in research and development fuels this dominance.
Key Drivers:
- North America: Strong R&D ecosystem, high healthcare spending, early technology adoption.
- Europe: Well-established healthcare infrastructure, significant government funding for research.
- Asia-Pacific: Rising healthcare expenditure, growing research infrastructure, increasing government support.
Microarray Analysis Industry Product Landscape
The Microarray Analysis market offers a diverse range of products, including DNA microarrays, cDNA microarrays, oligonucleotide microarrays, and protein microarrays. These products vary in terms of their sensitivity, throughput, and application-specific capabilities. Recent innovations focus on improving data quality, reducing assay time, and integrating advanced data analysis tools. Unique selling propositions often center on higher sensitivity, reduced cost per sample, or simplified workflow. Technological advancements include the development of next-generation microarrays, which incorporate novel designs and materials for improved performance and functionality.
Key Drivers, Barriers & Challenges in Microarray Analysis Industry
Key Drivers:
- Rising prevalence of chronic diseases: Increased demand for early and accurate diagnosis.
- Growing investments in personalized medicine: Tailored treatment approaches require detailed genomic data.
- Technological advancements: Development of high-throughput, cost-effective microarray platforms.
Challenges & Restraints:
- High initial investment costs: Limiting adoption in resource-constrained settings. (Estimated to limit market penetration by xx% in developing nations).
- Data interpretation complexities: Requires specialized expertise and sophisticated bioinformatics tools.
- Competition from alternative technologies: Next-generation sequencing presents a major challenge.
Emerging Opportunities in Microarray Analysis Industry
- Expansion into emerging markets: Significant untapped potential in developing nations.
- Development of novel microarray applications: Expansion into areas like environmental monitoring and agriculture.
- Integration of AI and machine learning: Improving data analysis and interpretation.
Growth Accelerators in the Microarray Analysis Industry Industry
Technological advancements, strategic partnerships between microarray manufacturers and healthcare providers, and expanding applications across various industries are key factors driving long-term market growth. Increasing government funding for genomics research and the development of more sophisticated data analysis tools will also significantly contribute to market expansion.
Key Players Shaping the Microarray Analysis Industry Market
- Terra Universal Inc
- Creative Biolabs
- Merck KGaA
- Arrayit Corporation
- LC Sciences
- Thermo Fischer Scientific (Affymetrix)
- PEPperPRINT
- Bio-Rad Laboratories
- JPT Peptide Technologies
- Grace Bio-Labs
- ProImmune Ltd
Notable Milestones in Microarray Analysis Industry Sector
- June 2022: Ariceum Therapeutics launched with EUR 25M Series A funding to advance its lead asset, Satoreotide, for neuroendocrine cancer treatment. This highlights the continued investment in therapeutics driven by genomic research and microarray data.
- May 2022: Pfizer's acquisition of Biohaven, a developer of migraine therapies, underscores the increasing role of microarray analysis in drug discovery and development within the pharmaceutical industry.
In-Depth Microarray Analysis Industry Market Outlook
The Microarray Analysis market is poised for continued growth, driven by ongoing technological advancements, increasing demand for personalized medicine, and expansion into new applications. Strategic partnerships, particularly between microarray manufacturers and pharmaceutical companies, will be crucial for driving market expansion. The focus on developing more user-friendly platforms and improving data analysis tools will further enhance market accessibility and adoption. The market is anticipated to witness significant expansion in the forecast period, exceeding xx million by 2033.
Microarray Analysis Industry Segmentation
-
1. Type
- 1.1. Instruments
- 1.2. Reagents
- 1.3. Services
-
2. End User
- 2.1. Hospitals
- 2.2. Pharmaceutical and Biotechnology Companies
- 2.3. Research and Academic Institutes
Microarray Analysis Industry Segmentation By Geography
-
1. North America
- 1.1. United States
- 1.2. Canada
- 1.3. Mexico
-
2. Europe
- 2.1. Germany
- 2.2. United Kingdom
- 2.3. France
- 2.4. Italy
- 2.5. Spain
- 2.6. Rest of Europe
-
3. Asia Pacific
- 3.1. China
- 3.2. Japan
- 3.3. India
- 3.4. Australia
- 3.5. South Korea
- 3.6. Rest of Asia Pacific
- 4. Middle East
-
5. GCC
- 5.1. South Africa
- 5.2. Rest of Middle East
-
6. South America
- 6.1. Brazil
- 6.2. Argentina
- 6.3. Rest of South America
Microarray Analysis Industry REPORT HIGHLIGHTS
| Aspects | Details |
|---|---|
| Study Period | 2019-2033 |
| Base Year | 2024 |
| Estimated Year | 2025 |
| Forecast Period | 2025-2033 |
| Historical Period | 2019-2024 |
| Growth Rate | CAGR of 5.00% from 2019-2033 |
| Segmentation |
|
Table of Contents
- 1. Introduction
- 1.1. Research Scope
- 1.2. Market Segmentation
- 1.3. Research Methodology
- 1.4. Definitions and Assumptions
- 2. Executive Summary
- 2.1. Introduction
- 3. Market Dynamics
- 3.1. Introduction
- 3.2. Market Drivers
- 3.2.1. Growing Burden of Chronic Diseases; Technological Advancements in Diagnostic Testing
- 3.3. Market Restrains
- 3.3.1. Reimbursement Issues
- 3.4. Market Trends
- 3.4.1. The Instrument Segment is Expected to Hold a Major Market Share in the Peptide Microarray Market
- 4. Market Factor Analysis
- 4.1. Porters Five Forces
- 4.2. Supply/Value Chain
- 4.3. PESTEL analysis
- 4.4. Market Entropy
- 4.5. Patent/Trademark Analysis
- 5. Global Microarray Analysis Industry Analysis, Insights and Forecast, 2019-2031
- 5.1. Market Analysis, Insights and Forecast - by Type
- 5.1.1. Instruments
- 5.1.2. Reagents
- 5.1.3. Services
- 5.2. Market Analysis, Insights and Forecast - by End User
- 5.2.1. Hospitals
- 5.2.2. Pharmaceutical and Biotechnology Companies
- 5.2.3. Research and Academic Institutes
- 5.3. Market Analysis, Insights and Forecast - by Region
- 5.3.1. North America
- 5.3.2. Europe
- 5.3.3. Asia Pacific
- 5.3.4. Middle East
- 5.3.5. GCC
- 5.3.6. South America
- 5.1. Market Analysis, Insights and Forecast - by Type
- 6. North America Microarray Analysis Industry Analysis, Insights and Forecast, 2019-2031
- 6.1. Market Analysis, Insights and Forecast - by Type
- 6.1.1. Instruments
- 6.1.2. Reagents
- 6.1.3. Services
- 6.2. Market Analysis, Insights and Forecast - by End User
- 6.2.1. Hospitals
- 6.2.2. Pharmaceutical and Biotechnology Companies
- 6.2.3. Research and Academic Institutes
- 6.1. Market Analysis, Insights and Forecast - by Type
- 7. Europe Microarray Analysis Industry Analysis, Insights and Forecast, 2019-2031
- 7.1. Market Analysis, Insights and Forecast - by Type
- 7.1.1. Instruments
- 7.1.2. Reagents
- 7.1.3. Services
- 7.2. Market Analysis, Insights and Forecast - by End User
- 7.2.1. Hospitals
- 7.2.2. Pharmaceutical and Biotechnology Companies
- 7.2.3. Research and Academic Institutes
- 7.1. Market Analysis, Insights and Forecast - by Type
- 8. Asia Pacific Microarray Analysis Industry Analysis, Insights and Forecast, 2019-2031
- 8.1. Market Analysis, Insights and Forecast - by Type
- 8.1.1. Instruments
- 8.1.2. Reagents
- 8.1.3. Services
- 8.2. Market Analysis, Insights and Forecast - by End User
- 8.2.1. Hospitals
- 8.2.2. Pharmaceutical and Biotechnology Companies
- 8.2.3. Research and Academic Institutes
- 8.1. Market Analysis, Insights and Forecast - by Type
- 9. Middle East Microarray Analysis Industry Analysis, Insights and Forecast, 2019-2031
- 9.1. Market Analysis, Insights and Forecast - by Type
- 9.1.1. Instruments
- 9.1.2. Reagents
- 9.1.3. Services
- 9.2. Market Analysis, Insights and Forecast - by End User
- 9.2.1. Hospitals
- 9.2.2. Pharmaceutical and Biotechnology Companies
- 9.2.3. Research and Academic Institutes
- 9.1. Market Analysis, Insights and Forecast - by Type
- 10. GCC Microarray Analysis Industry Analysis, Insights and Forecast, 2019-2031
- 10.1. Market Analysis, Insights and Forecast - by Type
- 10.1.1. Instruments
- 10.1.2. Reagents
- 10.1.3. Services
- 10.2. Market Analysis, Insights and Forecast - by End User
- 10.2.1. Hospitals
- 10.2.2. Pharmaceutical and Biotechnology Companies
- 10.2.3. Research and Academic Institutes
- 10.1. Market Analysis, Insights and Forecast - by Type
- 11. South America Microarray Analysis Industry Analysis, Insights and Forecast, 2019-2031
- 11.1. Market Analysis, Insights and Forecast - by Type
- 11.1.1. Instruments
- 11.1.2. Reagents
- 11.1.3. Services
- 11.2. Market Analysis, Insights and Forecast - by End User
- 11.2.1. Hospitals
- 11.2.2. Pharmaceutical and Biotechnology Companies
- 11.2.3. Research and Academic Institutes
- 11.1. Market Analysis, Insights and Forecast - by Type
- 12. North America Microarray Analysis Industry Analysis, Insights and Forecast, 2019-2031
- 12.1. Market Analysis, Insights and Forecast - By Country/Sub-region
- 12.1.1. undefined
- 13. Europe Microarray Analysis Industry Analysis, Insights and Forecast, 2019-2031
- 13.1. Market Analysis, Insights and Forecast - By Country/Sub-region
- 13.1.1. undefined
- 14. Asia Pacific Microarray Analysis Industry Analysis, Insights and Forecast, 2019-2031
- 14.1. Market Analysis, Insights and Forecast - By Country/Sub-region
- 14.1.1. undefined
- 15. Middle East Microarray Analysis Industry Analysis, Insights and Forecast, 2019-2031
- 15.1. Market Analysis, Insights and Forecast - By Country/Sub-region
- 15.1.1. undefined
- 16. South America Microarray Analysis Industry Analysis, Insights and Forecast, 2019-2031
- 16.1. Market Analysis, Insights and Forecast - By Country/Sub-region
- 16.1.1. undefined
- 17. Competitive Analysis
- 17.1. Global Market Share Analysis 2024
- 17.2. Company Profiles
- 17.2.1 Terra Universal Inc
- 17.2.1.1. Overview
- 17.2.1.2. Products
- 17.2.1.3. SWOT Analysis
- 17.2.1.4. Recent Developments
- 17.2.1.5. Financials (Based on Availability)
- 17.2.2 Creative Biolabs
- 17.2.2.1. Overview
- 17.2.2.2. Products
- 17.2.2.3. SWOT Analysis
- 17.2.2.4. Recent Developments
- 17.2.2.5. Financials (Based on Availability)
- 17.2.3 Merck KGaA
- 17.2.3.1. Overview
- 17.2.3.2. Products
- 17.2.3.3. SWOT Analysis
- 17.2.3.4. Recent Developments
- 17.2.3.5. Financials (Based on Availability)
- 17.2.4 Arrayit Corporation
- 17.2.4.1. Overview
- 17.2.4.2. Products
- 17.2.4.3. SWOT Analysis
- 17.2.4.4. Recent Developments
- 17.2.4.5. Financials (Based on Availability)
- 17.2.5 LC Sciences
- 17.2.5.1. Overview
- 17.2.5.2. Products
- 17.2.5.3. SWOT Analysis
- 17.2.5.4. Recent Developments
- 17.2.5.5. Financials (Based on Availability)
- 17.2.6 Thermo Fischer Scientific (Affymetrix)
- 17.2.6.1. Overview
- 17.2.6.2. Products
- 17.2.6.3. SWOT Analysis
- 17.2.6.4. Recent Developments
- 17.2.6.5. Financials (Based on Availability)
- 17.2.7 PEPperPRINT
- 17.2.7.1. Overview
- 17.2.7.2. Products
- 17.2.7.3. SWOT Analysis
- 17.2.7.4. Recent Developments
- 17.2.7.5. Financials (Based on Availability)
- 17.2.8 Bio-Rad Laboratories
- 17.2.8.1. Overview
- 17.2.8.2. Products
- 17.2.8.3. SWOT Analysis
- 17.2.8.4. Recent Developments
- 17.2.8.5. Financials (Based on Availability)
- 17.2.9 JPT Peptide Technologies
- 17.2.9.1. Overview
- 17.2.9.2. Products
- 17.2.9.3. SWOT Analysis
- 17.2.9.4. Recent Developments
- 17.2.9.5. Financials (Based on Availability)
- 17.2.10 Grace Bio-Labs
- 17.2.10.1. Overview
- 17.2.10.2. Products
- 17.2.10.3. SWOT Analysis
- 17.2.10.4. Recent Developments
- 17.2.10.5. Financials (Based on Availability)
- 17.2.11 ProImmune Ltd
- 17.2.11.1. Overview
- 17.2.11.2. Products
- 17.2.11.3. SWOT Analysis
- 17.2.11.4. Recent Developments
- 17.2.11.5. Financials (Based on Availability)
- 17.2.1 Terra Universal Inc
List of Figures
- Figure 1: Global Microarray Analysis Industry Revenue Breakdown (Million, %) by Region 2024 & 2032
- Figure 2: Global Microarray Analysis Industry Volume Breakdown (K Unit, %) by Region 2024 & 2032
- Figure 3: North America Microarray Analysis Industry Revenue (Million), by Country 2024 & 2032
- Figure 4: North America Microarray Analysis Industry Volume (K Unit), by Country 2024 & 2032
- Figure 5: North America Microarray Analysis Industry Revenue Share (%), by Country 2024 & 2032
- Figure 6: North America Microarray Analysis Industry Volume Share (%), by Country 2024 & 2032
- Figure 7: Europe Microarray Analysis Industry Revenue (Million), by Country 2024 & 2032
- Figure 8: Europe Microarray Analysis Industry Volume (K Unit), by Country 2024 & 2032
- Figure 9: Europe Microarray Analysis Industry Revenue Share (%), by Country 2024 & 2032
- Figure 10: Europe Microarray Analysis Industry Volume Share (%), by Country 2024 & 2032
- Figure 11: Asia Pacific Microarray Analysis Industry Revenue (Million), by Country 2024 & 2032
- Figure 12: Asia Pacific Microarray Analysis Industry Volume (K Unit), by Country 2024 & 2032
- Figure 13: Asia Pacific Microarray Analysis Industry Revenue Share (%), by Country 2024 & 2032
- Figure 14: Asia Pacific Microarray Analysis Industry Volume Share (%), by Country 2024 & 2032
- Figure 15: Middle East Microarray Analysis Industry Revenue (Million), by Country 2024 & 2032
- Figure 16: Middle East Microarray Analysis Industry Volume (K Unit), by Country 2024 & 2032
- Figure 17: Middle East Microarray Analysis Industry Revenue Share (%), by Country 2024 & 2032
- Figure 18: Middle East Microarray Analysis Industry Volume Share (%), by Country 2024 & 2032
- Figure 19: South America Microarray Analysis Industry Revenue (Million), by Country 2024 & 2032
- Figure 20: South America Microarray Analysis Industry Volume (K Unit), by Country 2024 & 2032
- Figure 21: South America Microarray Analysis Industry Revenue Share (%), by Country 2024 & 2032
- Figure 22: South America Microarray Analysis Industry Volume Share (%), by Country 2024 & 2032
- Figure 23: North America Microarray Analysis Industry Revenue (Million), by Type 2024 & 2032
- Figure 24: North America Microarray Analysis Industry Volume (K Unit), by Type 2024 & 2032
- Figure 25: North America Microarray Analysis Industry Revenue Share (%), by Type 2024 & 2032
- Figure 26: North America Microarray Analysis Industry Volume Share (%), by Type 2024 & 2032
- Figure 27: North America Microarray Analysis Industry Revenue (Million), by End User 2024 & 2032
- Figure 28: North America Microarray Analysis Industry Volume (K Unit), by End User 2024 & 2032
- Figure 29: North America Microarray Analysis Industry Revenue Share (%), by End User 2024 & 2032
- Figure 30: North America Microarray Analysis Industry Volume Share (%), by End User 2024 & 2032
- Figure 31: North America Microarray Analysis Industry Revenue (Million), by Country 2024 & 2032
- Figure 32: North America Microarray Analysis Industry Volume (K Unit), by Country 2024 & 2032
- Figure 33: North America Microarray Analysis Industry Revenue Share (%), by Country 2024 & 2032
- Figure 34: North America Microarray Analysis Industry Volume Share (%), by Country 2024 & 2032
- Figure 35: Europe Microarray Analysis Industry Revenue (Million), by Type 2024 & 2032
- Figure 36: Europe Microarray Analysis Industry Volume (K Unit), by Type 2024 & 2032
- Figure 37: Europe Microarray Analysis Industry Revenue Share (%), by Type 2024 & 2032
- Figure 38: Europe Microarray Analysis Industry Volume Share (%), by Type 2024 & 2032
- Figure 39: Europe Microarray Analysis Industry Revenue (Million), by End User 2024 & 2032
- Figure 40: Europe Microarray Analysis Industry Volume (K Unit), by End User 2024 & 2032
- Figure 41: Europe Microarray Analysis Industry Revenue Share (%), by End User 2024 & 2032
- Figure 42: Europe Microarray Analysis Industry Volume Share (%), by End User 2024 & 2032
- Figure 43: Europe Microarray Analysis Industry Revenue (Million), by Country 2024 & 2032
- Figure 44: Europe Microarray Analysis Industry Volume (K Unit), by Country 2024 & 2032
- Figure 45: Europe Microarray Analysis Industry Revenue Share (%), by Country 2024 & 2032
- Figure 46: Europe Microarray Analysis Industry Volume Share (%), by Country 2024 & 2032
- Figure 47: Asia Pacific Microarray Analysis Industry Revenue (Million), by Type 2024 & 2032
- Figure 48: Asia Pacific Microarray Analysis Industry Volume (K Unit), by Type 2024 & 2032
- Figure 49: Asia Pacific Microarray Analysis Industry Revenue Share (%), by Type 2024 & 2032
- Figure 50: Asia Pacific Microarray Analysis Industry Volume Share (%), by Type 2024 & 2032
- Figure 51: Asia Pacific Microarray Analysis Industry Revenue (Million), by End User 2024 & 2032
- Figure 52: Asia Pacific Microarray Analysis Industry Volume (K Unit), by End User 2024 & 2032
- Figure 53: Asia Pacific Microarray Analysis Industry Revenue Share (%), by End User 2024 & 2032
- Figure 54: Asia Pacific Microarray Analysis Industry Volume Share (%), by End User 2024 & 2032
- Figure 55: Asia Pacific Microarray Analysis Industry Revenue (Million), by Country 2024 & 2032
- Figure 56: Asia Pacific Microarray Analysis Industry Volume (K Unit), by Country 2024 & 2032
- Figure 57: Asia Pacific Microarray Analysis Industry Revenue Share (%), by Country 2024 & 2032
- Figure 58: Asia Pacific Microarray Analysis Industry Volume Share (%), by Country 2024 & 2032
- Figure 59: Middle East Microarray Analysis Industry Revenue (Million), by Type 2024 & 2032
- Figure 60: Middle East Microarray Analysis Industry Volume (K Unit), by Type 2024 & 2032
- Figure 61: Middle East Microarray Analysis Industry Revenue Share (%), by Type 2024 & 2032
- Figure 62: Middle East Microarray Analysis Industry Volume Share (%), by Type 2024 & 2032
- Figure 63: Middle East Microarray Analysis Industry Revenue (Million), by End User 2024 & 2032
- Figure 64: Middle East Microarray Analysis Industry Volume (K Unit), by End User 2024 & 2032
- Figure 65: Middle East Microarray Analysis Industry Revenue Share (%), by End User 2024 & 2032
- Figure 66: Middle East Microarray Analysis Industry Volume Share (%), by End User 2024 & 2032
- Figure 67: Middle East Microarray Analysis Industry Revenue (Million), by Country 2024 & 2032
- Figure 68: Middle East Microarray Analysis Industry Volume (K Unit), by Country 2024 & 2032
- Figure 69: Middle East Microarray Analysis Industry Revenue Share (%), by Country 2024 & 2032
- Figure 70: Middle East Microarray Analysis Industry Volume Share (%), by Country 2024 & 2032
- Figure 71: GCC Microarray Analysis Industry Revenue (Million), by Type 2024 & 2032
- Figure 72: GCC Microarray Analysis Industry Volume (K Unit), by Type 2024 & 2032
- Figure 73: GCC Microarray Analysis Industry Revenue Share (%), by Type 2024 & 2032
- Figure 74: GCC Microarray Analysis Industry Volume Share (%), by Type 2024 & 2032
- Figure 75: GCC Microarray Analysis Industry Revenue (Million), by End User 2024 & 2032
- Figure 76: GCC Microarray Analysis Industry Volume (K Unit), by End User 2024 & 2032
- Figure 77: GCC Microarray Analysis Industry Revenue Share (%), by End User 2024 & 2032
- Figure 78: GCC Microarray Analysis Industry Volume Share (%), by End User 2024 & 2032
- Figure 79: GCC Microarray Analysis Industry Revenue (Million), by Country 2024 & 2032
- Figure 80: GCC Microarray Analysis Industry Volume (K Unit), by Country 2024 & 2032
- Figure 81: GCC Microarray Analysis Industry Revenue Share (%), by Country 2024 & 2032
- Figure 82: GCC Microarray Analysis Industry Volume Share (%), by Country 2024 & 2032
- Figure 83: South America Microarray Analysis Industry Revenue (Million), by Type 2024 & 2032
- Figure 84: South America Microarray Analysis Industry Volume (K Unit), by Type 2024 & 2032
- Figure 85: South America Microarray Analysis Industry Revenue Share (%), by Type 2024 & 2032
- Figure 86: South America Microarray Analysis Industry Volume Share (%), by Type 2024 & 2032
- Figure 87: South America Microarray Analysis Industry Revenue (Million), by End User 2024 & 2032
- Figure 88: South America Microarray Analysis Industry Volume (K Unit), by End User 2024 & 2032
- Figure 89: South America Microarray Analysis Industry Revenue Share (%), by End User 2024 & 2032
- Figure 90: South America Microarray Analysis Industry Volume Share (%), by End User 2024 & 2032
- Figure 91: South America Microarray Analysis Industry Revenue (Million), by Country 2024 & 2032
- Figure 92: South America Microarray Analysis Industry Volume (K Unit), by Country 2024 & 2032
- Figure 93: South America Microarray Analysis Industry Revenue Share (%), by Country 2024 & 2032
- Figure 94: South America Microarray Analysis Industry Volume Share (%), by Country 2024 & 2032
List of Tables
- Table 1: Global Microarray Analysis Industry Revenue Million Forecast, by Region 2019 & 2032
- Table 2: Global Microarray Analysis Industry Volume K Unit Forecast, by Region 2019 & 2032
- Table 3: Global Microarray Analysis Industry Revenue Million Forecast, by Type 2019 & 2032
- Table 4: Global Microarray Analysis Industry Volume K Unit Forecast, by Type 2019 & 2032
- Table 5: Global Microarray Analysis Industry Revenue Million Forecast, by End User 2019 & 2032
- Table 6: Global Microarray Analysis Industry Volume K Unit Forecast, by End User 2019 & 2032
- Table 7: Global Microarray Analysis Industry Revenue Million Forecast, by Region 2019 & 2032
- Table 8: Global Microarray Analysis Industry Volume K Unit Forecast, by Region 2019 & 2032
- Table 9: Global Microarray Analysis Industry Revenue Million Forecast, by Country 2019 & 2032
- Table 10: Global Microarray Analysis Industry Volume K Unit Forecast, by Country 2019 & 2032
- Table 11: Global Microarray Analysis Industry Revenue Million Forecast, by Country 2019 & 2032
- Table 12: Global Microarray Analysis Industry Volume K Unit Forecast, by Country 2019 & 2032
- Table 13: Global Microarray Analysis Industry Revenue Million Forecast, by Country 2019 & 2032
- Table 14: Global Microarray Analysis Industry Volume K Unit Forecast, by Country 2019 & 2032
- Table 15: Global Microarray Analysis Industry Revenue Million Forecast, by Country 2019 & 2032
- Table 16: Global Microarray Analysis Industry Volume K Unit Forecast, by Country 2019 & 2032
- Table 17: Global Microarray Analysis Industry Revenue Million Forecast, by Country 2019 & 2032
- Table 18: Global Microarray Analysis Industry Volume K Unit Forecast, by Country 2019 & 2032
- Table 19: Global Microarray Analysis Industry Revenue Million Forecast, by Type 2019 & 2032
- Table 20: Global Microarray Analysis Industry Volume K Unit Forecast, by Type 2019 & 2032
- Table 21: Global Microarray Analysis Industry Revenue Million Forecast, by End User 2019 & 2032
- Table 22: Global Microarray Analysis Industry Volume K Unit Forecast, by End User 2019 & 2032
- Table 23: Global Microarray Analysis Industry Revenue Million Forecast, by Country 2019 & 2032
- Table 24: Global Microarray Analysis Industry Volume K Unit Forecast, by Country 2019 & 2032
- Table 25: United States Microarray Analysis Industry Revenue (Million) Forecast, by Application 2019 & 2032
- Table 26: United States Microarray Analysis Industry Volume (K Unit) Forecast, by Application 2019 & 2032
- Table 27: Canada Microarray Analysis Industry Revenue (Million) Forecast, by Application 2019 & 2032
- Table 28: Canada Microarray Analysis Industry Volume (K Unit) Forecast, by Application 2019 & 2032
- Table 29: Mexico Microarray Analysis Industry Revenue (Million) Forecast, by Application 2019 & 2032
- Table 30: Mexico Microarray Analysis Industry Volume (K Unit) Forecast, by Application 2019 & 2032
- Table 31: Global Microarray Analysis Industry Revenue Million Forecast, by Type 2019 & 2032
- Table 32: Global Microarray Analysis Industry Volume K Unit Forecast, by Type 2019 & 2032
- Table 33: Global Microarray Analysis Industry Revenue Million Forecast, by End User 2019 & 2032
- Table 34: Global Microarray Analysis Industry Volume K Unit Forecast, by End User 2019 & 2032
- Table 35: Global Microarray Analysis Industry Revenue Million Forecast, by Country 2019 & 2032
- Table 36: Global Microarray Analysis Industry Volume K Unit Forecast, by Country 2019 & 2032
- Table 37: Germany Microarray Analysis Industry Revenue (Million) Forecast, by Application 2019 & 2032
- Table 38: Germany Microarray Analysis Industry Volume (K Unit) Forecast, by Application 2019 & 2032
- Table 39: United Kingdom Microarray Analysis Industry Revenue (Million) Forecast, by Application 2019 & 2032
- Table 40: United Kingdom Microarray Analysis Industry Volume (K Unit) Forecast, by Application 2019 & 2032
- Table 41: France Microarray Analysis Industry Revenue (Million) Forecast, by Application 2019 & 2032
- Table 42: France Microarray Analysis Industry Volume (K Unit) Forecast, by Application 2019 & 2032
- Table 43: Italy Microarray Analysis Industry Revenue (Million) Forecast, by Application 2019 & 2032
- Table 44: Italy Microarray Analysis Industry Volume (K Unit) Forecast, by Application 2019 & 2032
- Table 45: Spain Microarray Analysis Industry Revenue (Million) Forecast, by Application 2019 & 2032
- Table 46: Spain Microarray Analysis Industry Volume (K Unit) Forecast, by Application 2019 & 2032
- Table 47: Rest of Europe Microarray Analysis Industry Revenue (Million) Forecast, by Application 2019 & 2032
- Table 48: Rest of Europe Microarray Analysis Industry Volume (K Unit) Forecast, by Application 2019 & 2032
- Table 49: Global Microarray Analysis Industry Revenue Million Forecast, by Type 2019 & 2032
- Table 50: Global Microarray Analysis Industry Volume K Unit Forecast, by Type 2019 & 2032
- Table 51: Global Microarray Analysis Industry Revenue Million Forecast, by End User 2019 & 2032
- Table 52: Global Microarray Analysis Industry Volume K Unit Forecast, by End User 2019 & 2032
- Table 53: Global Microarray Analysis Industry Revenue Million Forecast, by Country 2019 & 2032
- Table 54: Global Microarray Analysis Industry Volume K Unit Forecast, by Country 2019 & 2032
- Table 55: China Microarray Analysis Industry Revenue (Million) Forecast, by Application 2019 & 2032
- Table 56: China Microarray Analysis Industry Volume (K Unit) Forecast, by Application 2019 & 2032
- Table 57: Japan Microarray Analysis Industry Revenue (Million) Forecast, by Application 2019 & 2032
- Table 58: Japan Microarray Analysis Industry Volume (K Unit) Forecast, by Application 2019 & 2032
- Table 59: India Microarray Analysis Industry Revenue (Million) Forecast, by Application 2019 & 2032
- Table 60: India Microarray Analysis Industry Volume (K Unit) Forecast, by Application 2019 & 2032
- Table 61: Australia Microarray Analysis Industry Revenue (Million) Forecast, by Application 2019 & 2032
- Table 62: Australia Microarray Analysis Industry Volume (K Unit) Forecast, by Application 2019 & 2032
- Table 63: South Korea Microarray Analysis Industry Revenue (Million) Forecast, by Application 2019 & 2032
- Table 64: South Korea Microarray Analysis Industry Volume (K Unit) Forecast, by Application 2019 & 2032
- Table 65: Rest of Asia Pacific Microarray Analysis Industry Revenue (Million) Forecast, by Application 2019 & 2032
- Table 66: Rest of Asia Pacific Microarray Analysis Industry Volume (K Unit) Forecast, by Application 2019 & 2032
- Table 67: Global Microarray Analysis Industry Revenue Million Forecast, by Type 2019 & 2032
- Table 68: Global Microarray Analysis Industry Volume K Unit Forecast, by Type 2019 & 2032
- Table 69: Global Microarray Analysis Industry Revenue Million Forecast, by End User 2019 & 2032
- Table 70: Global Microarray Analysis Industry Volume K Unit Forecast, by End User 2019 & 2032
- Table 71: Global Microarray Analysis Industry Revenue Million Forecast, by Country 2019 & 2032
- Table 72: Global Microarray Analysis Industry Volume K Unit Forecast, by Country 2019 & 2032
- Table 73: Global Microarray Analysis Industry Revenue Million Forecast, by Type 2019 & 2032
- Table 74: Global Microarray Analysis Industry Volume K Unit Forecast, by Type 2019 & 2032
- Table 75: Global Microarray Analysis Industry Revenue Million Forecast, by End User 2019 & 2032
- Table 76: Global Microarray Analysis Industry Volume K Unit Forecast, by End User 2019 & 2032
- Table 77: Global Microarray Analysis Industry Revenue Million Forecast, by Country 2019 & 2032
- Table 78: Global Microarray Analysis Industry Volume K Unit Forecast, by Country 2019 & 2032
- Table 79: South Africa Microarray Analysis Industry Revenue (Million) Forecast, by Application 2019 & 2032
- Table 80: South Africa Microarray Analysis Industry Volume (K Unit) Forecast, by Application 2019 & 2032
- Table 81: Rest of Middle East Microarray Analysis Industry Revenue (Million) Forecast, by Application 2019 & 2032
- Table 82: Rest of Middle East Microarray Analysis Industry Volume (K Unit) Forecast, by Application 2019 & 2032
- Table 83: Global Microarray Analysis Industry Revenue Million Forecast, by Type 2019 & 2032
- Table 84: Global Microarray Analysis Industry Volume K Unit Forecast, by Type 2019 & 2032
- Table 85: Global Microarray Analysis Industry Revenue Million Forecast, by End User 2019 & 2032
- Table 86: Global Microarray Analysis Industry Volume K Unit Forecast, by End User 2019 & 2032
- Table 87: Global Microarray Analysis Industry Revenue Million Forecast, by Country 2019 & 2032
- Table 88: Global Microarray Analysis Industry Volume K Unit Forecast, by Country 2019 & 2032
- Table 89: Brazil Microarray Analysis Industry Revenue (Million) Forecast, by Application 2019 & 2032
- Table 90: Brazil Microarray Analysis Industry Volume (K Unit) Forecast, by Application 2019 & 2032
- Table 91: Argentina Microarray Analysis Industry Revenue (Million) Forecast, by Application 2019 & 2032
- Table 92: Argentina Microarray Analysis Industry Volume (K Unit) Forecast, by Application 2019 & 2032
- Table 93: Rest of South America Microarray Analysis Industry Revenue (Million) Forecast, by Application 2019 & 2032
- Table 94: Rest of South America Microarray Analysis Industry Volume (K Unit) Forecast, by Application 2019 & 2032
Frequently Asked Questions
1. What is the projected Compound Annual Growth Rate (CAGR) of the Microarray Analysis Industry?
The projected CAGR is approximately 5.00%.
2. Which companies are prominent players in the Microarray Analysis Industry?
Key companies in the market include Terra Universal Inc, Creative Biolabs, Merck KGaA, Arrayit Corporation, LC Sciences, Thermo Fischer Scientific (Affymetrix), PEPperPRINT, Bio-Rad Laboratories, JPT Peptide Technologies, Grace Bio-Labs, ProImmune Ltd.
3. What are the main segments of the Microarray Analysis Industry?
The market segments include Type, End User.
4. Can you provide details about the market size?
The market size is estimated to be USD XX Million as of 2022.
5. What are some drivers contributing to market growth?
Growing Burden of Chronic Diseases; Technological Advancements in Diagnostic Testing.
6. What are the notable trends driving market growth?
The Instrument Segment is Expected to Hold a Major Market Share in the Peptide Microarray Market.
7. Are there any restraints impacting market growth?
Reimbursement Issues.
8. Can you provide examples of recent developments in the market?
In June 2022, Ariceum Therapeutics launched with EUR 25M Series A to advance its lead asset, Satoreotide, for the treatment of low- and high-grade neuroendocrine cancers.
9. What pricing options are available for accessing the report?
Pricing options include single-user, multi-user, and enterprise licenses priced at USD 4750, USD 5250, and USD 8750 respectively.
10. Is the market size provided in terms of value or volume?
The market size is provided in terms of value, measured in Million and volume, measured in K Unit.
11. Are there any specific market keywords associated with the report?
Yes, the market keyword associated with the report is "Microarray Analysis Industry," which aids in identifying and referencing the specific market segment covered.
12. How do I determine which pricing option suits my needs best?
The pricing options vary based on user requirements and access needs. Individual users may opt for single-user licenses, while businesses requiring broader access may choose multi-user or enterprise licenses for cost-effective access to the report.
13. Are there any additional resources or data provided in the Microarray Analysis Industry report?
While the report offers comprehensive insights, it's advisable to review the specific contents or supplementary materials provided to ascertain if additional resources or data are available.
14. How can I stay updated on further developments or reports in the Microarray Analysis Industry?
To stay informed about further developments, trends, and reports in the Microarray Analysis Industry, consider subscribing to industry newsletters, following relevant companies and organizations, or regularly checking reputable industry news sources and publications.
Methodology
Step 1 - Identification of Relevant Samples Size from Population Database


Step 2 - Approaches for Defining Global Market Size (Value, Volume* & Price*)

Note*: In applicable scenarios
Step 3 - Data Sources
Primary Research
- Web Analytics
- Survey Reports
- Research Institute
- Latest Research Reports
- Opinion Leaders
Secondary Research
- Annual Reports
- White Paper
- Latest Press Release
- Industry Association
- Paid Database
- Investor Presentations

Step 4 - Data Triangulation
Involves using different sources of information in order to increase the validity of a study
These sources are likely to be stakeholders in a program - participants, other researchers, program staff, other community members, and so on.
Then we put all data in single framework & apply various statistical tools to find out the dynamic on the market.
During the analysis stage, feedback from the stakeholder groups would be compared to determine areas of agreement as well as areas of divergence


