

Key Insights
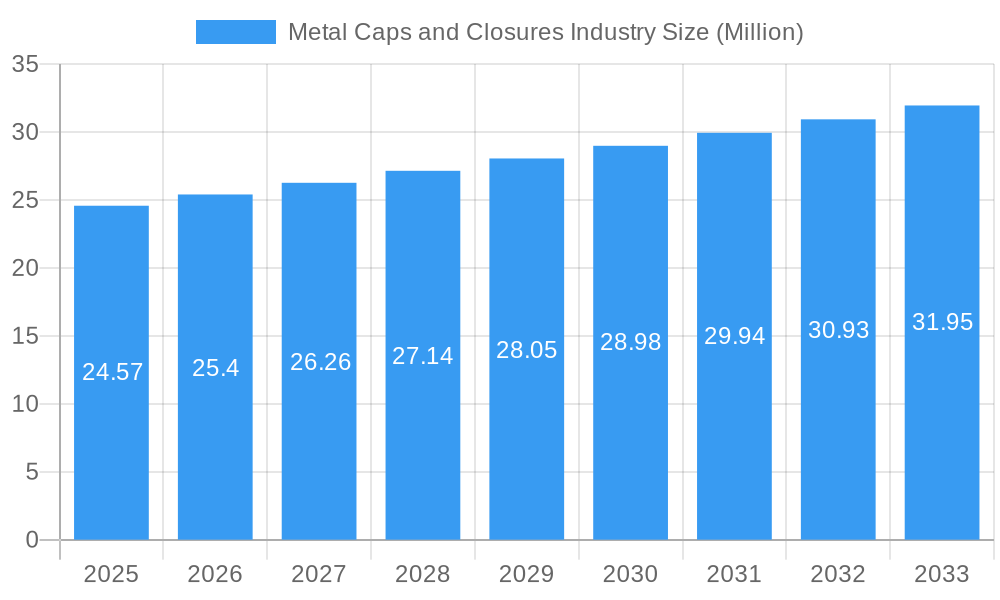
The global Metal Caps and Closures market is poised for steady growth, projected to reach $24.57 million by 2025. This expansion is driven by a robust Compound Annual Growth Rate (CAGR) of 3.38%, indicating sustained demand across various end-user industries. The market is characterized by a diverse range of material types, including Aluminium, Steel, and Tin, catering to a wide spectrum of closure types such as Crown Caps, Screw Caps, and Twist Metal Caps. The food and beverage sectors, encompassing both alcoholic and non-alcoholic products, represent significant demand generators due to their extensive reliance on secure and reliable packaging solutions. Furthermore, the pharmaceutical and personal care industries are increasingly adopting metal caps and closures for their enhanced shelf-life extension, tamper-evidence, and premium aesthetic appeal, contributing to the overall market dynamism.
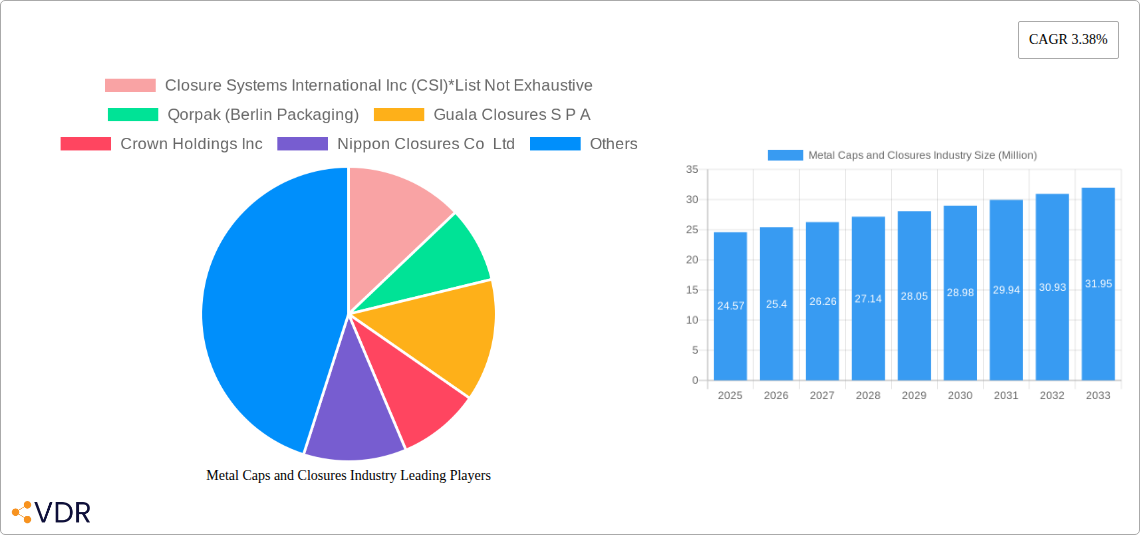
Metal Caps and Closures Industry Market Size (In Million)
The growth trajectory of the Metal Caps and Closures market is further propelled by evolving consumer preferences towards sustainable packaging solutions, where metal offers a recyclable and durable alternative. Innovations in closure designs, focusing on ease of use, improved sealing capabilities, and enhanced safety features, are also playing a crucial role. While the market benefits from strong demand, it also faces certain restraints, including the fluctuating prices of raw materials and the increasing competition from alternative packaging materials like plastic. However, strategic investments in advanced manufacturing technologies and a focus on product differentiation by key industry players are expected to mitigate these challenges. Leading companies like Closure Systems International Inc. (CSI), Guala Closures S.P.A., and Crown Holdings Inc. are at the forefront, driving innovation and market penetration across key geographical regions.
Metal Caps and Closures Industry Company Market Share
Unlocking the Future of Packaging: Metal Caps and Closures Industry Market Report 2025-2033
This comprehensive report delves into the dynamic Metal Caps and Closures Industry, providing an in-depth analysis of market trends, growth drivers, and future outlook. With a focus on both global and regional markets, including parent and child market segments, this report is an essential resource for stakeholders seeking to understand and capitalize on opportunities within this vital sector. Our study spans from 2019–2033, with a base year of 2025, offering historical insights, current estimations, and a robust forecast for the coming decade. We present all values in Million units for clear and consistent understanding.
Metal Caps and Closures Industry Market Dynamics & Structure
The Metal Caps and Closures Industry exhibits a moderately consolidated market structure, with a blend of large multinational corporations and specialized regional manufacturers. Technological innovation remains a primary driver, fueled by advancements in materials science, high-speed manufacturing, and advanced sealing technologies. Regulatory frameworks, particularly concerning food safety, environmental sustainability, and product integrity, play a crucial role in shaping product development and market access. The industry faces competition from alternative packaging materials, such as plastics and glass, necessitating continuous innovation to maintain market share. End-user demographics are evolving, with increasing demand for convenience, premiumization, and sustainable packaging solutions across the Food, Beverages, Pharmaceuticals, and Personal Care sectors. Mergers and acquisitions (M&A) activity is prevalent as companies seek to expand their product portfolios, geographical reach, and technological capabilities. For instance, the recent consolidation in the broader packaging industry indicates a trend towards integration and diversification.
- Market Concentration: Moderately consolidated, with key players holding significant market shares.
- Technological Innovation Drivers: Material science, enhanced sealing mechanisms, automation, and lightweighting.
- Regulatory Frameworks: Stringent regulations for food contact safety, environmental impact (e.g., recyclability), and product shelf-life extension.
- Competitive Product Substitutes: Plastic caps, glass stoppers, and innovative closure designs from alternative materials.
- End-User Demographics: Growing demand for sustainability, convenience, brand differentiation, and tamper-evident features.
- M&A Trends: Strategic acquisitions to enhance product offerings, secure raw material supply, and gain market access.
Metal Caps and Closures Industry Growth Trends & Insights
The Metal Caps and Closures Industry is poised for significant growth, driven by an expanding global population, rising disposable incomes, and increasing consumption of packaged goods. The market size evolution is directly correlated with the growth of end-user industries, particularly the Food & Beverage sector, which accounts for the largest share of demand. Adoption rates for metal caps and closures are steadily increasing, especially for premium products and in regions with developing economies. Technological disruptions, such as the development of lighter-weight yet durable aluminum and steel alloys, are enhancing performance and reducing material costs, further stimulating market penetration. Consumer behavior shifts are playing a pivotal role; there's a pronounced preference for packaging that ensures product freshness and safety, while also aligning with environmental consciousness. The demand for aesthetically pleasing and easy-to-use closures is also on the rise, pushing manufacturers to innovate in design and functionality. The increasing awareness of plastic pollution is inadvertently bolstering the demand for recyclable metal alternatives.
The estimated market size for metal caps and closures is projected to reach XX Million units in 2025, with a projected Compound Annual Growth Rate (CAGR) of XX% during the forecast period of 2025–2033. This growth trajectory is underpinned by several key factors. Firstly, the burgeoning middle class in emerging economies is driving higher per capita consumption of packaged food and beverages, directly translating into increased demand for closures. Secondly, advancements in manufacturing processes, including precision engineering and automated production lines, are enabling higher output and improved quality control, making metal closures a more cost-effective and reliable option. Thirdly, the pharmaceutical industry's stringent requirements for sterile and tamper-evident packaging continue to favor robust metal closures, ensuring product integrity and consumer safety. The personal care sector also presents a growing segment, with consumers seeking high-quality and visually appealing packaging for cosmetics and hygiene products.
Furthermore, the sustainability narrative is becoming increasingly central. While plastic closures have dominated the market for years due to cost and versatility, the growing global focus on reducing plastic waste and promoting a circular economy is creating a significant tailwind for metal caps and closures. Aluminum, in particular, boasts high recyclability rates, and manufacturers are investing in lighter-weight designs and innovative coatings to further enhance their environmental credentials. This shift in consumer and regulatory preference towards sustainable materials is a critical growth accelerator. The ongoing development of advanced coating technologies also plays a vital role, ensuring compatibility with a wide range of products, from acidic beverages to sensitive pharmaceuticals, without compromising taste or safety. The report analyzes these multifaceted trends, offering granular insights into market penetration, adoption rates, and the impact of technological advancements on market evolution.
Dominant Regions, Countries, or Segments in Metal Caps and Closures Industry
The Metal Caps and Closures Industry is significantly influenced by regional economic conditions, consumer preferences, and the strength of its end-user industries. Asia Pacific is emerging as the dominant region, driven by its massive population, rapid industrialization, and growing consumer markets. Countries like China and India, with their burgeoning middle class and expanding food and beverage manufacturing sectors, are major consumers and producers of metal caps and closures. The increasing demand for packaged goods, coupled with government initiatives promoting local manufacturing and exports, further fuels this dominance.
Within the Material Type segment, Aluminum closures are witnessing substantial growth due to their lightweight properties, excellent corrosion resistance, and high recyclability, making them a preferred choice for beverages, food, and personal care products. Steel remains a critical material, especially for applications requiring high strength and durability, such as in industrial lubricants and certain food products. Tin closures, while a smaller segment, are vital for specific food packaging applications requiring their unique barrier properties.
In terms of Closures Type, Screw Caps represent the largest and fastest-growing segment. Their ease of use, resealability, and compatibility with a wide range of bottle neck finishes make them ideal for beverages (alcoholic and non-alcoholic), food products, and personal care items. Crown Caps continue to hold a strong position, particularly in the beer and carbonated soft drink markets, where their proven sealing capabilities and cost-effectiveness are highly valued. Twist Metal Caps also cater to specific food and beverage applications requiring quick and convenient access.
The Food and Beverages (both Alcoholic and Non-Alcoholic) end-user industries are the primary drivers of market growth. The ever-increasing global demand for processed foods, ready-to-drink beverages, and alcoholic beverages directly translates into a higher requirement for reliable and safe packaging solutions. The Pharmaceuticals sector is another significant segment, demanding highly secure and tamper-evident metal closures to ensure drug integrity and patient safety. The Personal Care segment is also contributing to growth, with a rising demand for premium and aesthetically pleasing packaging.
- Dominant Region: Asia Pacific
- Key Drivers: Large population, growing middle class, expanding food and beverage industry, government support for manufacturing.
- Leading Countries: China, India, Southeast Asian nations.
- Dominant Material Type: Aluminum
- Growth Factors: Lightweight, recyclability, corrosion resistance, versatility for beverages and personal care.
- Dominant Closure Type: Screw Caps
- Market Share & Growth: High adoption rates due to convenience, resealability, and broad application across industries.
- Dominant End-User Industries: Food & Beverages
- Market Share: Largest consumers due to high volume of packaged goods.
- Growth Potential: Continuous demand for convenience and preservation.
Metal Caps and Closures Industry Product Landscape
The product landscape of the Metal Caps and Closures Industry is characterized by a focus on enhanced functionality, sustainability, and aesthetic appeal. Innovations include lighter-weight aluminum and steel caps that reduce material usage without compromising strength, alongside advanced barrier coatings that ensure product integrity and extend shelf life. Tamper-evident features are paramount, with technologies such as induction seals and tear-off bands integrated into closure designs to provide clear indications of product tampering. The industry is also witnessing a surge in customizable designs, offering manufacturers opportunities for brand differentiation through embossing, printing, and unique color finishes. Performance metrics such as sealing integrity, ease of opening, and compatibility with diverse filling processes are continuously being optimized.
Key Drivers, Barriers & Challenges in Metal Caps and Closures Industry
The Metal Caps and Closures Industry is propelled by several key drivers. The escalating global demand for packaged food and beverages, particularly in emerging economies, serves as a primary growth engine. The increasing emphasis on product safety, shelf-life extension, and tamper-evidence directly favors the use of robust metal closures. Furthermore, the growing consumer and regulatory push for sustainable packaging solutions is creating significant opportunities for recyclable metal alternatives, such as aluminum. Technological advancements in materials science and manufacturing processes enable the development of lighter, more efficient, and cost-effective closures.
However, the industry faces notable barriers and challenges. Competition from alternative packaging materials, primarily plastics, remains a significant restraint due to their perceived lower cost and versatility in certain applications. Fluctuations in raw material prices, particularly for aluminum and steel, can impact manufacturing costs and profit margins. Stringent environmental regulations regarding material sourcing and waste management, while also a driver for innovation, can pose compliance challenges. Supply chain disruptions, geopolitical instability, and trade policies can affect the availability and cost of raw materials and finished products. Furthermore, the high initial investment required for advanced manufacturing technologies can be a barrier for smaller players.
Emerging Opportunities in Metal Caps and Closures Industry
Emerging opportunities within the Metal Caps and Closures Industry are multifaceted. The expanding market for premium and craft beverages, including artisanal beers, wines, and spirits, presents a significant avenue for customized and aesthetically appealing metal closures that enhance brand perception. The growth of the e-commerce sector for food and beverage products is driving demand for closures that offer superior protection against transit damage and leakage. Furthermore, the increasing focus on health and wellness is creating opportunities for specialized closures in the nutraceutical and functional food segments, requiring enhanced barrier properties and sterility. The development of "smart" closures embedded with RFID or NFC technology for product traceability and consumer engagement also represents a promising frontier.
Growth Accelerators in the Metal Caps and Closures Industry Industry
Several factors are accelerating long-term growth in the Metal Caps and Closures Industry. Ongoing technological breakthroughs in lightweighting alloys and advanced coating technologies are making metal closures more competitive and sustainable. Strategic partnerships between closure manufacturers and packaging converters are streamlining supply chains and fostering innovation. Market expansion strategies, particularly targeting underserved emerging economies with growing middle classes, are opening new avenues for growth. The increasing adoption of sustainable manufacturing practices and circular economy principles by key industry players is enhancing brand reputation and appealing to environmentally conscious consumers and businesses.
Key Players Shaping the Metal Caps and Closures Industry Market
- Closure Systems International Inc (CSI)
- Qorpak (Berlin Packaging)
- Guala Closures S P A
- Crown Holdings Inc
- Nippon Closures Co Ltd
- Amcor PLC
- Pelliconi & C SpA
- Sks Bottle & Packaging Inc
- Alameda Packaging LLC
- Silgan White Cap LLC
- O Berk Company
Notable Milestones in Metal Caps and Closures Industry Sector
- January 2023: Guala Closures Group received validation from the Science Based Targets Initiative (SBTi) for its 2030 Greenhouse Gas (GHG) emission targets, aligning with the 1.5°C goal. The company pledged a 44% reduction in absolute scope 1 and 2 GHG emissions by 2030 (from a 2020 baseline).
- March 2022: Pelliconi announced the opening of an Outpost at the Mind the Bridge Innovation Center in San Francisco, signifying its commitment to embracing international market challenges and identifying emerging trends for the Food & Beverage Industry.
In-Depth Metal Caps and Closures Industry Market Outlook
The Metal Caps and Closures Industry is set for robust expansion, driven by an intensified focus on sustainability and product integrity. Future market potential lies in the continued innovation of recyclable and biodegradable materials, alongside advancements in tamper-evident and child-resistant closure technologies. Strategic opportunities include expanding into niche markets such as artisanal food and beverage, and leveraging digitalization for enhanced supply chain efficiency and consumer engagement. The industry's ability to adapt to evolving environmental regulations and consumer preferences will be paramount in realizing its full growth potential.
Metal Caps and Closures Industry Segmentation
-
1. Material Type
- 1.1. Aluminium
- 1.2. Steel
- 1.3. Tin
-
2. Closures Type
- 2.1. Crown Caps
- 2.2. Screw Caps
- 2.3. Twist Metal Caps
- 2.4. Other Cl
-
3. End-User Industry
- 3.1. Food
-
3.2. Beverages
- 3.2.1. Alcoholic
- 3.2.2. Non-Alcoholic
- 3.3. Pharmaceuticals
- 3.4. Personal Care
- 3.5. Other End-User Industries
Metal Caps and Closures Industry Segmentation By Geography
- 1. North America
- 2. Europe
- 3. Asia
- 4. Australia and New Zealand
- 5. Latin America
- 6. Middle East and Africa
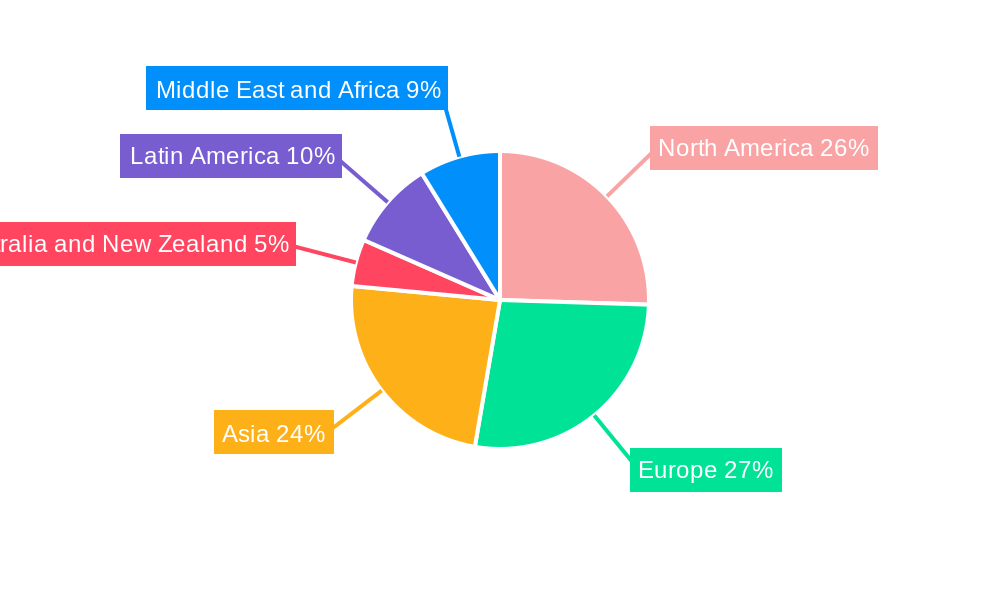
Metal Caps and Closures Industry Regional Market Share
Geographic Coverage of Metal Caps and Closures Industry
Metal Caps and Closures Industry REPORT HIGHLIGHTS
| Aspects | Details |
|---|---|
| Study Period | 2020-2034 |
| Base Year | 2025 |
| Estimated Year | 2026 |
| Forecast Period | 2026-2034 |
| Historical Period | 2020-2025 |
| Growth Rate | CAGR of 3.38% from 2020-2034 |
| Segmentation |
|
Table of Contents
- 1. Introduction
- 1.1. Research Scope
- 1.2. Market Segmentation
- 1.3. Research Objective
- 1.4. Definitions and Assumptions
- 2. Executive Summary
- 2.1. Market Snapshot
- 3. Market Dynamics
- 3.1. Market Drivers
- 3.2. Market Restrains
- 3.3. Market Trends
- 3.4. Market Opportunities
- 4. Market Factor Analysis
- 4.1. Porters Five Forces
- 4.1.1. Bargaining Power of Suppliers
- 4.1.2. Bargaining Power of Buyers
- 4.1.3. Threat of New Entrants
- 4.1.4. Threat of Substitutes
- 4.1.5. Competitive Rivalry
- 4.2. PESTEL analysis
- 4.3. BCG Analysis
- 4.3.1. Stars (High Growth, High Market Share)
- 4.3.2. Cash Cows (Low Growth, High Market Share)
- 4.3.3. Question Mark (High Growth, Low Market Share)
- 4.3.4. Dogs (Low Growth, Low Market Share)
- 4.4. Ansoff Matrix Analysis
- 4.5. Supply Chain Analysis
- 4.6. Regulatory Landscape
- 4.7. Current Market Potential and Opportunity Assessment (TAM–SAM–SOM Framework)
- 4.8. VDR Analyst Note
- 4.1. Porters Five Forces
- 5. Market Analysis, Insights and Forecast 2021-2033
- 5.1. Market Analysis, Insights and Forecast - by Material Type
- 5.1.1. Aluminium
- 5.1.2. Steel
- 5.1.3. Tin
- 5.2. Market Analysis, Insights and Forecast - by Closures Type
- 5.2.1. Crown Caps
- 5.2.2. Screw Caps
- 5.2.3. Twist Metal Caps
- 5.2.4. Other Cl
- 5.3. Market Analysis, Insights and Forecast - by End-User Industry
- 5.3.1. Food
- 5.3.2. Beverages
- 5.3.2.1. Alcoholic
- 5.3.2.2. Non-Alcoholic
- 5.3.3. Pharmaceuticals
- 5.3.4. Personal Care
- 5.3.5. Other End-User Industries
- 5.4. Market Analysis, Insights and Forecast - by Region
- 5.4.1. North America
- 5.4.2. Europe
- 5.4.3. Asia
- 5.4.4. Australia and New Zealand
- 5.4.5. Latin America
- 5.4.6. Middle East and Africa
- 5.1. Market Analysis, Insights and Forecast - by Material Type
- 6. Global Metal Caps and Closures Industry Analysis, Insights and Forecast, 2021-2033
- 6.1. Market Analysis, Insights and Forecast - by Material Type
- 6.1.1. Aluminium
- 6.1.2. Steel
- 6.1.3. Tin
- 6.2. Market Analysis, Insights and Forecast - by Closures Type
- 6.2.1. Crown Caps
- 6.2.2. Screw Caps
- 6.2.3. Twist Metal Caps
- 6.2.4. Other Cl
- 6.3. Market Analysis, Insights and Forecast - by End-User Industry
- 6.3.1. Food
- 6.3.2. Beverages
- 6.3.2.1. Alcoholic
- 6.3.2.2. Non-Alcoholic
- 6.3.3. Pharmaceuticals
- 6.3.4. Personal Care
- 6.3.5. Other End-User Industries
- 6.1. Market Analysis, Insights and Forecast - by Material Type
- 7. North America Metal Caps and Closures Industry Analysis, Insights and Forecast, 2021-2033
- 7.1. Market Analysis, Insights and Forecast - by Material Type
- 7.1.1. Aluminium
- 7.1.2. Steel
- 7.1.3. Tin
- 7.2. Market Analysis, Insights and Forecast - by Closures Type
- 7.2.1. Crown Caps
- 7.2.2. Screw Caps
- 7.2.3. Twist Metal Caps
- 7.2.4. Other Cl
- 7.3. Market Analysis, Insights and Forecast - by End-User Industry
- 7.3.1. Food
- 7.3.2. Beverages
- 7.3.2.1. Alcoholic
- 7.3.2.2. Non-Alcoholic
- 7.3.3. Pharmaceuticals
- 7.3.4. Personal Care
- 7.3.5. Other End-User Industries
- 7.1. Market Analysis, Insights and Forecast - by Material Type
- 8. Europe Metal Caps and Closures Industry Analysis, Insights and Forecast, 2021-2033
- 8.1. Market Analysis, Insights and Forecast - by Material Type
- 8.1.1. Aluminium
- 8.1.2. Steel
- 8.1.3. Tin
- 8.2. Market Analysis, Insights and Forecast - by Closures Type
- 8.2.1. Crown Caps
- 8.2.2. Screw Caps
- 8.2.3. Twist Metal Caps
- 8.2.4. Other Cl
- 8.3. Market Analysis, Insights and Forecast - by End-User Industry
- 8.3.1. Food
- 8.3.2. Beverages
- 8.3.2.1. Alcoholic
- 8.3.2.2. Non-Alcoholic
- 8.3.3. Pharmaceuticals
- 8.3.4. Personal Care
- 8.3.5. Other End-User Industries
- 8.1. Market Analysis, Insights and Forecast - by Material Type
- 9. Asia Metal Caps and Closures Industry Analysis, Insights and Forecast, 2021-2033
- 9.1. Market Analysis, Insights and Forecast - by Material Type
- 9.1.1. Aluminium
- 9.1.2. Steel
- 9.1.3. Tin
- 9.2. Market Analysis, Insights and Forecast - by Closures Type
- 9.2.1. Crown Caps
- 9.2.2. Screw Caps
- 9.2.3. Twist Metal Caps
- 9.2.4. Other Cl
- 9.3. Market Analysis, Insights and Forecast - by End-User Industry
- 9.3.1. Food
- 9.3.2. Beverages
- 9.3.2.1. Alcoholic
- 9.3.2.2. Non-Alcoholic
- 9.3.3. Pharmaceuticals
- 9.3.4. Personal Care
- 9.3.5. Other End-User Industries
- 9.1. Market Analysis, Insights and Forecast - by Material Type
- 10. Australia and New Zealand Metal Caps and Closures Industry Analysis, Insights and Forecast, 2021-2033
- 10.1. Market Analysis, Insights and Forecast - by Material Type
- 10.1.1. Aluminium
- 10.1.2. Steel
- 10.1.3. Tin
- 10.2. Market Analysis, Insights and Forecast - by Closures Type
- 10.2.1. Crown Caps
- 10.2.2. Screw Caps
- 10.2.3. Twist Metal Caps
- 10.2.4. Other Cl
- 10.3. Market Analysis, Insights and Forecast - by End-User Industry
- 10.3.1. Food
- 10.3.2. Beverages
- 10.3.2.1. Alcoholic
- 10.3.2.2. Non-Alcoholic
- 10.3.3. Pharmaceuticals
- 10.3.4. Personal Care
- 10.3.5. Other End-User Industries
- 10.1. Market Analysis, Insights and Forecast - by Material Type
- 11. Latin America Metal Caps and Closures Industry Analysis, Insights and Forecast, 2021-2033
- 11.1. Market Analysis, Insights and Forecast - by Material Type
- 11.1.1. Aluminium
- 11.1.2. Steel
- 11.1.3. Tin
- 11.2. Market Analysis, Insights and Forecast - by Closures Type
- 11.2.1. Crown Caps
- 11.2.2. Screw Caps
- 11.2.3. Twist Metal Caps
- 11.2.4. Other Cl
- 11.3. Market Analysis, Insights and Forecast - by End-User Industry
- 11.3.1. Food
- 11.3.2. Beverages
- 11.3.2.1. Alcoholic
- 11.3.2.2. Non-Alcoholic
- 11.3.3. Pharmaceuticals
- 11.3.4. Personal Care
- 11.3.5. Other End-User Industries
- 11.1. Market Analysis, Insights and Forecast - by Material Type
- 12. Middle East and Africa Metal Caps and Closures Industry Analysis, Insights and Forecast, 2021-2033
- 12.1. Market Analysis, Insights and Forecast - by Material Type
- 12.1.1. Aluminium
- 12.1.2. Steel
- 12.1.3. Tin
- 12.2. Market Analysis, Insights and Forecast - by Closures Type
- 12.2.1. Crown Caps
- 12.2.2. Screw Caps
- 12.2.3. Twist Metal Caps
- 12.2.4. Other Cl
- 12.3. Market Analysis, Insights and Forecast - by End-User Industry
- 12.3.1. Food
- 12.3.2. Beverages
- 12.3.2.1. Alcoholic
- 12.3.2.2. Non-Alcoholic
- 12.3.3. Pharmaceuticals
- 12.3.4. Personal Care
- 12.3.5. Other End-User Industries
- 12.1. Market Analysis, Insights and Forecast - by Material Type
- 13. Competitive Analysis
- 13.1. Company Profiles
- 13.1.1 Closure Systems International Inc (CSI)*List Not Exhaustive
- 13.1.1.1. Company Overview
- 13.1.1.2. Products
- 13.1.1.3. Company Financials
- 13.1.1.4. SWOT Analysis
- 13.1.2 Qorpak (Berlin Packaging)
- 13.1.2.1. Company Overview
- 13.1.2.2. Products
- 13.1.2.3. Company Financials
- 13.1.2.4. SWOT Analysis
- 13.1.3 Guala Closures S P A
- 13.1.3.1. Company Overview
- 13.1.3.2. Products
- 13.1.3.3. Company Financials
- 13.1.3.4. SWOT Analysis
- 13.1.4 Crown Holdings Inc
- 13.1.4.1. Company Overview
- 13.1.4.2. Products
- 13.1.4.3. Company Financials
- 13.1.4.4. SWOT Analysis
- 13.1.5 Nippon Closures Co Ltd
- 13.1.5.1. Company Overview
- 13.1.5.2. Products
- 13.1.5.3. Company Financials
- 13.1.5.4. SWOT Analysis
- 13.1.6 Amcor PLC
- 13.1.6.1. Company Overview
- 13.1.6.2. Products
- 13.1.6.3. Company Financials
- 13.1.6.4. SWOT Analysis
- 13.1.7 Pelliconi & C SpA
- 13.1.7.1. Company Overview
- 13.1.7.2. Products
- 13.1.7.3. Company Financials
- 13.1.7.4. SWOT Analysis
- 13.1.8 Sks Bottle & Packaging Inc
- 13.1.8.1. Company Overview
- 13.1.8.2. Products
- 13.1.8.3. Company Financials
- 13.1.8.4. SWOT Analysis
- 13.1.9 Alameda Packaging LLC
- 13.1.9.1. Company Overview
- 13.1.9.2. Products
- 13.1.9.3. Company Financials
- 13.1.9.4. SWOT Analysis
- 13.1.10 Silgan White Cap LLC
- 13.1.10.1. Company Overview
- 13.1.10.2. Products
- 13.1.10.3. Company Financials
- 13.1.10.4. SWOT Analysis
- 13.1.11 O Berk Company
- 13.1.11.1. Company Overview
- 13.1.11.2. Products
- 13.1.11.3. Company Financials
- 13.1.11.4. SWOT Analysis
- 13.1.1 Closure Systems International Inc (CSI)*List Not Exhaustive
- 13.2. Market Entropy
- 13.2.1 Company's Key Areas Served
- 13.2.2 Recent Developments
- 13.3. Company Market Share Analysis 2025
- 13.3.1 Top 5 Companies Market Share Analysis
- 13.3.2 Top 3 Companies Market Share Analysis
- 13.4. List of Potential Customers
- 14. Research Methodology
List of Figures
- Figure 1: Global Metal Caps and Closures Industry Revenue Breakdown (Million, %) by Region 2025 & 2033
- Figure 2: North America Metal Caps and Closures Industry Revenue (Million), by Material Type 2025 & 2033
- Figure 3: North America Metal Caps and Closures Industry Revenue Share (%), by Material Type 2025 & 2033
- Figure 4: North America Metal Caps and Closures Industry Revenue (Million), by Closures Type 2025 & 2033
- Figure 5: North America Metal Caps and Closures Industry Revenue Share (%), by Closures Type 2025 & 2033
- Figure 6: North America Metal Caps and Closures Industry Revenue (Million), by End-User Industry 2025 & 2033
- Figure 7: North America Metal Caps and Closures Industry Revenue Share (%), by End-User Industry 2025 & 2033
- Figure 8: North America Metal Caps and Closures Industry Revenue (Million), by Country 2025 & 2033
- Figure 9: North America Metal Caps and Closures Industry Revenue Share (%), by Country 2025 & 2033
- Figure 10: Europe Metal Caps and Closures Industry Revenue (Million), by Material Type 2025 & 2033
- Figure 11: Europe Metal Caps and Closures Industry Revenue Share (%), by Material Type 2025 & 2033
- Figure 12: Europe Metal Caps and Closures Industry Revenue (Million), by Closures Type 2025 & 2033
- Figure 13: Europe Metal Caps and Closures Industry Revenue Share (%), by Closures Type 2025 & 2033
- Figure 14: Europe Metal Caps and Closures Industry Revenue (Million), by End-User Industry 2025 & 2033
- Figure 15: Europe Metal Caps and Closures Industry Revenue Share (%), by End-User Industry 2025 & 2033
- Figure 16: Europe Metal Caps and Closures Industry Revenue (Million), by Country 2025 & 2033
- Figure 17: Europe Metal Caps and Closures Industry Revenue Share (%), by Country 2025 & 2033
- Figure 18: Asia Metal Caps and Closures Industry Revenue (Million), by Material Type 2025 & 2033
- Figure 19: Asia Metal Caps and Closures Industry Revenue Share (%), by Material Type 2025 & 2033
- Figure 20: Asia Metal Caps and Closures Industry Revenue (Million), by Closures Type 2025 & 2033
- Figure 21: Asia Metal Caps and Closures Industry Revenue Share (%), by Closures Type 2025 & 2033
- Figure 22: Asia Metal Caps and Closures Industry Revenue (Million), by End-User Industry 2025 & 2033
- Figure 23: Asia Metal Caps and Closures Industry Revenue Share (%), by End-User Industry 2025 & 2033
- Figure 24: Asia Metal Caps and Closures Industry Revenue (Million), by Country 2025 & 2033
- Figure 25: Asia Metal Caps and Closures Industry Revenue Share (%), by Country 2025 & 2033
- Figure 26: Australia and New Zealand Metal Caps and Closures Industry Revenue (Million), by Material Type 2025 & 2033
- Figure 27: Australia and New Zealand Metal Caps and Closures Industry Revenue Share (%), by Material Type 2025 & 2033
- Figure 28: Australia and New Zealand Metal Caps and Closures Industry Revenue (Million), by Closures Type 2025 & 2033
- Figure 29: Australia and New Zealand Metal Caps and Closures Industry Revenue Share (%), by Closures Type 2025 & 2033
- Figure 30: Australia and New Zealand Metal Caps and Closures Industry Revenue (Million), by End-User Industry 2025 & 2033
- Figure 31: Australia and New Zealand Metal Caps and Closures Industry Revenue Share (%), by End-User Industry 2025 & 2033
- Figure 32: Australia and New Zealand Metal Caps and Closures Industry Revenue (Million), by Country 2025 & 2033
- Figure 33: Australia and New Zealand Metal Caps and Closures Industry Revenue Share (%), by Country 2025 & 2033
- Figure 34: Latin America Metal Caps and Closures Industry Revenue (Million), by Material Type 2025 & 2033
- Figure 35: Latin America Metal Caps and Closures Industry Revenue Share (%), by Material Type 2025 & 2033
- Figure 36: Latin America Metal Caps and Closures Industry Revenue (Million), by Closures Type 2025 & 2033
- Figure 37: Latin America Metal Caps and Closures Industry Revenue Share (%), by Closures Type 2025 & 2033
- Figure 38: Latin America Metal Caps and Closures Industry Revenue (Million), by End-User Industry 2025 & 2033
- Figure 39: Latin America Metal Caps and Closures Industry Revenue Share (%), by End-User Industry 2025 & 2033
- Figure 40: Latin America Metal Caps and Closures Industry Revenue (Million), by Country 2025 & 2033
- Figure 41: Latin America Metal Caps and Closures Industry Revenue Share (%), by Country 2025 & 2033
- Figure 42: Middle East and Africa Metal Caps and Closures Industry Revenue (Million), by Material Type 2025 & 2033
- Figure 43: Middle East and Africa Metal Caps and Closures Industry Revenue Share (%), by Material Type 2025 & 2033
- Figure 44: Middle East and Africa Metal Caps and Closures Industry Revenue (Million), by Closures Type 2025 & 2033
- Figure 45: Middle East and Africa Metal Caps and Closures Industry Revenue Share (%), by Closures Type 2025 & 2033
- Figure 46: Middle East and Africa Metal Caps and Closures Industry Revenue (Million), by End-User Industry 2025 & 2033
- Figure 47: Middle East and Africa Metal Caps and Closures Industry Revenue Share (%), by End-User Industry 2025 & 2033
- Figure 48: Middle East and Africa Metal Caps and Closures Industry Revenue (Million), by Country 2025 & 2033
- Figure 49: Middle East and Africa Metal Caps and Closures Industry Revenue Share (%), by Country 2025 & 2033
List of Tables
- Table 1: Global Metal Caps and Closures Industry Revenue Million Forecast, by Material Type 2020 & 2033
- Table 2: Global Metal Caps and Closures Industry Revenue Million Forecast, by Closures Type 2020 & 2033
- Table 3: Global Metal Caps and Closures Industry Revenue Million Forecast, by End-User Industry 2020 & 2033
- Table 4: Global Metal Caps and Closures Industry Revenue Million Forecast, by Region 2020 & 2033
- Table 5: Global Metal Caps and Closures Industry Revenue Million Forecast, by Material Type 2020 & 2033
- Table 6: Global Metal Caps and Closures Industry Revenue Million Forecast, by Closures Type 2020 & 2033
- Table 7: Global Metal Caps and Closures Industry Revenue Million Forecast, by End-User Industry 2020 & 2033
- Table 8: Global Metal Caps and Closures Industry Revenue Million Forecast, by Country 2020 & 2033
- Table 9: Global Metal Caps and Closures Industry Revenue Million Forecast, by Material Type 2020 & 2033
- Table 10: Global Metal Caps and Closures Industry Revenue Million Forecast, by Closures Type 2020 & 2033
- Table 11: Global Metal Caps and Closures Industry Revenue Million Forecast, by End-User Industry 2020 & 2033
- Table 12: Global Metal Caps and Closures Industry Revenue Million Forecast, by Country 2020 & 2033
- Table 13: Global Metal Caps and Closures Industry Revenue Million Forecast, by Material Type 2020 & 2033
- Table 14: Global Metal Caps and Closures Industry Revenue Million Forecast, by Closures Type 2020 & 2033
- Table 15: Global Metal Caps and Closures Industry Revenue Million Forecast, by End-User Industry 2020 & 2033
- Table 16: Global Metal Caps and Closures Industry Revenue Million Forecast, by Country 2020 & 2033
- Table 17: Global Metal Caps and Closures Industry Revenue Million Forecast, by Material Type 2020 & 2033
- Table 18: Global Metal Caps and Closures Industry Revenue Million Forecast, by Closures Type 2020 & 2033
- Table 19: Global Metal Caps and Closures Industry Revenue Million Forecast, by End-User Industry 2020 & 2033
- Table 20: Global Metal Caps and Closures Industry Revenue Million Forecast, by Country 2020 & 2033
- Table 21: Global Metal Caps and Closures Industry Revenue Million Forecast, by Material Type 2020 & 2033
- Table 22: Global Metal Caps and Closures Industry Revenue Million Forecast, by Closures Type 2020 & 2033
- Table 23: Global Metal Caps and Closures Industry Revenue Million Forecast, by End-User Industry 2020 & 2033
- Table 24: Global Metal Caps and Closures Industry Revenue Million Forecast, by Country 2020 & 2033
- Table 25: Global Metal Caps and Closures Industry Revenue Million Forecast, by Material Type 2020 & 2033
- Table 26: Global Metal Caps and Closures Industry Revenue Million Forecast, by Closures Type 2020 & 2033
- Table 27: Global Metal Caps and Closures Industry Revenue Million Forecast, by End-User Industry 2020 & 2033
- Table 28: Global Metal Caps and Closures Industry Revenue Million Forecast, by Country 2020 & 2033
Frequently Asked Questions
1. What is the projected Compound Annual Growth Rate (CAGR) of the Metal Caps and Closures Industry?
The projected CAGR is approximately 3.38%.
2. Which companies are prominent players in the Metal Caps and Closures Industry?
Key companies in the market include Closure Systems International Inc (CSI)*List Not Exhaustive, Qorpak (Berlin Packaging), Guala Closures S P A, Crown Holdings Inc, Nippon Closures Co Ltd, Amcor PLC, Pelliconi & C SpA, Sks Bottle & Packaging Inc, Alameda Packaging LLC, Silgan White Cap LLC, O Berk Company.
3. What are the main segments of the Metal Caps and Closures Industry?
The market segments include Material Type, Closures Type, End-User Industry.
4. Can you provide details about the market size?
The market size is estimated to be USD 24.57 Million as of 2022.
5. What are some drivers contributing to market growth?
Increasing Consumption of Beverages with a Rising Need for Sustainable Packaging Materials; Superior Properties Compared to Other Closure Materials.
6. What are the notable trends driving market growth?
Pharmaceutical Application Offers Potential Growth.
7. Are there any restraints impacting market growth?
High Adoption Rate of Other Types of Closure Materials.
8. Can you provide examples of recent developments in the market?
January 2023: Guala Closures Group, a prominent manufacturer of aluminum and specialty closures, received validation from the Science Based Targets Initiative (SBTi) for its 2030 Greenhouse Gas (GHG) emission targets. The targets have been recognized as meeting the ambitious 1.5°C goal, which is a significant milestone in the group's sustainability journey. The company has pledged to reduce absolute scope 1 and 2 GHG emissions by 44% by 2030, based on a 2020 starting point, by adopting science-based targets.
9. What pricing options are available for accessing the report?
Pricing options include single-user, multi-user, and enterprise licenses priced at USD 4750, USD 5250, and USD 8750 respectively.
10. Is the market size provided in terms of value or volume?
The market size is provided in terms of value, measured in Million.
11. Are there any specific market keywords associated with the report?
Yes, the market keyword associated with the report is "Metal Caps and Closures Industry," which aids in identifying and referencing the specific market segment covered.
12. How do I determine which pricing option suits my needs best?
The pricing options vary based on user requirements and access needs. Individual users may opt for single-user licenses, while businesses requiring broader access may choose multi-user or enterprise licenses for cost-effective access to the report.
13. Are there any additional resources or data provided in the Metal Caps and Closures Industry report?
While the report offers comprehensive insights, it's advisable to review the specific contents or supplementary materials provided to ascertain if additional resources or data are available.
14. How can I stay updated on further developments or reports in the Metal Caps and Closures Industry?
To stay informed about further developments, trends, and reports in the Metal Caps and Closures Industry, consider subscribing to industry newsletters, following relevant companies and organizations, or regularly checking reputable industry news sources and publications.
Methodology
Step 1 - Identification of Relevant Samples Size from Population Database


Step 2 - Approaches for Defining Global Market Size (Value, Volume* & Price*)

Note*: In applicable scenarios
Step 3 - Data Sources
Primary Research
- Web Analytics
- Survey Reports
- Research Institute
- Latest Research Reports
- Opinion Leaders
Secondary Research
- Annual Reports
- White Paper
- Latest Press Release
- Industry Association
- Paid Database
- Investor Presentations

Step 4 - Data Triangulation
Involves using different sources of information in order to increase the validity of a study
These sources are likely to be stakeholders in a program - participants, other researchers, program staff, other community members, and so on.
Then we put all data in single framework & apply various statistical tools to find out the dynamic on the market.
During the analysis stage, feedback from the stakeholder groups would be compared to determine areas of agreement as well as areas of divergence