

Key Insights
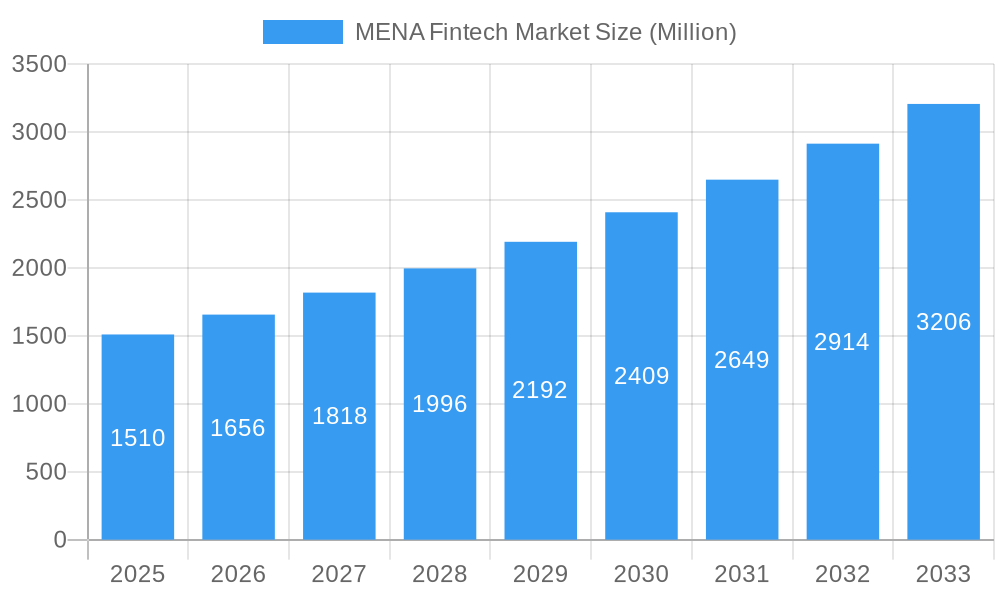
The MENA (Middle East and North Africa) Fintech market is experiencing robust growth, projected to reach $1.51 billion in 2025 and exhibiting a Compound Annual Growth Rate (CAGR) of 9.71% from 2019 to 2033. This expansion is fueled by several key drivers. Firstly, the region's young and rapidly growing population, increasingly tech-savvy and comfortable with digital transactions, is creating a fertile ground for FinTech innovation. Secondly, government initiatives aimed at diversifying economies and promoting digital transformation are fostering a supportive regulatory environment. Thirdly, the relatively low penetration of traditional financial services in some parts of the region creates significant opportunities for FinTech companies to offer innovative solutions, particularly in areas like mobile payments, digital lending, and wealth management. The rising adoption of smartphones and increasing internet penetration further accelerate this growth. While challenges remain, such as infrastructure limitations in certain areas and cybersecurity concerns, the overall market outlook remains positive.
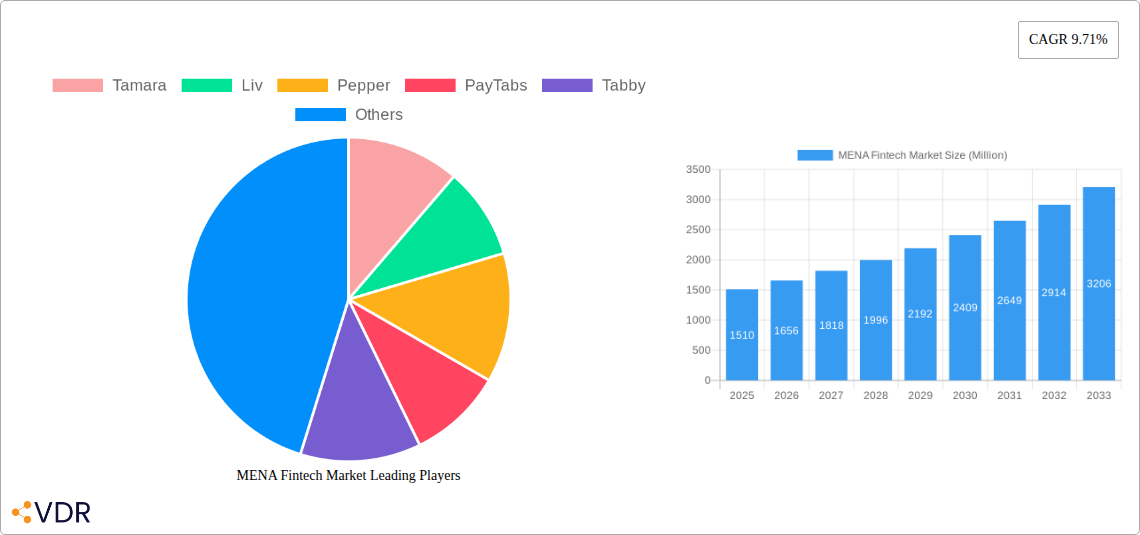
MENA Fintech Market Market Size (In Billion)
Despite these positive factors, several restraints are impacting the market's trajectory. Concerns about data privacy and security, along with regulatory uncertainty in some jurisdictions, can hinder adoption. Furthermore, a lack of financial literacy amongst certain segments of the population might present a hurdle to widespread FinTech adoption. However, the continuous efforts by regulatory bodies to establish clearer guidelines and boost consumer confidence are expected to mitigate these concerns. The market segmentation is diverse, encompassing various services from payment gateways (like PayTabs and Tabby) to investment platforms (Sarwa and Eureeca) and digital banking solutions (Ila Bank). Leading players like Tamara, Liv, Pepper, and Bayzat are constantly innovating to cater to evolving consumer demands and carve out their niche within this competitive landscape. The continuous evolution of technology, particularly in areas like artificial intelligence and blockchain, is expected to further reshape the MENA FinTech landscape in the coming years.
MENA Fintech Market Company Market Share
MENA Fintech Market: A Comprehensive Report (2019-2033)
This in-depth report provides a comprehensive analysis of the Middle East and North Africa (MENA) Fintech market, covering market dynamics, growth trends, key players, and future outlook. With a focus on parent and child markets, this report is essential for investors, industry professionals, and strategic decision-makers seeking to understand and capitalize on opportunities within this rapidly evolving sector. The report analyzes the market from 2019 to 2024 (Historical Period), with a base year of 2025 and forecasts extending to 2033 (Forecast Period). The total market size is projected to reach xx Million by 2033.
MENA Fintech Market Dynamics & Structure
The MENA Fintech market is characterized by a dynamic interplay of factors driving its growth and shaping its competitive landscape. Market concentration is currently moderate, with several key players vying for dominance, while technological innovation is a key driver of expansion. Stringent regulatory frameworks are constantly evolving, impacting market access and operational compliance for Fintech companies. The market also faces competition from traditional financial institutions, though the rise of mobile adoption and increasing digital literacy is significantly reducing this pressure.
- Market Concentration: Moderate, with a few dominant players and several emerging competitors. xx% market share controlled by top 5 players in 2024.
- Technological Innovation: Rapid advancements in AI, blockchain, and mobile payment technologies are fueling market expansion.
- Regulatory Frameworks: Varying regulatory environments across the MENA region create both opportunities and challenges.
- Competitive Product Substitutes: Traditional financial services act as key competitors. However, the growing preference for digital services limits their impact.
- End-User Demographics: A young, tech-savvy population fuels high adoption rates of Fintech products and services.
- M&A Trends: Consolidation and strategic partnerships are increasing, reflecting the market's maturity and competitive intensity. xx M&A deals recorded in 2024.
MENA Fintech Market Growth Trends & Insights
The MENA Fintech market has witnessed significant growth over the past five years, driven by rising smartphone penetration, increased internet access, and a burgeoning entrepreneurial ecosystem. This growth is reflected in the increasing adoption of digital financial services across various segments, including payments, lending, and investments. The market is expected to maintain a strong Compound Annual Growth Rate (CAGR) of xx% during the forecast period (2025-2033), surpassing xx Million in market value by 2033. Key drivers include the increasing preference for contactless payments, the rise of Buy Now Pay Later (BNPL) services, and growing demand for financial inclusion initiatives. Technological disruptions such as the emergence of Open Banking are creating new opportunities for innovation and competition. Consumer behavior shifts are also prominent, favoring convenient, personalized, and secure financial solutions.
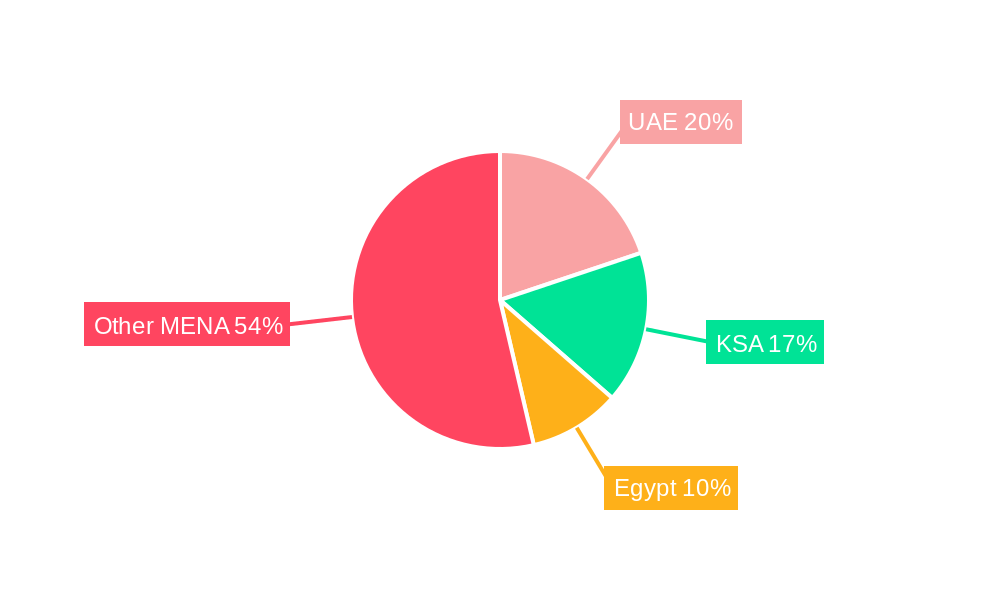
Dominant Regions, Countries, or Segments in MENA Fintech Market
The UAE and Saudi Arabia currently dominate the MENA Fintech market, driven by supportive regulatory environments, robust infrastructure, and high levels of digital adoption. Egypt is also emerging as a key player, owing to its large population and growing digital economy. The payments segment is the largest, with significant growth expected in BNPL and mobile payment solutions.
Key Drivers:
- UAE & Saudi Arabia: Government initiatives promoting digital transformation and favorable regulatory frameworks.
- Egypt: Large population base and increasing smartphone penetration.
- Payments Segment: High demand for convenient and secure payment options.
Dominance Factors:
- High levels of digital adoption: Smartphone penetration and internet usage in the UAE and Saudi Arabia are among the highest in the MENA region.
- Strong government support: Regulatory initiatives and incentives aimed at promoting fintech growth contribute significantly.
- Significant investments: Substantial investments from both domestic and international investors fuel innovation and market expansion.
MENA Fintech Market Product Landscape
The MENA Fintech market showcases a diverse range of products and services, encompassing mobile payments, digital lending platforms, investment apps, and blockchain-based solutions. These offerings are characterized by innovative features, user-friendly interfaces, and advanced security protocols. Key innovations include AI-powered financial advice tools, personalized financial management applications, and secure cross-border payment systems, each with unique selling propositions tailored to meet the diverse needs of MENA consumers.
Key Drivers, Barriers & Challenges in MENA Fintech Market
Key Drivers: The burgeoning adoption of smartphones, increasing internet and mobile penetration, government support for digital transformation, and a young, tech-savvy population are key drivers of the MENA Fintech market's growth. Furthermore, the rising demand for financial inclusion and the emergence of innovative business models contribute significantly.
Key Challenges: Regulatory uncertainty and fragmentation across different MENA countries pose significant challenges. Concerns around data security and privacy, along with the lack of comprehensive cybersecurity infrastructure, also present obstacles. Competition from established financial institutions, along with talent acquisition difficulties, further impede market expansion.
Emerging Opportunities in MENA Fintech Market
Untapped potential exists in underserved markets within the MENA region, particularly in smaller economies with limited access to traditional financial services. The growing adoption of embedded finance and the expansion of open banking present significant opportunities for Fintech companies to integrate their services within existing ecosystems. The increasing demand for personalized financial solutions and the need for tailored services for specific demographics (e.g., women, SMEs) are additional emerging opportunities.
Growth Accelerators in the MENA Fintech Market Industry
Technological breakthroughs, particularly in AI and blockchain, are key accelerators of growth. Strategic partnerships between Fintech companies and traditional financial institutions are driving innovation and market expansion. Furthermore, government initiatives promoting digital financial inclusion and the adoption of open banking regulations will continue to fuel long-term growth.
Notable Milestones in MENA Fintech Market Sector
- February 2024: PayTabs Egypt partners with Souhoola, expanding BNPL offerings.
- February 2024: PayTabs Group partners with Nearpay, enhancing soft POS payment experience.
- January 2024: Valu partners with Bosta, improving e-commerce payment processes in Egypt.
- March 2023: Pepper Money extends partnership with CoreLogic, expanding into New Zealand.
In-Depth MENA Fintech Market Market Outlook
The MENA Fintech market is poised for continued expansion, driven by technological advancements, supportive regulatory environments, and increasing consumer demand. Strategic partnerships, focused innovation, and expansion into underserved markets will shape the future landscape. The market's potential for growth remains substantial, with significant opportunities for both established players and new entrants to create value and contribute to the region's economic development.
MENA Fintech Market Segmentation
-
1. Service proposition
- 1.1. Money Transfer and Payments
- 1.2. Savings and Investments
- 1.3. Digital Lending & Lending Marketplaces
- 1.4. Online Insurance & Insurance Marketplaces
- 1.5. Other Service Propositions
MENA Fintech Market Segmentation By Geography
-
1. North America
- 1.1. United States
- 1.2. Canada
- 1.3. Mexico
-
2. South America
- 2.1. Brazil
- 2.2. Argentina
- 2.3. Rest of South America
-
3. Europe
- 3.1. United Kingdom
- 3.2. Germany
- 3.3. France
- 3.4. Italy
- 3.5. Spain
- 3.6. Russia
- 3.7. Benelux
- 3.8. Nordics
- 3.9. Rest of Europe
-
4. Middle East & Africa
- 4.1. Turkey
- 4.2. Israel
- 4.3. GCC
- 4.4. North Africa
- 4.5. South Africa
- 4.6. Rest of Middle East & Africa
-
5. Asia Pacific
- 5.1. China
- 5.2. India
- 5.3. Japan
- 5.4. South Korea
- 5.5. ASEAN
- 5.6. Oceania
- 5.7. Rest of Asia Pacific
MENA Fintech Market Regional Market Share
Geographic Coverage of MENA Fintech Market
MENA Fintech Market REPORT HIGHLIGHTS
| Aspects | Details |
|---|---|
| Study Period | 2020-2034 |
| Base Year | 2025 |
| Estimated Year | 2026 |
| Forecast Period | 2026-2034 |
| Historical Period | 2020-2025 |
| Growth Rate | CAGR of 9.71% from 2020-2034 |
| Segmentation |
|
Table of Contents
- 1. Introduction
- 1.1. Research Scope
- 1.2. Market Segmentation
- 1.3. Research Objective
- 1.4. Definitions and Assumptions
- 2. Executive Summary
- 2.1. Market Snapshot
- 3. Market Dynamics
- 3.1. Market Drivers
- 3.2. Market Restrains
- 3.3. Market Trends
- 3.4. Market Opportunities
- 4. Market Factor Analysis
- 4.1. Porters Five Forces
- 4.1.1. Bargaining Power of Suppliers
- 4.1.2. Bargaining Power of Buyers
- 4.1.3. Threat of New Entrants
- 4.1.4. Threat of Substitutes
- 4.1.5. Competitive Rivalry
- 4.2. PESTEL analysis
- 4.3. BCG Analysis
- 4.3.1. Stars (High Growth, High Market Share)
- 4.3.2. Cash Cows (Low Growth, High Market Share)
- 4.3.3. Question Mark (High Growth, Low Market Share)
- 4.3.4. Dogs (Low Growth, Low Market Share)
- 4.4. Ansoff Matrix Analysis
- 4.5. Supply Chain Analysis
- 4.6. Regulatory Landscape
- 4.7. Current Market Potential and Opportunity Assessment (TAM–SAM–SOM Framework)
- 4.8. VDR Analyst Note
- 4.1. Porters Five Forces
- 5. Market Analysis, Insights and Forecast 2021-2033
- 5.1. Market Analysis, Insights and Forecast - by Service proposition
- 5.1.1. Money Transfer and Payments
- 5.1.2. Savings and Investments
- 5.1.3. Digital Lending & Lending Marketplaces
- 5.1.4. Online Insurance & Insurance Marketplaces
- 5.1.5. Other Service Propositions
- 5.2. Market Analysis, Insights and Forecast - by Region
- 5.2.1. North America
- 5.2.2. South America
- 5.2.3. Europe
- 5.2.4. Middle East & Africa
- 5.2.5. Asia Pacific
- 5.1. Market Analysis, Insights and Forecast - by Service proposition
- 6. Global MENA Fintech Market Analysis, Insights and Forecast, 2021-2033
- 6.1. Market Analysis, Insights and Forecast - by Service proposition
- 6.1.1. Money Transfer and Payments
- 6.1.2. Savings and Investments
- 6.1.3. Digital Lending & Lending Marketplaces
- 6.1.4. Online Insurance & Insurance Marketplaces
- 6.1.5. Other Service Propositions
- 6.1. Market Analysis, Insights and Forecast - by Service proposition
- 7. North America MENA Fintech Market Analysis, Insights and Forecast, 2021-2033
- 7.1. Market Analysis, Insights and Forecast - by Service proposition
- 7.1.1. Money Transfer and Payments
- 7.1.2. Savings and Investments
- 7.1.3. Digital Lending & Lending Marketplaces
- 7.1.4. Online Insurance & Insurance Marketplaces
- 7.1.5. Other Service Propositions
- 7.1. Market Analysis, Insights and Forecast - by Service proposition
- 8. South America MENA Fintech Market Analysis, Insights and Forecast, 2021-2033
- 8.1. Market Analysis, Insights and Forecast - by Service proposition
- 8.1.1. Money Transfer and Payments
- 8.1.2. Savings and Investments
- 8.1.3. Digital Lending & Lending Marketplaces
- 8.1.4. Online Insurance & Insurance Marketplaces
- 8.1.5. Other Service Propositions
- 8.1. Market Analysis, Insights and Forecast - by Service proposition
- 9. Europe MENA Fintech Market Analysis, Insights and Forecast, 2021-2033
- 9.1. Market Analysis, Insights and Forecast - by Service proposition
- 9.1.1. Money Transfer and Payments
- 9.1.2. Savings and Investments
- 9.1.3. Digital Lending & Lending Marketplaces
- 9.1.4. Online Insurance & Insurance Marketplaces
- 9.1.5. Other Service Propositions
- 9.1. Market Analysis, Insights and Forecast - by Service proposition
- 10. Middle East & Africa MENA Fintech Market Analysis, Insights and Forecast, 2021-2033
- 10.1. Market Analysis, Insights and Forecast - by Service proposition
- 10.1.1. Money Transfer and Payments
- 10.1.2. Savings and Investments
- 10.1.3. Digital Lending & Lending Marketplaces
- 10.1.4. Online Insurance & Insurance Marketplaces
- 10.1.5. Other Service Propositions
- 10.1. Market Analysis, Insights and Forecast - by Service proposition
- 11. Asia Pacific MENA Fintech Market Analysis, Insights and Forecast, 2021-2033
- 11.1. Market Analysis, Insights and Forecast - by Service proposition
- 11.1.1. Money Transfer and Payments
- 11.1.2. Savings and Investments
- 11.1.3. Digital Lending & Lending Marketplaces
- 11.1.4. Online Insurance & Insurance Marketplaces
- 11.1.5. Other Service Propositions
- 11.1. Market Analysis, Insights and Forecast - by Service proposition
- 12. Competitive Analysis
- 12.1. Company Profiles
- 12.1.1 Tamara
- 12.1.1.1. Company Overview
- 12.1.1.2. Products
- 12.1.1.3. Company Financials
- 12.1.1.4. SWOT Analysis
- 12.1.2 Liv
- 12.1.2.1. Company Overview
- 12.1.2.2. Products
- 12.1.2.3. Company Financials
- 12.1.2.4. SWOT Analysis
- 12.1.3 Pepper
- 12.1.3.1. Company Overview
- 12.1.3.2. Products
- 12.1.3.3. Company Financials
- 12.1.3.4. SWOT Analysis
- 12.1.4 PayTabs
- 12.1.4.1. Company Overview
- 12.1.4.2. Products
- 12.1.4.3. Company Financials
- 12.1.4.4. SWOT Analysis
- 12.1.5 Tabby
- 12.1.5.1. Company Overview
- 12.1.5.2. Products
- 12.1.5.3. Company Financials
- 12.1.5.4. SWOT Analysis
- 12.1.6 Sarwa
- 12.1.6.1. Company Overview
- 12.1.6.2. Products
- 12.1.6.3. Company Financials
- 12.1.6.4. SWOT Analysis
- 12.1.7 Ila Bank
- 12.1.7.1. Company Overview
- 12.1.7.2. Products
- 12.1.7.3. Company Financials
- 12.1.7.4. SWOT Analysis
- 12.1.8 Bayzat
- 12.1.8.1. Company Overview
- 12.1.8.2. Products
- 12.1.8.3. Company Financials
- 12.1.8.4. SWOT Analysis
- 12.1.9 Eureeca
- 12.1.9.1. Company Overview
- 12.1.9.2. Products
- 12.1.9.3. Company Financials
- 12.1.9.4. SWOT Analysis
- 12.1.10 Cwallet**List Not Exhaustive
- 12.1.10.1. Company Overview
- 12.1.10.2. Products
- 12.1.10.3. Company Financials
- 12.1.10.4. SWOT Analysis
- 12.1.1 Tamara
- 12.2. Market Entropy
- 12.2.1 Company's Key Areas Served
- 12.2.2 Recent Developments
- 12.3. Company Market Share Analysis 2025
- 12.3.1 Top 5 Companies Market Share Analysis
- 12.3.2 Top 3 Companies Market Share Analysis
- 12.4. List of Potential Customers
- 13. Research Methodology
List of Figures
- Figure 1: Global MENA Fintech Market Revenue Breakdown (Million, %) by Region 2025 & 2033
- Figure 2: Global MENA Fintech Market Volume Breakdown (Billion, %) by Region 2025 & 2033
- Figure 3: North America MENA Fintech Market Revenue (Million), by Service proposition 2025 & 2033
- Figure 4: North America MENA Fintech Market Volume (Billion), by Service proposition 2025 & 2033
- Figure 5: North America MENA Fintech Market Revenue Share (%), by Service proposition 2025 & 2033
- Figure 6: North America MENA Fintech Market Volume Share (%), by Service proposition 2025 & 2033
- Figure 7: North America MENA Fintech Market Revenue (Million), by Country 2025 & 2033
- Figure 8: North America MENA Fintech Market Volume (Billion), by Country 2025 & 2033
- Figure 9: North America MENA Fintech Market Revenue Share (%), by Country 2025 & 2033
- Figure 10: North America MENA Fintech Market Volume Share (%), by Country 2025 & 2033
- Figure 11: South America MENA Fintech Market Revenue (Million), by Service proposition 2025 & 2033
- Figure 12: South America MENA Fintech Market Volume (Billion), by Service proposition 2025 & 2033
- Figure 13: South America MENA Fintech Market Revenue Share (%), by Service proposition 2025 & 2033
- Figure 14: South America MENA Fintech Market Volume Share (%), by Service proposition 2025 & 2033
- Figure 15: South America MENA Fintech Market Revenue (Million), by Country 2025 & 2033
- Figure 16: South America MENA Fintech Market Volume (Billion), by Country 2025 & 2033
- Figure 17: South America MENA Fintech Market Revenue Share (%), by Country 2025 & 2033
- Figure 18: South America MENA Fintech Market Volume Share (%), by Country 2025 & 2033
- Figure 19: Europe MENA Fintech Market Revenue (Million), by Service proposition 2025 & 2033
- Figure 20: Europe MENA Fintech Market Volume (Billion), by Service proposition 2025 & 2033
- Figure 21: Europe MENA Fintech Market Revenue Share (%), by Service proposition 2025 & 2033
- Figure 22: Europe MENA Fintech Market Volume Share (%), by Service proposition 2025 & 2033
- Figure 23: Europe MENA Fintech Market Revenue (Million), by Country 2025 & 2033
- Figure 24: Europe MENA Fintech Market Volume (Billion), by Country 2025 & 2033
- Figure 25: Europe MENA Fintech Market Revenue Share (%), by Country 2025 & 2033
- Figure 26: Europe MENA Fintech Market Volume Share (%), by Country 2025 & 2033
- Figure 27: Middle East & Africa MENA Fintech Market Revenue (Million), by Service proposition 2025 & 2033
- Figure 28: Middle East & Africa MENA Fintech Market Volume (Billion), by Service proposition 2025 & 2033
- Figure 29: Middle East & Africa MENA Fintech Market Revenue Share (%), by Service proposition 2025 & 2033
- Figure 30: Middle East & Africa MENA Fintech Market Volume Share (%), by Service proposition 2025 & 2033
- Figure 31: Middle East & Africa MENA Fintech Market Revenue (Million), by Country 2025 & 2033
- Figure 32: Middle East & Africa MENA Fintech Market Volume (Billion), by Country 2025 & 2033
- Figure 33: Middle East & Africa MENA Fintech Market Revenue Share (%), by Country 2025 & 2033
- Figure 34: Middle East & Africa MENA Fintech Market Volume Share (%), by Country 2025 & 2033
- Figure 35: Asia Pacific MENA Fintech Market Revenue (Million), by Service proposition 2025 & 2033
- Figure 36: Asia Pacific MENA Fintech Market Volume (Billion), by Service proposition 2025 & 2033
- Figure 37: Asia Pacific MENA Fintech Market Revenue Share (%), by Service proposition 2025 & 2033
- Figure 38: Asia Pacific MENA Fintech Market Volume Share (%), by Service proposition 2025 & 2033
- Figure 39: Asia Pacific MENA Fintech Market Revenue (Million), by Country 2025 & 2033
- Figure 40: Asia Pacific MENA Fintech Market Volume (Billion), by Country 2025 & 2033
- Figure 41: Asia Pacific MENA Fintech Market Revenue Share (%), by Country 2025 & 2033
- Figure 42: Asia Pacific MENA Fintech Market Volume Share (%), by Country 2025 & 2033
List of Tables
- Table 1: Global MENA Fintech Market Revenue Million Forecast, by Service proposition 2020 & 2033
- Table 2: Global MENA Fintech Market Volume Billion Forecast, by Service proposition 2020 & 2033
- Table 3: Global MENA Fintech Market Revenue Million Forecast, by Region 2020 & 2033
- Table 4: Global MENA Fintech Market Volume Billion Forecast, by Region 2020 & 2033
- Table 5: Global MENA Fintech Market Revenue Million Forecast, by Service proposition 2020 & 2033
- Table 6: Global MENA Fintech Market Volume Billion Forecast, by Service proposition 2020 & 2033
- Table 7: Global MENA Fintech Market Revenue Million Forecast, by Country 2020 & 2033
- Table 8: Global MENA Fintech Market Volume Billion Forecast, by Country 2020 & 2033
- Table 9: United States MENA Fintech Market Revenue (Million) Forecast, by Application 2020 & 2033
- Table 10: United States MENA Fintech Market Volume (Billion) Forecast, by Application 2020 & 2033
- Table 11: Canada MENA Fintech Market Revenue (Million) Forecast, by Application 2020 & 2033
- Table 12: Canada MENA Fintech Market Volume (Billion) Forecast, by Application 2020 & 2033
- Table 13: Mexico MENA Fintech Market Revenue (Million) Forecast, by Application 2020 & 2033
- Table 14: Mexico MENA Fintech Market Volume (Billion) Forecast, by Application 2020 & 2033
- Table 15: Global MENA Fintech Market Revenue Million Forecast, by Service proposition 2020 & 2033
- Table 16: Global MENA Fintech Market Volume Billion Forecast, by Service proposition 2020 & 2033
- Table 17: Global MENA Fintech Market Revenue Million Forecast, by Country 2020 & 2033
- Table 18: Global MENA Fintech Market Volume Billion Forecast, by Country 2020 & 2033
- Table 19: Brazil MENA Fintech Market Revenue (Million) Forecast, by Application 2020 & 2033
- Table 20: Brazil MENA Fintech Market Volume (Billion) Forecast, by Application 2020 & 2033
- Table 21: Argentina MENA Fintech Market Revenue (Million) Forecast, by Application 2020 & 2033
- Table 22: Argentina MENA Fintech Market Volume (Billion) Forecast, by Application 2020 & 2033
- Table 23: Rest of South America MENA Fintech Market Revenue (Million) Forecast, by Application 2020 & 2033
- Table 24: Rest of South America MENA Fintech Market Volume (Billion) Forecast, by Application 2020 & 2033
- Table 25: Global MENA Fintech Market Revenue Million Forecast, by Service proposition 2020 & 2033
- Table 26: Global MENA Fintech Market Volume Billion Forecast, by Service proposition 2020 & 2033
- Table 27: Global MENA Fintech Market Revenue Million Forecast, by Country 2020 & 2033
- Table 28: Global MENA Fintech Market Volume Billion Forecast, by Country 2020 & 2033
- Table 29: United Kingdom MENA Fintech Market Revenue (Million) Forecast, by Application 2020 & 2033
- Table 30: United Kingdom MENA Fintech Market Volume (Billion) Forecast, by Application 2020 & 2033
- Table 31: Germany MENA Fintech Market Revenue (Million) Forecast, by Application 2020 & 2033
- Table 32: Germany MENA Fintech Market Volume (Billion) Forecast, by Application 2020 & 2033
- Table 33: France MENA Fintech Market Revenue (Million) Forecast, by Application 2020 & 2033
- Table 34: France MENA Fintech Market Volume (Billion) Forecast, by Application 2020 & 2033
- Table 35: Italy MENA Fintech Market Revenue (Million) Forecast, by Application 2020 & 2033
- Table 36: Italy MENA Fintech Market Volume (Billion) Forecast, by Application 2020 & 2033
- Table 37: Spain MENA Fintech Market Revenue (Million) Forecast, by Application 2020 & 2033
- Table 38: Spain MENA Fintech Market Volume (Billion) Forecast, by Application 2020 & 2033
- Table 39: Russia MENA Fintech Market Revenue (Million) Forecast, by Application 2020 & 2033
- Table 40: Russia MENA Fintech Market Volume (Billion) Forecast, by Application 2020 & 2033
- Table 41: Benelux MENA Fintech Market Revenue (Million) Forecast, by Application 2020 & 2033
- Table 42: Benelux MENA Fintech Market Volume (Billion) Forecast, by Application 2020 & 2033
- Table 43: Nordics MENA Fintech Market Revenue (Million) Forecast, by Application 2020 & 2033
- Table 44: Nordics MENA Fintech Market Volume (Billion) Forecast, by Application 2020 & 2033
- Table 45: Rest of Europe MENA Fintech Market Revenue (Million) Forecast, by Application 2020 & 2033
- Table 46: Rest of Europe MENA Fintech Market Volume (Billion) Forecast, by Application 2020 & 2033
- Table 47: Global MENA Fintech Market Revenue Million Forecast, by Service proposition 2020 & 2033
- Table 48: Global MENA Fintech Market Volume Billion Forecast, by Service proposition 2020 & 2033
- Table 49: Global MENA Fintech Market Revenue Million Forecast, by Country 2020 & 2033
- Table 50: Global MENA Fintech Market Volume Billion Forecast, by Country 2020 & 2033
- Table 51: Turkey MENA Fintech Market Revenue (Million) Forecast, by Application 2020 & 2033
- Table 52: Turkey MENA Fintech Market Volume (Billion) Forecast, by Application 2020 & 2033
- Table 53: Israel MENA Fintech Market Revenue (Million) Forecast, by Application 2020 & 2033
- Table 54: Israel MENA Fintech Market Volume (Billion) Forecast, by Application 2020 & 2033
- Table 55: GCC MENA Fintech Market Revenue (Million) Forecast, by Application 2020 & 2033
- Table 56: GCC MENA Fintech Market Volume (Billion) Forecast, by Application 2020 & 2033
- Table 57: North Africa MENA Fintech Market Revenue (Million) Forecast, by Application 2020 & 2033
- Table 58: North Africa MENA Fintech Market Volume (Billion) Forecast, by Application 2020 & 2033
- Table 59: South Africa MENA Fintech Market Revenue (Million) Forecast, by Application 2020 & 2033
- Table 60: South Africa MENA Fintech Market Volume (Billion) Forecast, by Application 2020 & 2033
- Table 61: Rest of Middle East & Africa MENA Fintech Market Revenue (Million) Forecast, by Application 2020 & 2033
- Table 62: Rest of Middle East & Africa MENA Fintech Market Volume (Billion) Forecast, by Application 2020 & 2033
- Table 63: Global MENA Fintech Market Revenue Million Forecast, by Service proposition 2020 & 2033
- Table 64: Global MENA Fintech Market Volume Billion Forecast, by Service proposition 2020 & 2033
- Table 65: Global MENA Fintech Market Revenue Million Forecast, by Country 2020 & 2033
- Table 66: Global MENA Fintech Market Volume Billion Forecast, by Country 2020 & 2033
- Table 67: China MENA Fintech Market Revenue (Million) Forecast, by Application 2020 & 2033
- Table 68: China MENA Fintech Market Volume (Billion) Forecast, by Application 2020 & 2033
- Table 69: India MENA Fintech Market Revenue (Million) Forecast, by Application 2020 & 2033
- Table 70: India MENA Fintech Market Volume (Billion) Forecast, by Application 2020 & 2033
- Table 71: Japan MENA Fintech Market Revenue (Million) Forecast, by Application 2020 & 2033
- Table 72: Japan MENA Fintech Market Volume (Billion) Forecast, by Application 2020 & 2033
- Table 73: South Korea MENA Fintech Market Revenue (Million) Forecast, by Application 2020 & 2033
- Table 74: South Korea MENA Fintech Market Volume (Billion) Forecast, by Application 2020 & 2033
- Table 75: ASEAN MENA Fintech Market Revenue (Million) Forecast, by Application 2020 & 2033
- Table 76: ASEAN MENA Fintech Market Volume (Billion) Forecast, by Application 2020 & 2033
- Table 77: Oceania MENA Fintech Market Revenue (Million) Forecast, by Application 2020 & 2033
- Table 78: Oceania MENA Fintech Market Volume (Billion) Forecast, by Application 2020 & 2033
- Table 79: Rest of Asia Pacific MENA Fintech Market Revenue (Million) Forecast, by Application 2020 & 2033
- Table 80: Rest of Asia Pacific MENA Fintech Market Volume (Billion) Forecast, by Application 2020 & 2033
Frequently Asked Questions
1. What is the projected Compound Annual Growth Rate (CAGR) of the MENA Fintech Market?
The projected CAGR is approximately 9.71%.
2. Which companies are prominent players in the MENA Fintech Market?
Key companies in the market include Tamara, Liv, Pepper, PayTabs, Tabby, Sarwa, Ila Bank, Bayzat, Eureeca, Cwallet**List Not Exhaustive.
3. What are the main segments of the MENA Fintech Market?
The market segments include Service proposition.
4. Can you provide details about the market size?
The market size is estimated to be USD 1.51 Million as of 2022.
5. What are some drivers contributing to market growth?
Customers' Growing Need for E-Commerce and Mobile Banking Platforms; Rising Internet Penetration & Adoption of Smartphones will Continue to Lead the Growth of the Market.
6. What are the notable trends driving market growth?
Rising Digital & Cashless Payments is Driving the Growth of The Market.
7. Are there any restraints impacting market growth?
Customers' Growing Need for E-Commerce and Mobile Banking Platforms; Rising Internet Penetration & Adoption of Smartphones will Continue to Lead the Growth of the Market.
8. Can you provide examples of recent developments in the market?
In February 2024, MeasA’s (MEASA) award-winning payments leader, PayTabs, Egypt, announced a strategic partnership with Egypt’s leading BNPL platform, Souhoola. This new BNPL platform will provide merchants with a new way to pay, expanding the variety of online payment options PayTabs Egypt offers.
9. What pricing options are available for accessing the report?
Pricing options include single-user, multi-user, and enterprise licenses priced at USD 3800, USD 4500, and USD 5800 respectively.
10. Is the market size provided in terms of value or volume?
The market size is provided in terms of value, measured in Million and volume, measured in Billion.
11. Are there any specific market keywords associated with the report?
Yes, the market keyword associated with the report is "MENA Fintech Market," which aids in identifying and referencing the specific market segment covered.
12. How do I determine which pricing option suits my needs best?
The pricing options vary based on user requirements and access needs. Individual users may opt for single-user licenses, while businesses requiring broader access may choose multi-user or enterprise licenses for cost-effective access to the report.
13. Are there any additional resources or data provided in the MENA Fintech Market report?
While the report offers comprehensive insights, it's advisable to review the specific contents or supplementary materials provided to ascertain if additional resources or data are available.
14. How can I stay updated on further developments or reports in the MENA Fintech Market?
To stay informed about further developments, trends, and reports in the MENA Fintech Market, consider subscribing to industry newsletters, following relevant companies and organizations, or regularly checking reputable industry news sources and publications.
Methodology
Step 1 - Identification of Relevant Samples Size from Population Database


Step 2 - Approaches for Defining Global Market Size (Value, Volume* & Price*)

Note*: In applicable scenarios
Step 3 - Data Sources
Primary Research
- Web Analytics
- Survey Reports
- Research Institute
- Latest Research Reports
- Opinion Leaders
Secondary Research
- Annual Reports
- White Paper
- Latest Press Release
- Industry Association
- Paid Database
- Investor Presentations

Step 4 - Data Triangulation
Involves using different sources of information in order to increase the validity of a study
These sources are likely to be stakeholders in a program - participants, other researchers, program staff, other community members, and so on.
Then we put all data in single framework & apply various statistical tools to find out the dynamic on the market.
During the analysis stage, feedback from the stakeholder groups would be compared to determine areas of agreement as well as areas of divergence