

Key Insights
The global Medical Anesthesia Equipment market is poised for significant expansion, projected to reach $24.4 billion in 2025. This growth is driven by an estimated Compound Annual Growth Rate (CAGR) of 4.13%, indicating a steady and robust upward trajectory for the foreseeable future. Key factors propelling this market include the increasing prevalence of chronic diseases necessitating surgical interventions, a growing elderly population with higher surgical demands, and advancements in anesthesia delivery systems offering enhanced patient safety and efficacy. The rising adoption of minimally invasive surgical procedures, which often require precise anesthesia management, further fuels demand. Furthermore, technological innovations leading to the development of sophisticated, user-friendly anesthesia machines with integrated monitoring capabilities are contributing to market expansion. Investments in healthcare infrastructure, particularly in emerging economies, are also playing a crucial role in widening the market's reach and accessibility.
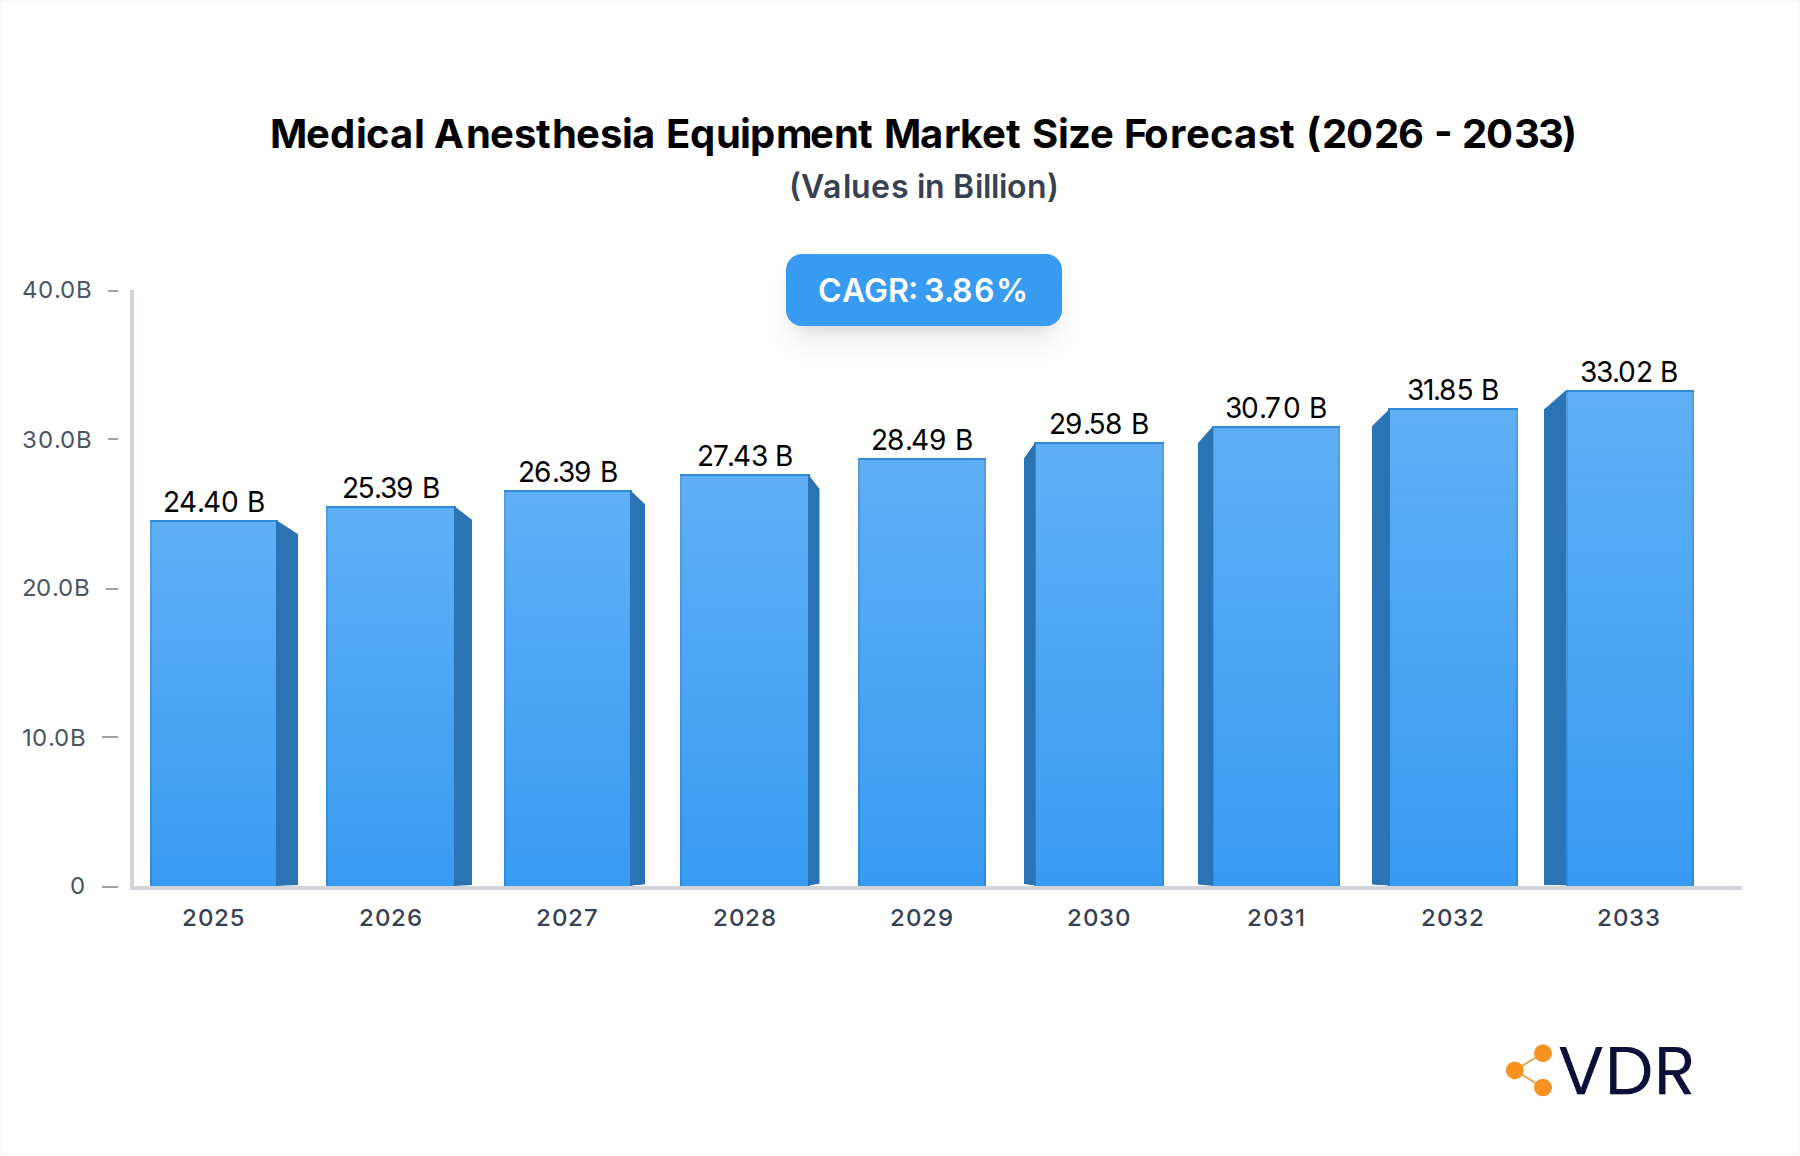
Medical Anesthesia Equipment Market Size (In Billion)
The market is segmented into fully automatic and semi-automatic anesthesia equipment, with a discernible trend towards the adoption of fully automatic systems due to their superior precision, reduced risk of human error, and advanced features. Major end-users include hospitals, clinics, and ambulatory surgical centers, with hospitals representing the largest segment owing to the complexity and volume of surgical procedures performed. The competitive landscape is characterized by the presence of established global players such as Philips, Medtronic, and GE Healthcare, who are actively involved in research and development to introduce innovative products. Strategic collaborations, mergers, and acquisitions are also common strategies employed by these companies to strengthen their market position and expand their product portfolios. While the market exhibits strong growth, potential restraints include the high cost of advanced anesthesia equipment and stringent regulatory approvals, which can impact market entry for new players.

Medical Anesthesia Equipment Company Market Share
Medical Anesthesia Equipment Market Dynamics & Structure
The global medical anesthesia equipment market is characterized by a moderate to high concentration, with key players like Philips, Medtronic, and GE Healthcare dominating significant market shares. Technological innovation remains a primary driver, propelled by advancements in patient monitoring, drug delivery precision, and closed-loop anesthesia systems designed to enhance patient safety and optimize drug utilization. Regulatory frameworks, such as those governed by the FDA and EMA, play a crucial role in dictating product approval processes, quality standards, and market entry, acting as both a facilitator and a potential barrier to innovation. Competitive product substitutes, while limited in the core anesthesia delivery systems, exist in adjacent areas like patient warming and ventilation, influencing integrated solution offerings. End-user demographics, notably the aging global population and the increasing prevalence of chronic diseases requiring surgical intervention, directly fuel demand. Merger and acquisition (M&A) trends are evident, as larger entities seek to expand their product portfolios, geographical reach, and technological capabilities, consolidating market power. For instance, acquisitions of smaller specialized anesthesia device manufacturers by major medical technology corporations have been observed, aiming to integrate novel technologies into comprehensive solutions.
- Market Concentration: Dominated by a few key global players, with a moderate level of competition from specialized regional manufacturers.
- Technological Innovation Drivers: Focus on AI-driven anesthesia management, advanced ventilation modes, integrated drug delivery systems, and enhanced patient safety features.
- Regulatory Frameworks: Stringent approval processes by bodies like the FDA and EMA, impacting time-to-market and R&D investments.
- Competitive Product Substitutes: Emerging smart monitoring devices and advanced ventilation technologies indirectly influence anesthesia delivery system design.
- End-User Demographics: Rising number of elective surgeries, increasing geriatric population, and a growing demand for minimally invasive procedures drive market growth.
- M&A Trends: Strategic acquisitions aimed at portfolio expansion and technological integration.
Medical Anesthesia Equipment Growth Trends & Insights
The global Medical Anesthesia Equipment market is poised for robust growth, driven by an escalating demand for advanced surgical procedures and a heightened focus on patient safety within healthcare settings. The market size is projected to expand significantly, with an estimated Compound Annual Growth Rate (CAGR) of approximately 6.5% from 2025 to 2033. This growth is underpinned by increasing healthcare expenditure globally, particularly in emerging economies, where investments in modern medical infrastructure are on the rise. Technological disruptions are playing a pivotal role, with the integration of artificial intelligence (AI) and machine learning (ML) into anesthesia machines promising more precise drug administration, real-time patient monitoring, and predictive analytics for adverse event prevention. The adoption rate of advanced anesthesia systems, including those with enhanced ventilation capabilities and integrated monitoring, is accelerating as healthcare providers recognize their potential to improve patient outcomes and reduce overall treatment costs.
Consumer behavior shifts are also influencing the market. There is a growing preference for minimally invasive surgeries, which often require sophisticated anesthesia management. Furthermore, the increasing awareness among patients and healthcare professionals about the benefits of sophisticated anesthesia delivery systems, such as reduced recovery times and minimized side effects, is boosting demand. The market penetration of fully automatic anesthesia equipment is expected to rise steadily, reflecting a trend towards automation and reduced reliance on manual adjustments, thereby enhancing operational efficiency in operating rooms. Global health initiatives aimed at improving access to quality healthcare also contribute to the expansion, driving demand for reliable and technologically advanced anesthesia equipment across diverse healthcare settings. The forecast indicates a sustained upward trajectory for the medical anesthesia equipment market, reflecting its essential role in modern surgical care.
- Market Size Evolution: The global market is anticipated to grow from an estimated $XX billion in 2025 to over $XX billion by 2033, demonstrating strong expansion.
- Adoption Rates: Increasing adoption of advanced anesthesia workstations and integrated monitoring systems in hospitals and ambulatory surgical centers.
- Technological Disruptions: Integration of AI/ML for enhanced patient monitoring, predictive analytics, and automated drug delivery.
- Consumer Behavior Shifts: Growing preference for minimally invasive procedures and a demand for anesthesia systems that minimize side effects and optimize recovery.
- Market Penetration: Steady increase in the penetration of fully automatic anesthesia equipment, reflecting a drive towards automation and efficiency.
- CAGR: Projected to be around 6.5% between 2025 and 2033.
Dominant Regions, Countries, or Segments in Medical Anesthesia Equipment
North America currently stands as the dominant region in the global medical anesthesia equipment market, driven by a confluence of factors that foster innovation, adoption, and sustained demand. The region boasts a highly developed healthcare infrastructure, significant healthcare spending, and a strong emphasis on adopting cutting-edge medical technologies. The presence of leading healthcare institutions, extensive research and development activities, and a high volume of surgical procedures, including elective and complex surgeries, contribute significantly to this dominance. Furthermore, a favorable regulatory environment that encourages technological advancement, coupled with robust reimbursement policies, facilitates the widespread adoption of sophisticated anesthesia equipment.
Within North America, the United States spearheads market growth due to its advanced healthcare system, a large aging population requiring more medical interventions, and a substantial number of well-equipped hospitals and ambulatory surgical centers. The focus on patient safety and adherence to stringent quality standards further propel the demand for high-performance anesthesia systems. Economically, the region's strong financial standing allows for continuous investment in upgrading medical equipment, ensuring that state-of-the-art anesthesia technology is readily available. The high number of trained anesthesiologists and anesthetists also contributes to the efficient utilization of advanced equipment.
Considering the application segments, Hospitals represent the largest and most rapidly growing segment within the medical anesthesia equipment market. This dominance is attributed to the sheer volume and complexity of surgical procedures performed in hospital settings, ranging from routine operations to life-saving interventions. Hospitals are equipped to handle a diverse patient demographic and are more likely to invest in comprehensive anesthesia solutions that integrate monitoring, delivery, and ventilation capabilities. The increasing incidence of chronic diseases, leading to a greater need for surgical interventions, further amplifies the demand for anesthesia equipment in this segment. The infrastructure and resources available in hospitals allow for the seamless integration of advanced anesthesia workstations, ensuring optimal patient care and operational efficiency.
- Dominant Region: North America, with the United States leading market growth.
- Key Drivers in North America:
- Advanced healthcare infrastructure and high healthcare expenditure.
- Early adoption of new medical technologies.
- Large aging population and high prevalence of chronic diseases.
- Significant volume of surgical procedures.
- Favorable regulatory environment and reimbursement policies.
- Dominant Application Segment: Hospitals, owing to the volume and complexity of surgical procedures.
- Key Drivers for Hospitals:
- Highest volume of surgical procedures performed.
- Need for comprehensive anesthesia solutions.
- Investment capacity for advanced equipment.
- Increasing demand due to chronic diseases.
- Ability to handle diverse patient demographics.
Medical Anesthesia Equipment Product Landscape
The medical anesthesia equipment product landscape is characterized by continuous innovation focused on enhancing patient safety, improving clinical workflow, and optimizing drug delivery. Modern anesthesia machines are increasingly sophisticated, featuring integrated patient monitors, advanced ventilation modes, and electronic drug management systems. Fully automatic anesthesia equipment, a key area of development, incorporates AI-driven features that automatically adjust ventilation and anesthetic gas delivery based on real-time patient physiological data, minimizing manual intervention and reducing the risk of human error. These advanced systems offer enhanced precision in volatile anesthetic and gas delivery, ensuring optimal depth of anesthesia and faster emergence from anesthesia, thereby improving patient recovery outcomes. The product portfolio includes both standalone anesthesia workstations and integrated anesthesia delivery systems designed for specific surgical specialties.
- Product Innovations: Focus on AI-driven automation, advanced ventilation capabilities, integrated drug delivery, and enhanced patient safety features.
- Applications: Used in a wide range of surgical procedures, from routine to complex, across various medical specialties.
- Performance Metrics: Emphasis on precision in gas and anesthetic delivery, improved patient monitoring accuracy, reduced gas consumption, and faster patient recovery times.
- Unique Selling Propositions: Enhanced patient safety, improved workflow efficiency for anesthesiologists, and optimized resource utilization.
- Technological Advancements: Integration of smart sensors, connectivity for data logging, and user-friendly interfaces for seamless operation.
Key Drivers, Barriers & Challenges in Medical Anesthesia Equipment
The medical anesthesia equipment market is propelled by several key drivers, including the increasing global demand for surgical procedures driven by an aging population and the rising prevalence of chronic diseases. Technological advancements in anesthesia delivery systems, such as enhanced patient monitoring, AI-driven precision, and improved ventilation capabilities, are crucial for improving patient outcomes and operational efficiency. Furthermore, growing healthcare expenditure in both developed and developing economies is fueling investment in modern medical equipment, including sophisticated anesthesia machines. Strategic initiatives by market players, including product innovation and market expansion, also contribute significantly to market growth.
- Key Drivers:
- Rising incidence of surgeries due to aging populations and chronic diseases.
- Technological advancements enhancing patient safety and efficacy.
- Increased healthcare spending globally.
- Growing demand for minimally invasive procedures.
- Focus on improving anesthesia delivery and patient recovery.
Key challenges and restraints facing the medical anesthesia equipment market include stringent regulatory approvals that can prolong time-to-market and increase development costs. The high initial cost of advanced anesthesia equipment can also be a barrier for smaller healthcare facilities or those in resource-limited settings. Supply chain disruptions, as observed in recent global events, can impact the availability of critical components and finished products. Moreover, intense competition among established players and emerging manufacturers can lead to pricing pressures. The need for continuous training and skilled personnel to operate and maintain complex anesthesia systems also presents a practical challenge.
- Key Challenges & Restraints:
- Strict regulatory approval processes.
- High initial investment cost of advanced equipment.
- Potential for supply chain disruptions.
- Intense market competition and pricing pressures.
- Requirement for skilled personnel and ongoing training.
Emerging Opportunities in Medical Anesthesia Equipment
Emerging opportunities in the medical anesthesia equipment market lie in the growing demand for portable and compact anesthesia devices for use in remote or resource-limited settings, facilitating wider access to surgical care. The integration of advanced data analytics and AI for predictive patient monitoring and personalized anesthesia regimens presents a significant avenue for innovation, promising improved patient outcomes and reduced adverse events. Furthermore, the development of more sustainable and energy-efficient anesthesia machines aligns with global environmental initiatives and could appeal to cost-conscious healthcare providers. The expansion of telemedicine and remote patient monitoring capabilities within anesthesia services also offers a new frontier for market players.
- Untapped Markets: Expansion into emerging economies with growing healthcare needs.
- Innovative Applications: Development of AI-driven anesthesia management systems and predictive analytics for patient safety.
- Evolving Consumer Preferences: Demand for portable, sustainable, and user-friendly anesthesia equipment.
Growth Accelerators in the Medical Anesthesia Equipment Industry
Several catalysts are accelerating the growth of the medical anesthesia equipment industry. Technological breakthroughs, particularly in areas like sensor technology, miniaturization, and software development, are enabling the creation of more intelligent and efficient anesthesia systems. Strategic partnerships between medical device manufacturers, research institutions, and pharmaceutical companies are fostering innovation and accelerating the development of integrated solutions. Market expansion strategies, including entry into underdeveloped regions and the development of tailored product offerings for specific healthcare needs, are also significant growth drivers. The increasing focus on patient safety protocols and the desire to reduce hospital-acquired complications further push the adoption of advanced anesthesia equipment.
- Technological Breakthroughs: Advancements in AI, IoT, and advanced sensor technologies.
- Strategic Partnerships: Collaborations for R&D, product co-development, and market penetration.
- Market Expansion Strategies: Geographic expansion and product diversification to meet varied healthcare demands.
Key Players Shaping the Medical Anesthesia Equipment Market
- Philips
- Medtronic
- Smiths Medical
- Johnson & Johnson
- Siemens
- GE Healthcare
- Cardinal Health
- Draeger
- Getinge Group
- Heine optotechnik
- Infinium Medical
- Mindray
Notable Milestones in Medical Anesthesia Equipment Sector
- 2019: Launch of advanced anesthesia workstations with enhanced patient monitoring and ventilation capabilities by major manufacturers.
- 2020: Increased focus on integrated anesthesia delivery systems and closed-loop anesthesia technology development amid rising surgical volumes.
- 2021: Market witnessed strategic partnerships and acquisitions aimed at expanding product portfolios and technological integration.
- 2022: Introduction of AI-powered predictive analytics features for anesthesia management.
- 2023: Growing emphasis on connected anesthesia devices and data management solutions for improved clinical insights.
- 2024: Development of more compact and portable anesthesia machines for diverse clinical settings.
In-Depth Medical Anesthesia Equipment Market Outlook
The future outlook for the medical anesthesia equipment market is exceptionally promising, driven by ongoing advancements in healthcare technology and a persistent need for safe and effective anesthetic care. Growth accelerators such as the integration of artificial intelligence for personalized treatment plans, the expansion of smart connected devices, and the increasing demand for minimally invasive surgical techniques will continue to shape the market. Strategic collaborations, coupled with a growing global healthcare expenditure, will facilitate market penetration into underserved regions. The industry is poised for sustained expansion as it continues to innovate, focusing on enhancing patient outcomes, improving clinical efficiency, and addressing the evolving needs of healthcare providers worldwide.
- Future Market Potential: Continued strong growth driven by technological innovation and increasing surgical procedure volumes.
- Strategic Opportunities: Leveraging AI for predictive patient monitoring, expanding into emerging markets, and developing integrated care solutions.
Medical Anesthesia Equipment Segmentation
-
1. Application
- 1.1. Hospitals
- 1.2. Clinics
- 1.3. Ambulatory Surgical Centers
- 1.4. Other
-
2. Types
- 2.1. Fully Automatic Anesthesia Equipment
- 2.2. Semi-Automatic Anesthesia Equipment
Medical Anesthesia Equipment Segmentation By Geography
-
1. North America
- 1.1. United States
- 1.2. Canada
- 1.3. Mexico
-
2. South America
- 2.1. Brazil
- 2.2. Argentina
- 2.3. Rest of South America
-
3. Europe
- 3.1. United Kingdom
- 3.2. Germany
- 3.3. France
- 3.4. Italy
- 3.5. Spain
- 3.6. Russia
- 3.7. Benelux
- 3.8. Nordics
- 3.9. Rest of Europe
-
4. Middle East & Africa
- 4.1. Turkey
- 4.2. Israel
- 4.3. GCC
- 4.4. North Africa
- 4.5. South Africa
- 4.6. Rest of Middle East & Africa
-
5. Asia Pacific
- 5.1. China
- 5.2. India
- 5.3. Japan
- 5.4. South Korea
- 5.5. ASEAN
- 5.6. Oceania
- 5.7. Rest of Asia Pacific
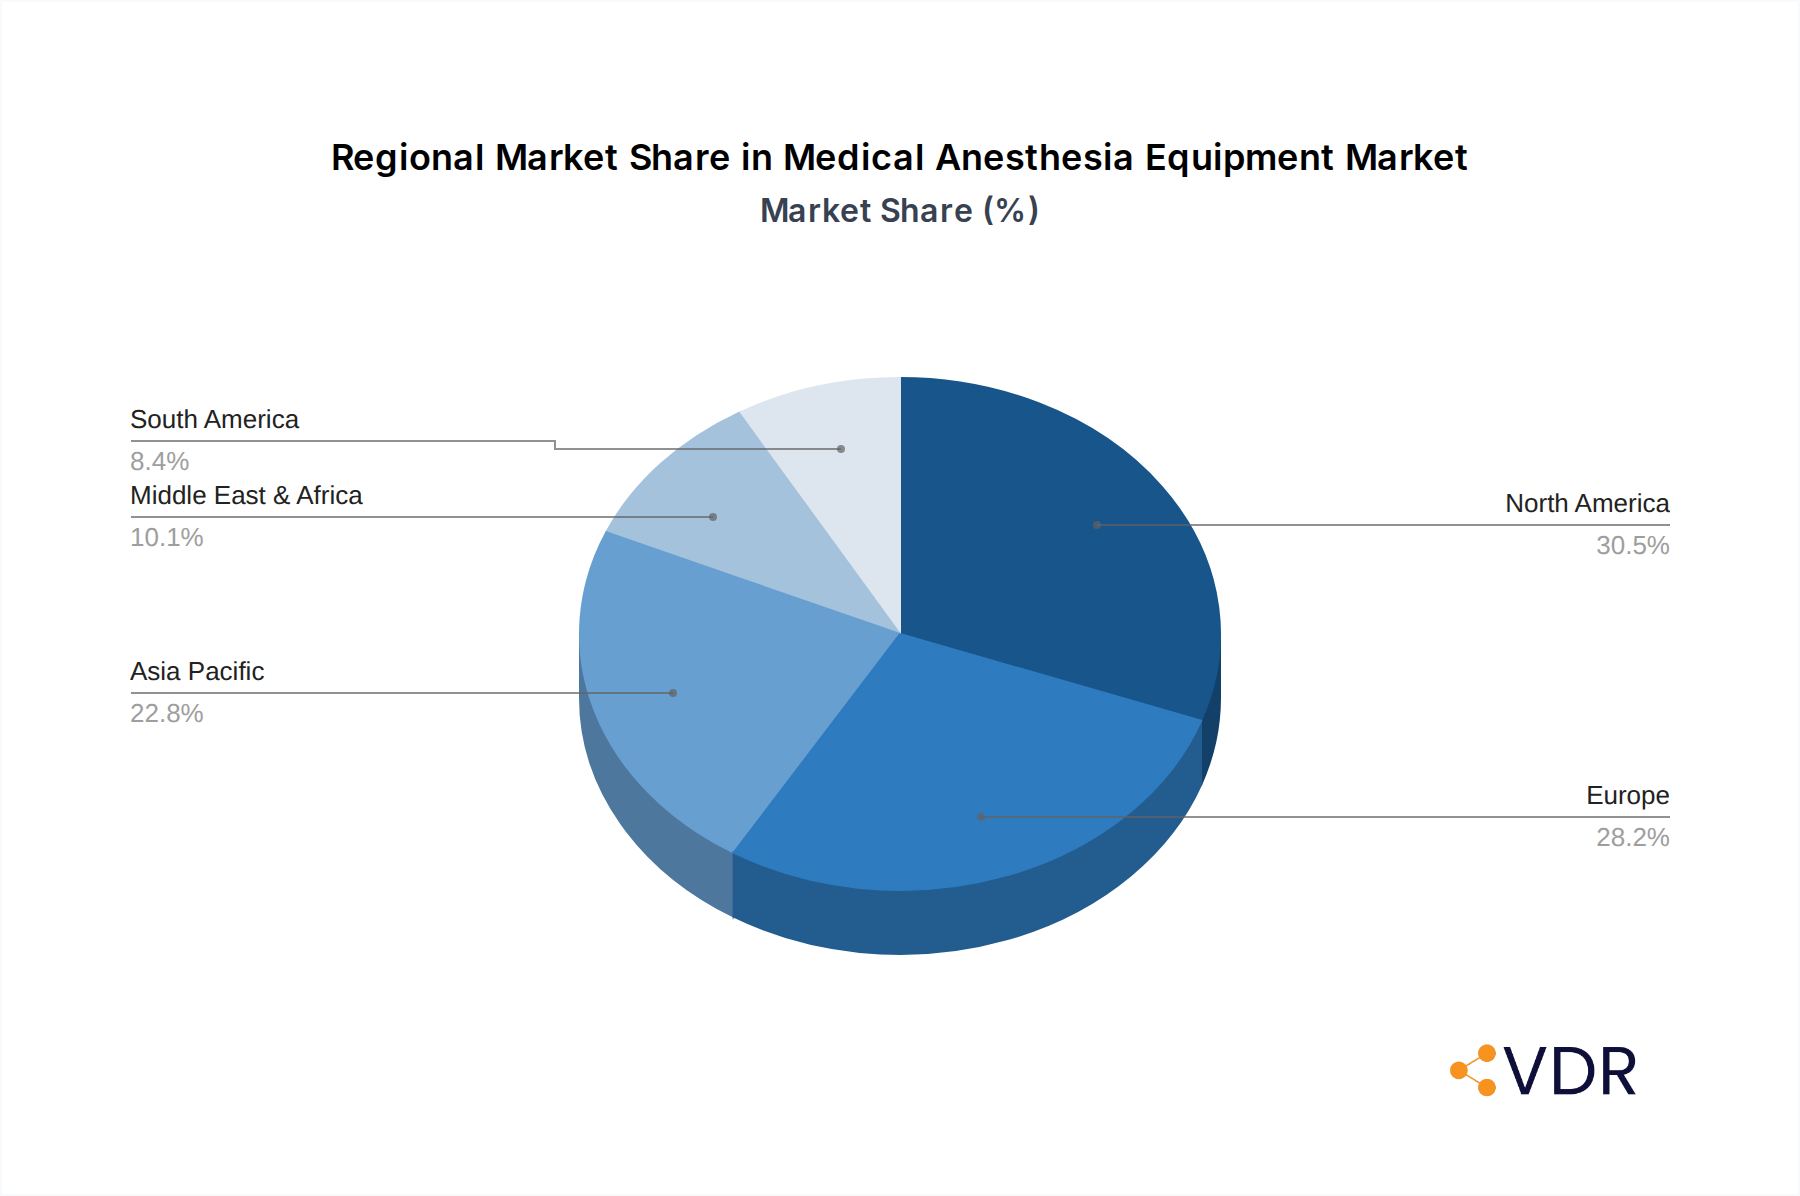
Medical Anesthesia Equipment Regional Market Share
Geographic Coverage of Medical Anesthesia Equipment
Medical Anesthesia Equipment REPORT HIGHLIGHTS
| Aspects | Details |
|---|---|
| Study Period | 2020-2034 |
| Base Year | 2025 |
| Estimated Year | 2026 |
| Forecast Period | 2026-2034 |
| Historical Period | 2020-2025 |
| Growth Rate | CAGR of 4.13% from 2020-2034 |
| Segmentation |
|
Table of Contents
- 1. Introduction
- 1.1. Research Scope
- 1.2. Market Segmentation
- 1.3. Research Methodology
- 1.4. Definitions and Assumptions
- 2. Executive Summary
- 2.1. Introduction
- 3. Market Dynamics
- 3.1. Introduction
- 3.2. Market Drivers
- 3.3. Market Restrains
- 3.4. Market Trends
- 4. Market Factor Analysis
- 4.1. Porters Five Forces
- 4.2. Supply/Value Chain
- 4.3. PESTEL analysis
- 4.4. Market Entropy
- 4.5. Patent/Trademark Analysis
- 5. Global Medical Anesthesia Equipment Analysis, Insights and Forecast, 2020-2032
- 5.1. Market Analysis, Insights and Forecast - by Application
- 5.1.1. Hospitals
- 5.1.2. Clinics
- 5.1.3. Ambulatory Surgical Centers
- 5.1.4. Other
- 5.2. Market Analysis, Insights and Forecast - by Types
- 5.2.1. Fully Automatic Anesthesia Equipment
- 5.2.2. Semi-Automatic Anesthesia Equipment
- 5.3. Market Analysis, Insights and Forecast - by Region
- 5.3.1. North America
- 5.3.2. South America
- 5.3.3. Europe
- 5.3.4. Middle East & Africa
- 5.3.5. Asia Pacific
- 5.1. Market Analysis, Insights and Forecast - by Application
- 6. North America Medical Anesthesia Equipment Analysis, Insights and Forecast, 2020-2032
- 6.1. Market Analysis, Insights and Forecast - by Application
- 6.1.1. Hospitals
- 6.1.2. Clinics
- 6.1.3. Ambulatory Surgical Centers
- 6.1.4. Other
- 6.2. Market Analysis, Insights and Forecast - by Types
- 6.2.1. Fully Automatic Anesthesia Equipment
- 6.2.2. Semi-Automatic Anesthesia Equipment
- 6.1. Market Analysis, Insights and Forecast - by Application
- 7. South America Medical Anesthesia Equipment Analysis, Insights and Forecast, 2020-2032
- 7.1. Market Analysis, Insights and Forecast - by Application
- 7.1.1. Hospitals
- 7.1.2. Clinics
- 7.1.3. Ambulatory Surgical Centers
- 7.1.4. Other
- 7.2. Market Analysis, Insights and Forecast - by Types
- 7.2.1. Fully Automatic Anesthesia Equipment
- 7.2.2. Semi-Automatic Anesthesia Equipment
- 7.1. Market Analysis, Insights and Forecast - by Application
- 8. Europe Medical Anesthesia Equipment Analysis, Insights and Forecast, 2020-2032
- 8.1. Market Analysis, Insights and Forecast - by Application
- 8.1.1. Hospitals
- 8.1.2. Clinics
- 8.1.3. Ambulatory Surgical Centers
- 8.1.4. Other
- 8.2. Market Analysis, Insights and Forecast - by Types
- 8.2.1. Fully Automatic Anesthesia Equipment
- 8.2.2. Semi-Automatic Anesthesia Equipment
- 8.1. Market Analysis, Insights and Forecast - by Application
- 9. Middle East & Africa Medical Anesthesia Equipment Analysis, Insights and Forecast, 2020-2032
- 9.1. Market Analysis, Insights and Forecast - by Application
- 9.1.1. Hospitals
- 9.1.2. Clinics
- 9.1.3. Ambulatory Surgical Centers
- 9.1.4. Other
- 9.2. Market Analysis, Insights and Forecast - by Types
- 9.2.1. Fully Automatic Anesthesia Equipment
- 9.2.2. Semi-Automatic Anesthesia Equipment
- 9.1. Market Analysis, Insights and Forecast - by Application
- 10. Asia Pacific Medical Anesthesia Equipment Analysis, Insights and Forecast, 2020-2032
- 10.1. Market Analysis, Insights and Forecast - by Application
- 10.1.1. Hospitals
- 10.1.2. Clinics
- 10.1.3. Ambulatory Surgical Centers
- 10.1.4. Other
- 10.2. Market Analysis, Insights and Forecast - by Types
- 10.2.1. Fully Automatic Anesthesia Equipment
- 10.2.2. Semi-Automatic Anesthesia Equipment
- 10.1. Market Analysis, Insights and Forecast - by Application
- 11. Competitive Analysis
- 11.1. Global Market Share Analysis 2025
- 11.2. Company Profiles
- 11.2.1 Philips
- 11.2.1.1. Overview
- 11.2.1.2. Products
- 11.2.1.3. SWOT Analysis
- 11.2.1.4. Recent Developments
- 11.2.1.5. Financials (Based on Availability)
- 11.2.2 Medtronic
- 11.2.2.1. Overview
- 11.2.2.2. Products
- 11.2.2.3. SWOT Analysis
- 11.2.2.4. Recent Developments
- 11.2.2.5. Financials (Based on Availability)
- 11.2.3 Smiths Medical
- 11.2.3.1. Overview
- 11.2.3.2. Products
- 11.2.3.3. SWOT Analysis
- 11.2.3.4. Recent Developments
- 11.2.3.5. Financials (Based on Availability)
- 11.2.4 Johnson & Johnson
- 11.2.4.1. Overview
- 11.2.4.2. Products
- 11.2.4.3. SWOT Analysis
- 11.2.4.4. Recent Developments
- 11.2.4.5. Financials (Based on Availability)
- 11.2.5 Siemens
- 11.2.5.1. Overview
- 11.2.5.2. Products
- 11.2.5.3. SWOT Analysis
- 11.2.5.4. Recent Developments
- 11.2.5.5. Financials (Based on Availability)
- 11.2.6 GE Healthcare
- 11.2.6.1. Overview
- 11.2.6.2. Products
- 11.2.6.3. SWOT Analysis
- 11.2.6.4. Recent Developments
- 11.2.6.5. Financials (Based on Availability)
- 11.2.7 Cardinal Health
- 11.2.7.1. Overview
- 11.2.7.2. Products
- 11.2.7.3. SWOT Analysis
- 11.2.7.4. Recent Developments
- 11.2.7.5. Financials (Based on Availability)
- 11.2.8 Draeger
- 11.2.8.1. Overview
- 11.2.8.2. Products
- 11.2.8.3. SWOT Analysis
- 11.2.8.4. Recent Developments
- 11.2.8.5. Financials (Based on Availability)
- 11.2.9 Getinge Group
- 11.2.9.1. Overview
- 11.2.9.2. Products
- 11.2.9.3. SWOT Analysis
- 11.2.9.4. Recent Developments
- 11.2.9.5. Financials (Based on Availability)
- 11.2.10 Heine optotechnik
- 11.2.10.1. Overview
- 11.2.10.2. Products
- 11.2.10.3. SWOT Analysis
- 11.2.10.4. Recent Developments
- 11.2.10.5. Financials (Based on Availability)
- 11.2.11 Infinium Medical
- 11.2.11.1. Overview
- 11.2.11.2. Products
- 11.2.11.3. SWOT Analysis
- 11.2.11.4. Recent Developments
- 11.2.11.5. Financials (Based on Availability)
- 11.2.12 Mindray
- 11.2.12.1. Overview
- 11.2.12.2. Products
- 11.2.12.3. SWOT Analysis
- 11.2.12.4. Recent Developments
- 11.2.12.5. Financials (Based on Availability)
- 11.2.1 Philips
List of Figures
- Figure 1: Global Medical Anesthesia Equipment Revenue Breakdown (undefined, %) by Region 2025 & 2033
- Figure 2: Global Medical Anesthesia Equipment Volume Breakdown (K, %) by Region 2025 & 2033
- Figure 3: North America Medical Anesthesia Equipment Revenue (undefined), by Application 2025 & 2033
- Figure 4: North America Medical Anesthesia Equipment Volume (K), by Application 2025 & 2033
- Figure 5: North America Medical Anesthesia Equipment Revenue Share (%), by Application 2025 & 2033
- Figure 6: North America Medical Anesthesia Equipment Volume Share (%), by Application 2025 & 2033
- Figure 7: North America Medical Anesthesia Equipment Revenue (undefined), by Types 2025 & 2033
- Figure 8: North America Medical Anesthesia Equipment Volume (K), by Types 2025 & 2033
- Figure 9: North America Medical Anesthesia Equipment Revenue Share (%), by Types 2025 & 2033
- Figure 10: North America Medical Anesthesia Equipment Volume Share (%), by Types 2025 & 2033
- Figure 11: North America Medical Anesthesia Equipment Revenue (undefined), by Country 2025 & 2033
- Figure 12: North America Medical Anesthesia Equipment Volume (K), by Country 2025 & 2033
- Figure 13: North America Medical Anesthesia Equipment Revenue Share (%), by Country 2025 & 2033
- Figure 14: North America Medical Anesthesia Equipment Volume Share (%), by Country 2025 & 2033
- Figure 15: South America Medical Anesthesia Equipment Revenue (undefined), by Application 2025 & 2033
- Figure 16: South America Medical Anesthesia Equipment Volume (K), by Application 2025 & 2033
- Figure 17: South America Medical Anesthesia Equipment Revenue Share (%), by Application 2025 & 2033
- Figure 18: South America Medical Anesthesia Equipment Volume Share (%), by Application 2025 & 2033
- Figure 19: South America Medical Anesthesia Equipment Revenue (undefined), by Types 2025 & 2033
- Figure 20: South America Medical Anesthesia Equipment Volume (K), by Types 2025 & 2033
- Figure 21: South America Medical Anesthesia Equipment Revenue Share (%), by Types 2025 & 2033
- Figure 22: South America Medical Anesthesia Equipment Volume Share (%), by Types 2025 & 2033
- Figure 23: South America Medical Anesthesia Equipment Revenue (undefined), by Country 2025 & 2033
- Figure 24: South America Medical Anesthesia Equipment Volume (K), by Country 2025 & 2033
- Figure 25: South America Medical Anesthesia Equipment Revenue Share (%), by Country 2025 & 2033
- Figure 26: South America Medical Anesthesia Equipment Volume Share (%), by Country 2025 & 2033
- Figure 27: Europe Medical Anesthesia Equipment Revenue (undefined), by Application 2025 & 2033
- Figure 28: Europe Medical Anesthesia Equipment Volume (K), by Application 2025 & 2033
- Figure 29: Europe Medical Anesthesia Equipment Revenue Share (%), by Application 2025 & 2033
- Figure 30: Europe Medical Anesthesia Equipment Volume Share (%), by Application 2025 & 2033
- Figure 31: Europe Medical Anesthesia Equipment Revenue (undefined), by Types 2025 & 2033
- Figure 32: Europe Medical Anesthesia Equipment Volume (K), by Types 2025 & 2033
- Figure 33: Europe Medical Anesthesia Equipment Revenue Share (%), by Types 2025 & 2033
- Figure 34: Europe Medical Anesthesia Equipment Volume Share (%), by Types 2025 & 2033
- Figure 35: Europe Medical Anesthesia Equipment Revenue (undefined), by Country 2025 & 2033
- Figure 36: Europe Medical Anesthesia Equipment Volume (K), by Country 2025 & 2033
- Figure 37: Europe Medical Anesthesia Equipment Revenue Share (%), by Country 2025 & 2033
- Figure 38: Europe Medical Anesthesia Equipment Volume Share (%), by Country 2025 & 2033
- Figure 39: Middle East & Africa Medical Anesthesia Equipment Revenue (undefined), by Application 2025 & 2033
- Figure 40: Middle East & Africa Medical Anesthesia Equipment Volume (K), by Application 2025 & 2033
- Figure 41: Middle East & Africa Medical Anesthesia Equipment Revenue Share (%), by Application 2025 & 2033
- Figure 42: Middle East & Africa Medical Anesthesia Equipment Volume Share (%), by Application 2025 & 2033
- Figure 43: Middle East & Africa Medical Anesthesia Equipment Revenue (undefined), by Types 2025 & 2033
- Figure 44: Middle East & Africa Medical Anesthesia Equipment Volume (K), by Types 2025 & 2033
- Figure 45: Middle East & Africa Medical Anesthesia Equipment Revenue Share (%), by Types 2025 & 2033
- Figure 46: Middle East & Africa Medical Anesthesia Equipment Volume Share (%), by Types 2025 & 2033
- Figure 47: Middle East & Africa Medical Anesthesia Equipment Revenue (undefined), by Country 2025 & 2033
- Figure 48: Middle East & Africa Medical Anesthesia Equipment Volume (K), by Country 2025 & 2033
- Figure 49: Middle East & Africa Medical Anesthesia Equipment Revenue Share (%), by Country 2025 & 2033
- Figure 50: Middle East & Africa Medical Anesthesia Equipment Volume Share (%), by Country 2025 & 2033
- Figure 51: Asia Pacific Medical Anesthesia Equipment Revenue (undefined), by Application 2025 & 2033
- Figure 52: Asia Pacific Medical Anesthesia Equipment Volume (K), by Application 2025 & 2033
- Figure 53: Asia Pacific Medical Anesthesia Equipment Revenue Share (%), by Application 2025 & 2033
- Figure 54: Asia Pacific Medical Anesthesia Equipment Volume Share (%), by Application 2025 & 2033
- Figure 55: Asia Pacific Medical Anesthesia Equipment Revenue (undefined), by Types 2025 & 2033
- Figure 56: Asia Pacific Medical Anesthesia Equipment Volume (K), by Types 2025 & 2033
- Figure 57: Asia Pacific Medical Anesthesia Equipment Revenue Share (%), by Types 2025 & 2033
- Figure 58: Asia Pacific Medical Anesthesia Equipment Volume Share (%), by Types 2025 & 2033
- Figure 59: Asia Pacific Medical Anesthesia Equipment Revenue (undefined), by Country 2025 & 2033
- Figure 60: Asia Pacific Medical Anesthesia Equipment Volume (K), by Country 2025 & 2033
- Figure 61: Asia Pacific Medical Anesthesia Equipment Revenue Share (%), by Country 2025 & 2033
- Figure 62: Asia Pacific Medical Anesthesia Equipment Volume Share (%), by Country 2025 & 2033
List of Tables
- Table 1: Global Medical Anesthesia Equipment Revenue undefined Forecast, by Application 2020 & 2033
- Table 2: Global Medical Anesthesia Equipment Volume K Forecast, by Application 2020 & 2033
- Table 3: Global Medical Anesthesia Equipment Revenue undefined Forecast, by Types 2020 & 2033
- Table 4: Global Medical Anesthesia Equipment Volume K Forecast, by Types 2020 & 2033
- Table 5: Global Medical Anesthesia Equipment Revenue undefined Forecast, by Region 2020 & 2033
- Table 6: Global Medical Anesthesia Equipment Volume K Forecast, by Region 2020 & 2033
- Table 7: Global Medical Anesthesia Equipment Revenue undefined Forecast, by Application 2020 & 2033
- Table 8: Global Medical Anesthesia Equipment Volume K Forecast, by Application 2020 & 2033
- Table 9: Global Medical Anesthesia Equipment Revenue undefined Forecast, by Types 2020 & 2033
- Table 10: Global Medical Anesthesia Equipment Volume K Forecast, by Types 2020 & 2033
- Table 11: Global Medical Anesthesia Equipment Revenue undefined Forecast, by Country 2020 & 2033
- Table 12: Global Medical Anesthesia Equipment Volume K Forecast, by Country 2020 & 2033
- Table 13: United States Medical Anesthesia Equipment Revenue (undefined) Forecast, by Application 2020 & 2033
- Table 14: United States Medical Anesthesia Equipment Volume (K) Forecast, by Application 2020 & 2033
- Table 15: Canada Medical Anesthesia Equipment Revenue (undefined) Forecast, by Application 2020 & 2033
- Table 16: Canada Medical Anesthesia Equipment Volume (K) Forecast, by Application 2020 & 2033
- Table 17: Mexico Medical Anesthesia Equipment Revenue (undefined) Forecast, by Application 2020 & 2033
- Table 18: Mexico Medical Anesthesia Equipment Volume (K) Forecast, by Application 2020 & 2033
- Table 19: Global Medical Anesthesia Equipment Revenue undefined Forecast, by Application 2020 & 2033
- Table 20: Global Medical Anesthesia Equipment Volume K Forecast, by Application 2020 & 2033
- Table 21: Global Medical Anesthesia Equipment Revenue undefined Forecast, by Types 2020 & 2033
- Table 22: Global Medical Anesthesia Equipment Volume K Forecast, by Types 2020 & 2033
- Table 23: Global Medical Anesthesia Equipment Revenue undefined Forecast, by Country 2020 & 2033
- Table 24: Global Medical Anesthesia Equipment Volume K Forecast, by Country 2020 & 2033
- Table 25: Brazil Medical Anesthesia Equipment Revenue (undefined) Forecast, by Application 2020 & 2033
- Table 26: Brazil Medical Anesthesia Equipment Volume (K) Forecast, by Application 2020 & 2033
- Table 27: Argentina Medical Anesthesia Equipment Revenue (undefined) Forecast, by Application 2020 & 2033
- Table 28: Argentina Medical Anesthesia Equipment Volume (K) Forecast, by Application 2020 & 2033
- Table 29: Rest of South America Medical Anesthesia Equipment Revenue (undefined) Forecast, by Application 2020 & 2033
- Table 30: Rest of South America Medical Anesthesia Equipment Volume (K) Forecast, by Application 2020 & 2033
- Table 31: Global Medical Anesthesia Equipment Revenue undefined Forecast, by Application 2020 & 2033
- Table 32: Global Medical Anesthesia Equipment Volume K Forecast, by Application 2020 & 2033
- Table 33: Global Medical Anesthesia Equipment Revenue undefined Forecast, by Types 2020 & 2033
- Table 34: Global Medical Anesthesia Equipment Volume K Forecast, by Types 2020 & 2033
- Table 35: Global Medical Anesthesia Equipment Revenue undefined Forecast, by Country 2020 & 2033
- Table 36: Global Medical Anesthesia Equipment Volume K Forecast, by Country 2020 & 2033
- Table 37: United Kingdom Medical Anesthesia Equipment Revenue (undefined) Forecast, by Application 2020 & 2033
- Table 38: United Kingdom Medical Anesthesia Equipment Volume (K) Forecast, by Application 2020 & 2033
- Table 39: Germany Medical Anesthesia Equipment Revenue (undefined) Forecast, by Application 2020 & 2033
- Table 40: Germany Medical Anesthesia Equipment Volume (K) Forecast, by Application 2020 & 2033
- Table 41: France Medical Anesthesia Equipment Revenue (undefined) Forecast, by Application 2020 & 2033
- Table 42: France Medical Anesthesia Equipment Volume (K) Forecast, by Application 2020 & 2033
- Table 43: Italy Medical Anesthesia Equipment Revenue (undefined) Forecast, by Application 2020 & 2033
- Table 44: Italy Medical Anesthesia Equipment Volume (K) Forecast, by Application 2020 & 2033
- Table 45: Spain Medical Anesthesia Equipment Revenue (undefined) Forecast, by Application 2020 & 2033
- Table 46: Spain Medical Anesthesia Equipment Volume (K) Forecast, by Application 2020 & 2033
- Table 47: Russia Medical Anesthesia Equipment Revenue (undefined) Forecast, by Application 2020 & 2033
- Table 48: Russia Medical Anesthesia Equipment Volume (K) Forecast, by Application 2020 & 2033
- Table 49: Benelux Medical Anesthesia Equipment Revenue (undefined) Forecast, by Application 2020 & 2033
- Table 50: Benelux Medical Anesthesia Equipment Volume (K) Forecast, by Application 2020 & 2033
- Table 51: Nordics Medical Anesthesia Equipment Revenue (undefined) Forecast, by Application 2020 & 2033
- Table 52: Nordics Medical Anesthesia Equipment Volume (K) Forecast, by Application 2020 & 2033
- Table 53: Rest of Europe Medical Anesthesia Equipment Revenue (undefined) Forecast, by Application 2020 & 2033
- Table 54: Rest of Europe Medical Anesthesia Equipment Volume (K) Forecast, by Application 2020 & 2033
- Table 55: Global Medical Anesthesia Equipment Revenue undefined Forecast, by Application 2020 & 2033
- Table 56: Global Medical Anesthesia Equipment Volume K Forecast, by Application 2020 & 2033
- Table 57: Global Medical Anesthesia Equipment Revenue undefined Forecast, by Types 2020 & 2033
- Table 58: Global Medical Anesthesia Equipment Volume K Forecast, by Types 2020 & 2033
- Table 59: Global Medical Anesthesia Equipment Revenue undefined Forecast, by Country 2020 & 2033
- Table 60: Global Medical Anesthesia Equipment Volume K Forecast, by Country 2020 & 2033
- Table 61: Turkey Medical Anesthesia Equipment Revenue (undefined) Forecast, by Application 2020 & 2033
- Table 62: Turkey Medical Anesthesia Equipment Volume (K) Forecast, by Application 2020 & 2033
- Table 63: Israel Medical Anesthesia Equipment Revenue (undefined) Forecast, by Application 2020 & 2033
- Table 64: Israel Medical Anesthesia Equipment Volume (K) Forecast, by Application 2020 & 2033
- Table 65: GCC Medical Anesthesia Equipment Revenue (undefined) Forecast, by Application 2020 & 2033
- Table 66: GCC Medical Anesthesia Equipment Volume (K) Forecast, by Application 2020 & 2033
- Table 67: North Africa Medical Anesthesia Equipment Revenue (undefined) Forecast, by Application 2020 & 2033
- Table 68: North Africa Medical Anesthesia Equipment Volume (K) Forecast, by Application 2020 & 2033
- Table 69: South Africa Medical Anesthesia Equipment Revenue (undefined) Forecast, by Application 2020 & 2033
- Table 70: South Africa Medical Anesthesia Equipment Volume (K) Forecast, by Application 2020 & 2033
- Table 71: Rest of Middle East & Africa Medical Anesthesia Equipment Revenue (undefined) Forecast, by Application 2020 & 2033
- Table 72: Rest of Middle East & Africa Medical Anesthesia Equipment Volume (K) Forecast, by Application 2020 & 2033
- Table 73: Global Medical Anesthesia Equipment Revenue undefined Forecast, by Application 2020 & 2033
- Table 74: Global Medical Anesthesia Equipment Volume K Forecast, by Application 2020 & 2033
- Table 75: Global Medical Anesthesia Equipment Revenue undefined Forecast, by Types 2020 & 2033
- Table 76: Global Medical Anesthesia Equipment Volume K Forecast, by Types 2020 & 2033
- Table 77: Global Medical Anesthesia Equipment Revenue undefined Forecast, by Country 2020 & 2033
- Table 78: Global Medical Anesthesia Equipment Volume K Forecast, by Country 2020 & 2033
- Table 79: China Medical Anesthesia Equipment Revenue (undefined) Forecast, by Application 2020 & 2033
- Table 80: China Medical Anesthesia Equipment Volume (K) Forecast, by Application 2020 & 2033
- Table 81: India Medical Anesthesia Equipment Revenue (undefined) Forecast, by Application 2020 & 2033
- Table 82: India Medical Anesthesia Equipment Volume (K) Forecast, by Application 2020 & 2033
- Table 83: Japan Medical Anesthesia Equipment Revenue (undefined) Forecast, by Application 2020 & 2033
- Table 84: Japan Medical Anesthesia Equipment Volume (K) Forecast, by Application 2020 & 2033
- Table 85: South Korea Medical Anesthesia Equipment Revenue (undefined) Forecast, by Application 2020 & 2033
- Table 86: South Korea Medical Anesthesia Equipment Volume (K) Forecast, by Application 2020 & 2033
- Table 87: ASEAN Medical Anesthesia Equipment Revenue (undefined) Forecast, by Application 2020 & 2033
- Table 88: ASEAN Medical Anesthesia Equipment Volume (K) Forecast, by Application 2020 & 2033
- Table 89: Oceania Medical Anesthesia Equipment Revenue (undefined) Forecast, by Application 2020 & 2033
- Table 90: Oceania Medical Anesthesia Equipment Volume (K) Forecast, by Application 2020 & 2033
- Table 91: Rest of Asia Pacific Medical Anesthesia Equipment Revenue (undefined) Forecast, by Application 2020 & 2033
- Table 92: Rest of Asia Pacific Medical Anesthesia Equipment Volume (K) Forecast, by Application 2020 & 2033
Frequently Asked Questions
1. What is the projected Compound Annual Growth Rate (CAGR) of the Medical Anesthesia Equipment?
The projected CAGR is approximately 4.13%.
2. Which companies are prominent players in the Medical Anesthesia Equipment?
Key companies in the market include Philips, Medtronic, Smiths Medical, Johnson & Johnson, Siemens, GE Healthcare, Cardinal Health, Draeger, Getinge Group, Heine optotechnik, Infinium Medical, Mindray.
3. What are the main segments of the Medical Anesthesia Equipment?
The market segments include Application, Types.
4. Can you provide details about the market size?
The market size is estimated to be USD XXX N/A as of 2022.
5. What are some drivers contributing to market growth?
N/A
6. What are the notable trends driving market growth?
N/A
7. Are there any restraints impacting market growth?
N/A
8. Can you provide examples of recent developments in the market?
N/A
9. What pricing options are available for accessing the report?
Pricing options include single-user, multi-user, and enterprise licenses priced at USD 3950.00, USD 5925.00, and USD 7900.00 respectively.
10. Is the market size provided in terms of value or volume?
The market size is provided in terms of value, measured in N/A and volume, measured in K.
11. Are there any specific market keywords associated with the report?
Yes, the market keyword associated with the report is "Medical Anesthesia Equipment," which aids in identifying and referencing the specific market segment covered.
12. How do I determine which pricing option suits my needs best?
The pricing options vary based on user requirements and access needs. Individual users may opt for single-user licenses, while businesses requiring broader access may choose multi-user or enterprise licenses for cost-effective access to the report.
13. Are there any additional resources or data provided in the Medical Anesthesia Equipment report?
While the report offers comprehensive insights, it's advisable to review the specific contents or supplementary materials provided to ascertain if additional resources or data are available.
14. How can I stay updated on further developments or reports in the Medical Anesthesia Equipment?
To stay informed about further developments, trends, and reports in the Medical Anesthesia Equipment, consider subscribing to industry newsletters, following relevant companies and organizations, or regularly checking reputable industry news sources and publications.
Methodology
Step 1 - Identification of Relevant Samples Size from Population Database


Step 2 - Approaches for Defining Global Market Size (Value, Volume* & Price*)

Note*: In applicable scenarios
Step 3 - Data Sources
Primary Research
- Web Analytics
- Survey Reports
- Research Institute
- Latest Research Reports
- Opinion Leaders
Secondary Research
- Annual Reports
- White Paper
- Latest Press Release
- Industry Association
- Paid Database
- Investor Presentations

Step 4 - Data Triangulation
Involves using different sources of information in order to increase the validity of a study
These sources are likely to be stakeholders in a program - participants, other researchers, program staff, other community members, and so on.
Then we put all data in single framework & apply various statistical tools to find out the dynamic on the market.
During the analysis stage, feedback from the stakeholder groups would be compared to determine areas of agreement as well as areas of divergence