

Key Insights
The Middle East and Africa (MEA) leather goods market, encompassing footwear, luggage, and accessories, is experiencing robust growth, projected to maintain a 7.06% Compound Annual Growth Rate (CAGR) from 2025 to 2033. This expansion is driven by several factors. Rising disposable incomes across key MEA nations, particularly in the UAE, Saudi Arabia, and Turkey, are fueling increased consumer spending on luxury and premium leather goods. A burgeoning young population with a penchant for fashion and international brands further bolsters market demand. The growing popularity of e-commerce platforms and the expansion of online retail channels are also significantly contributing to market accessibility and sales growth. Furthermore, the increasing adoption of sustainable and ethically sourced leather is influencing consumer choices, prompting brands to adapt their sourcing and production practices. However, market growth is not without its challenges. Economic fluctuations in certain regions and potential supply chain disruptions can impact profitability and market stability. Competition among established international brands and emerging local players remains intense, necessitating continuous innovation and brand differentiation strategies.
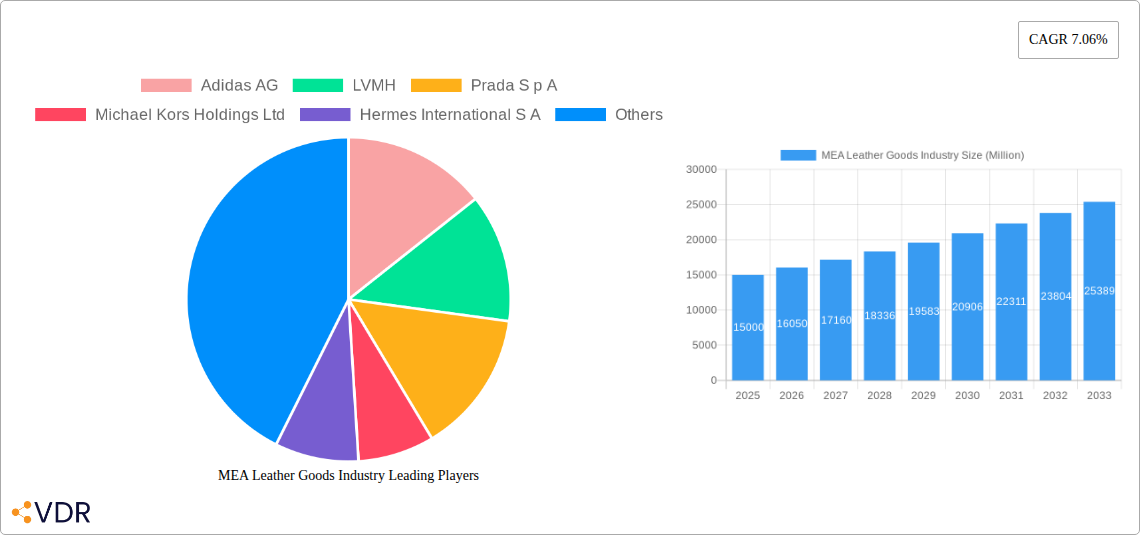
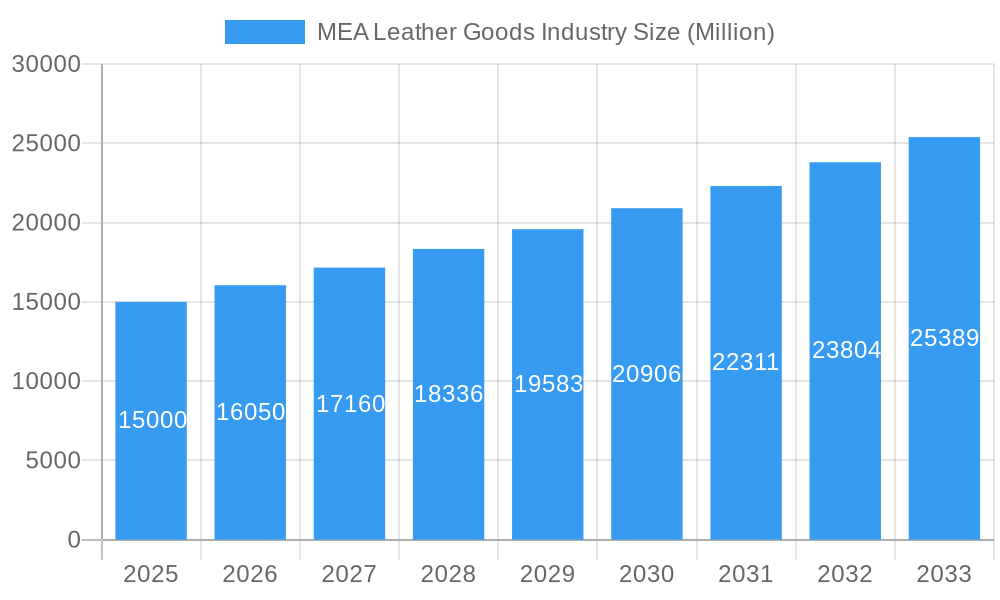
MEA Leather Goods Industry Market Size (In Billion)
The segmentation of the MEA leather goods market reveals significant opportunities within different product categories and distribution channels. While footwear currently holds a substantial market share, the accessories segment is demonstrating rapid growth driven by the popularity of high-end handbags, belts, and wallets. Online retail stores are rapidly gaining traction, signifying a crucial shift in consumer preferences and providing brands with valuable new avenues for reaching their target market. Leading brands such as Adidas, LVMH, Prada, Michael Kors, Hermès, Capri Holdings, Kering, Louis Vuitton, and Ralph Lauren are actively competing for market dominance through strategic investments in branding, retail expansion, and product diversification. The market's future will hinge on brands' ability to adapt to evolving consumer preferences, leverage digital technologies, and address sustainability concerns while maintaining competitive pricing strategies within the context of regional economic dynamics.
MEA Leather Goods Industry Company Market Share
MEA Leather Goods Industry Market Report: 2019-2033
This comprehensive report provides an in-depth analysis of the Middle East and Africa (MEA) leather goods industry, offering invaluable insights for industry professionals, investors, and strategists. The report covers the period 2019-2033, with a focus on the base year 2025 and a forecast period of 2025-2033. The MEA leather goods market, encompassing footwear, luggage, and accessories, is segmented by distribution channel (offline and online retail stores) and exhibits significant growth potential. The report analyzes market dynamics, growth trends, dominant regions, key players (including Adidas AG, LVMH, Prada S p A, Michael Kors Holdings Ltd, Hermes International S A, Capri Holdings Ltd, Kering S A, Louis Vuitton, and Ralph Lauren Corporation), and future opportunities. The market size is projected to reach xx Million units by 2033.
MEA Leather Goods Industry Market Dynamics & Structure
The MEA leather goods market is characterized by a moderately concentrated landscape, with a mix of established multinational corporations and agile regional players vying for market share. Technological innovation is a pivotal force, with advancements in material science enabling the development of more sustainable and durable leathers, alongside cutting-edge manufacturing processes that enhance efficiency and product quality. The evolving regulatory framework, particularly concerning environmental sustainability, ethical sourcing, and labor practices, is significantly shaping industry operations and consumer choices. While competition from high-quality synthetic material-based substitutes is a persistent factor, the intrinsic value and enduring demand for authentic, premium leather goods continue to drive market resilience. The end-user demographic is notably diverse, encompassing a spectrum from style-conscious young professionals to discerning luxury consumers seeking exclusivity and enduring quality. Mergers and acquisitions (M&A) activity has remained moderate, reflecting a strategic approach to consolidation and expansion within the sector. Between 2019 and 2024, approximately xx deals were recorded, indicating a calculated approach to market integration.
- Market Concentration: Moderately concentrated, with the top 5 players estimated to hold around xx% of the market share in 2024, demonstrating a balanced competitive environment.
- Technological Innovation: Key areas of focus include the development of innovative sustainable leather alternatives, the application of 3D printing for intricate designs, and the optimization of manufacturing processes for enhanced efficiency and reduced environmental impact.
- Regulatory Framework: A growing emphasis is placed on ethical sourcing of raw materials and adherence to stringent environmental regulations, influencing production methods and supply chain transparency.
- Competitive Substitutes: The expanding market for high-quality synthetic leather alternatives presents an ongoing challenge, necessitating continuous innovation and differentiation for genuine leather products.
- End-User Demographics: The market caters to a broad range of consumers, from budget-conscious individuals seeking functional accessories to affluent buyers prioritizing luxury, craftsmanship, and brand prestige.
- M&A Activity: The xx M&A deals recorded between 2019 and 2024 highlight a moderate pace of consolidation, suggesting strategic acquisitions aimed at market expansion and portfolio enhancement.
MEA Leather Goods Industry Growth Trends & Insights
The MEA leather goods market has demonstrated robust growth, achieving a Compound Annual Growth Rate (CAGR) of xx% during the historical period (2019-2024). This expansion was primarily fueled by rising disposable incomes, increasing urbanization across key regions, and a discernible surge in the demand for luxury and premium goods, particularly within prominent markets such as the UAE and South Africa. The accelerated adoption of online retail channels presents a significant paradigm shift, creating both new avenues for market reach and competitive challenges for traditional brick-and-mortar establishments. Technological disruptions, including the seamless integration of e-commerce platforms and the growing trend of personalized product customization, are fundamentally reshaping consumer behavior and market dynamics. Market penetration is projected to deepen further, propelled by factors such as expanding tourism sectors and sustained growth in consumer spending power. The forecast period (2025-2033) anticipates a sustained CAGR of xx%, with the market size projected to reach an impressive xx Million units by 2033, signifying substantial future potential.
Dominant Regions, Countries, or Segments in MEA Leather Goods Industry
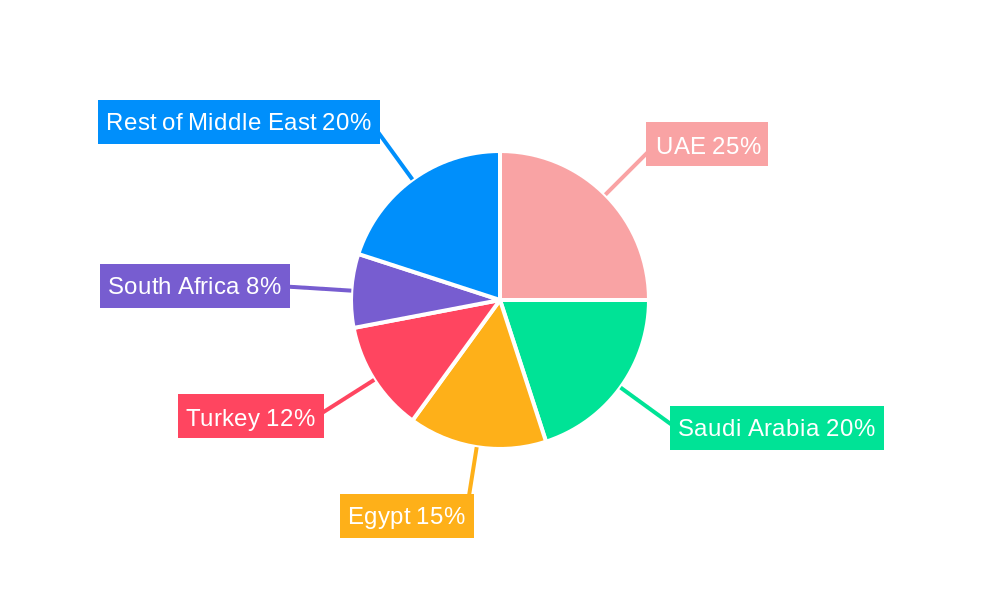
The UAE and South Africa are the leading countries in the MEA leather goods market, fueled by strong economic growth and a high concentration of affluent consumers. Within the product segments, footwear and accessories represent larger market shares compared to luggage. Offline retail stores dominate the distribution channel, although online sales are rapidly growing. Key growth drivers include increasing tourism, favorable government policies promoting retail growth, and developing infrastructure improving logistics and supply chains.
- Leading Regions: The UAE and South Africa dominate the market.
- Leading Segments: Footwear and accessories represent the largest market segments by type.
- Leading Distribution Channel: Offline retail stores currently hold the largest market share.
- Key Drivers: Increasing tourism, favorable economic policies, and infrastructure development.
MEA Leather Goods Industry Product Landscape
The MEA leather goods market boasts an impressively diverse product portfolio, spanning from opulent, high-end luxury items to more accessible and functional everyday accessories. A significant trend is the increasing incorporation of sustainable and ethically sourced leather, reflecting a growing consumer consciousness. Furthermore, advancements in technologically advanced manufacturing techniques are enabling enhanced precision and efficiency, while personalized customization options are becoming a key differentiator, allowing consumers to co-create unique products. The unique selling propositions for many brands often revolve around their rich brand heritage, unparalleled craftsmanship, and the exceptional quality of the materials used. Technological innovations are continuously focused on elevating the durability, comfort, and overall functionality of leather goods, ensuring they meet the evolving demands of modern consumers.
Key Drivers, Barriers & Challenges in MEA Leather Goods Industry
Key Drivers:
- Rising disposable incomes and a growing middle class.
- Increased urbanization and changing lifestyles.
- Growing tourism and influx of international brands.
- Favorable government policies supporting retail growth.
Key Barriers & Challenges:
- Fluctuations in raw material prices.
- Intense competition from both domestic and international brands.
- Supply chain disruptions and logistical challenges.
- Counterfeit products impacting brand reputation.
- Sustainability concerns regarding leather production.
Emerging Opportunities in MEA Leather Goods Industry
- Growing demand for sustainable and ethically sourced leather goods.
- Increased preference for personalized and customized products.
- Expansion into untapped markets within the MEA region.
- Growth of e-commerce and the rise of online marketplaces.
- Collaboration with local artisans and designers to support traditional craftsmanship.
Growth Accelerators in the MEA Leather Goods Industry
Technological advancements in material science and manufacturing processes, strategic partnerships between brands and retailers, and expansion into new markets within the MEA region will accelerate the growth of this industry. Investing in sustainable and ethical production methods will not only mitigate risks but also attract environmentally conscious consumers.
Key Players Shaping the MEA Leather Goods Industry Market
- Adidas AG (Focus on premium leather athletic and lifestyle accessories)
- LVMH (A conglomerate of iconic luxury leather brands, setting high standards in craftsmanship and exclusivity)
- Prada S p A (Renowned for its avant-garde designs and premium leather craftsmanship)
- Michael Kors Holdings Ltd (Offering a blend of contemporary style and accessible luxury in leather goods)
- Hermes International S A (Synonymous with ultimate luxury, heritage, and impeccable leather craftsmanship)
- Capri Holdings Ltd (Home to luxury brands known for their sophisticated leather collections)
- Kering S A (A global luxury group with a strong portfolio of leather goods brands)
- Louis Vuitton (Iconic for its distinctive monogram and high-quality leather luggage and accessories)
- Ralph Lauren Corporation (Offers a range of classic and elegant leather goods with a timeless appeal)
Notable Milestones in MEA Leather Goods Industry Sector
- 2021 Q4: LVMH launches a new sustainable leather collection.
- 2022 Q2: Adidas AG partners with a local artisan group in Morocco.
- 2023 Q1: A major online retailer opens a dedicated luxury leather goods section.
- 2024 Q3: New regulations regarding ethical sourcing are implemented in South Africa.
In-Depth MEA Leather Goods Industry Market Outlook
The MEA leather goods market is exceptionally well-positioned for sustained and robust growth over the forecast period. This positive outlook is underpinned by continued economic development across the region, leading to increased consumer spending power and a heightened appetite for premium products. The ongoing adoption of innovative technologies by manufacturers and retailers will further drive market expansion and enhance product offerings. Strategic partnerships between established brands and emerging players, a steadfast focus on sustainable and ethical practices, and proactive expansion into untapped emerging markets are expected to unlock significant opportunities for both industry veterans and new entrants. The inherent potential of this dynamic market makes it an increasingly attractive sector for investment, innovation, and long-term growth.
MEA Leather Goods Industry Segmentation
-
1. Type
- 1.1. Footwear
- 1.2. Luggage
- 1.3. Accessories
-
2. Distribution Channel
- 2.1. Offline Retail Stores
- 2.2. Online Retail Stores
-
3. Geography
-
3.1. Middle East & Africa
- 3.1.1. United Arab Emirates
- 3.1.2. Saudi Arabia
- 3.1.3. Egypt
- 3.1.4. Turkey
- 3.1.5. South Africa
- 3.1.6. Rest of Middle East & Africa
-
3.1. Middle East & Africa
MEA Leather Goods Industry Segmentation By Geography
- 1. Middle East
-
2. United Arab Emirates
- 2.1. Saudi Arabia
- 2.2. Egypt
- 2.3. Turkey
- 2.4. South Africa
- 2.5. Rest of Middle East
MEA Leather Goods Industry Regional Market Share
Geographic Coverage of MEA Leather Goods Industry
MEA Leather Goods Industry REPORT HIGHLIGHTS
| Aspects | Details |
|---|---|
| Study Period | 2020-2034 |
| Base Year | 2025 |
| Estimated Year | 2026 |
| Forecast Period | 2026-2034 |
| Historical Period | 2020-2025 |
| Growth Rate | CAGR of 7.06% from 2020-2034 |
| Segmentation |
|
Table of Contents
- 1. Introduction
- 1.1. Research Scope
- 1.2. Market Segmentation
- 1.3. Research Objective
- 1.4. Definitions and Assumptions
- 2. Executive Summary
- 2.1. Market Snapshot
- 3. Market Dynamics
- 3.1. Market Drivers
- 3.2. Market Restrains
- 3.3. Market Trends
- 3.4. Market Opportunities
- 4. Market Factor Analysis
- 4.1. Porters Five Forces
- 4.1.1. Bargaining Power of Suppliers
- 4.1.2. Bargaining Power of Buyers
- 4.1.3. Threat of New Entrants
- 4.1.4. Threat of Substitutes
- 4.1.5. Competitive Rivalry
- 4.2. PESTEL analysis
- 4.3. BCG Analysis
- 4.3.1. Stars (High Growth, High Market Share)
- 4.3.2. Cash Cows (Low Growth, High Market Share)
- 4.3.3. Question Mark (High Growth, Low Market Share)
- 4.3.4. Dogs (Low Growth, Low Market Share)
- 4.4. Ansoff Matrix Analysis
- 4.5. Supply Chain Analysis
- 4.6. Regulatory Landscape
- 4.7. Current Market Potential and Opportunity Assessment (TAM–SAM–SOM Framework)
- 4.8. VDR Analyst Note
- 4.1. Porters Five Forces
- 5. Market Analysis, Insights and Forecast 2021-2033
- 5.1. Market Analysis, Insights and Forecast - by Type
- 5.1.1. Footwear
- 5.1.2. Luggage
- 5.1.3. Accessories
- 5.2. Market Analysis, Insights and Forecast - by Distribution Channel
- 5.2.1. Offline Retail Stores
- 5.2.2. Online Retail Stores
- 5.3. Market Analysis, Insights and Forecast - by Geography
- 5.3.1. Middle East & Africa
- 5.3.1.1. United Arab Emirates
- 5.3.1.2. Saudi Arabia
- 5.3.1.3. Egypt
- 5.3.1.4. Turkey
- 5.3.1.5. South Africa
- 5.3.1.6. Rest of Middle East & Africa
- 5.3.1. Middle East & Africa
- 5.4. Market Analysis, Insights and Forecast - by Region
- 5.4.1. Middle East
- 5.4.2. United Arab Emirates
- 5.1. Market Analysis, Insights and Forecast - by Type
- 6. MEA Leather Goods Industry Analysis, Insights and Forecast, 2021-2033
- 6.1. Market Analysis, Insights and Forecast - by Type
- 6.1.1. Footwear
- 6.1.2. Luggage
- 6.1.3. Accessories
- 6.2. Market Analysis, Insights and Forecast - by Distribution Channel
- 6.2.1. Offline Retail Stores
- 6.2.2. Online Retail Stores
- 6.3. Market Analysis, Insights and Forecast - by Geography
- 6.3.1. Middle East & Africa
- 6.3.1.1. United Arab Emirates
- 6.3.1.2. Saudi Arabia
- 6.3.1.3. Egypt
- 6.3.1.4. Turkey
- 6.3.1.5. South Africa
- 6.3.1.6. Rest of Middle East & Africa
- 6.3.1. Middle East & Africa
- 6.1. Market Analysis, Insights and Forecast - by Type
- 7. Middle East MEA Leather Goods Industry Analysis, Insights and Forecast, 2021-2033
- 7.1. Market Analysis, Insights and Forecast - by Type
- 7.1.1. Footwear
- 7.1.2. Luggage
- 7.1.3. Accessories
- 7.2. Market Analysis, Insights and Forecast - by Distribution Channel
- 7.2.1. Offline Retail Stores
- 7.2.2. Online Retail Stores
- 7.3. Market Analysis, Insights and Forecast - by Geography
- 7.3.1. Middle East & Africa
- 7.3.1.1. United Arab Emirates
- 7.3.1.2. Saudi Arabia
- 7.3.1.3. Egypt
- 7.3.1.4. Turkey
- 7.3.1.5. South Africa
- 7.3.1.6. Rest of Middle East & Africa
- 7.3.1. Middle East & Africa
- 7.1. Market Analysis, Insights and Forecast - by Type
- 8. United Arab Emirates MEA Leather Goods Industry Analysis, Insights and Forecast, 2021-2033
- 8.1. Market Analysis, Insights and Forecast - by Type
- 8.1.1. Footwear
- 8.1.2. Luggage
- 8.1.3. Accessories
- 8.2. Market Analysis, Insights and Forecast - by Distribution Channel
- 8.2.1. Offline Retail Stores
- 8.2.2. Online Retail Stores
- 8.3. Market Analysis, Insights and Forecast - by Geography
- 8.3.1. Middle East & Africa
- 8.3.1.1. United Arab Emirates
- 8.3.1.2. Saudi Arabia
- 8.3.1.3. Egypt
- 8.3.1.4. Turkey
- 8.3.1.5. South Africa
- 8.3.1.6. Rest of Middle East & Africa
- 8.3.1. Middle East & Africa
- 8.1. Market Analysis, Insights and Forecast - by Type
- 9. Competitive Analysis
- 9.1. Company Profiles
- 9.1.1 Adidas AG
- 9.1.1.1. Company Overview
- 9.1.1.2. Products
- 9.1.1.3. Company Financials
- 9.1.1.4. SWOT Analysis
- 9.1.2 LVMH
- 9.1.2.1. Company Overview
- 9.1.2.2. Products
- 9.1.2.3. Company Financials
- 9.1.2.4. SWOT Analysis
- 9.1.3 Prada S p A
- 9.1.3.1. Company Overview
- 9.1.3.2. Products
- 9.1.3.3. Company Financials
- 9.1.3.4. SWOT Analysis
- 9.1.4 Michael Kors Holdings Ltd
- 9.1.4.1. Company Overview
- 9.1.4.2. Products
- 9.1.4.3. Company Financials
- 9.1.4.4. SWOT Analysis
- 9.1.5 Hermes International S A
- 9.1.5.1. Company Overview
- 9.1.5.2. Products
- 9.1.5.3. Company Financials
- 9.1.5.4. SWOT Analysis
- 9.1.6 Capri Holdings Ltd
- 9.1.6.1. Company Overview
- 9.1.6.2. Products
- 9.1.6.3. Company Financials
- 9.1.6.4. SWOT Analysis
- 9.1.7 Kering S A *List Not Exhaustive
- 9.1.7.1. Company Overview
- 9.1.7.2. Products
- 9.1.7.3. Company Financials
- 9.1.7.4. SWOT Analysis
- 9.1.8 Louis Vuitton
- 9.1.8.1. Company Overview
- 9.1.8.2. Products
- 9.1.8.3. Company Financials
- 9.1.8.4. SWOT Analysis
- 9.1.9 Ralph Lauren Corporation
- 9.1.9.1. Company Overview
- 9.1.9.2. Products
- 9.1.9.3. Company Financials
- 9.1.9.4. SWOT Analysis
- 9.1.1 Adidas AG
- 9.2. Market Entropy
- 9.2.1 Company's Key Areas Served
- 9.2.2 Recent Developments
- 9.3. Company Market Share Analysis 2025
- 9.3.1 Top 5 Companies Market Share Analysis
- 9.3.2 Top 3 Companies Market Share Analysis
- 9.4. List of Potential Customers
- 10. Research Methodology
List of Figures
- Figure 1: MEA Leather Goods Industry Revenue Breakdown (Million, %) by Product 2025 & 2033
- Figure 2: MEA Leather Goods Industry Share (%) by Company 2025
List of Tables
- Table 1: MEA Leather Goods Industry Revenue Million Forecast, by Type 2020 & 2033
- Table 2: MEA Leather Goods Industry Volume K Units Forecast, by Type 2020 & 2033
- Table 3: MEA Leather Goods Industry Revenue Million Forecast, by Distribution Channel 2020 & 2033
- Table 4: MEA Leather Goods Industry Volume K Units Forecast, by Distribution Channel 2020 & 2033
- Table 5: MEA Leather Goods Industry Revenue Million Forecast, by Geography 2020 & 2033
- Table 6: MEA Leather Goods Industry Volume K Units Forecast, by Geography 2020 & 2033
- Table 7: MEA Leather Goods Industry Revenue Million Forecast, by Region 2020 & 2033
- Table 8: MEA Leather Goods Industry Volume K Units Forecast, by Region 2020 & 2033
- Table 9: MEA Leather Goods Industry Revenue Million Forecast, by Type 2020 & 2033
- Table 10: MEA Leather Goods Industry Volume K Units Forecast, by Type 2020 & 2033
- Table 11: MEA Leather Goods Industry Revenue Million Forecast, by Distribution Channel 2020 & 2033
- Table 12: MEA Leather Goods Industry Volume K Units Forecast, by Distribution Channel 2020 & 2033
- Table 13: MEA Leather Goods Industry Revenue Million Forecast, by Geography 2020 & 2033
- Table 14: MEA Leather Goods Industry Volume K Units Forecast, by Geography 2020 & 2033
- Table 15: MEA Leather Goods Industry Revenue Million Forecast, by Country 2020 & 2033
- Table 16: MEA Leather Goods Industry Volume K Units Forecast, by Country 2020 & 2033
- Table 17: MEA Leather Goods Industry Revenue Million Forecast, by Type 2020 & 2033
- Table 18: MEA Leather Goods Industry Volume K Units Forecast, by Type 2020 & 2033
- Table 19: MEA Leather Goods Industry Revenue Million Forecast, by Distribution Channel 2020 & 2033
- Table 20: MEA Leather Goods Industry Volume K Units Forecast, by Distribution Channel 2020 & 2033
- Table 21: MEA Leather Goods Industry Revenue Million Forecast, by Geography 2020 & 2033
- Table 22: MEA Leather Goods Industry Volume K Units Forecast, by Geography 2020 & 2033
- Table 23: MEA Leather Goods Industry Revenue Million Forecast, by Country 2020 & 2033
- Table 24: MEA Leather Goods Industry Volume K Units Forecast, by Country 2020 & 2033
- Table 25: Saudi Arabia MEA Leather Goods Industry Revenue (Million) Forecast, by Application 2020 & 2033
- Table 26: Saudi Arabia MEA Leather Goods Industry Volume (K Units) Forecast, by Application 2020 & 2033
- Table 27: Egypt MEA Leather Goods Industry Revenue (Million) Forecast, by Application 2020 & 2033
- Table 28: Egypt MEA Leather Goods Industry Volume (K Units) Forecast, by Application 2020 & 2033
- Table 29: Turkey MEA Leather Goods Industry Revenue (Million) Forecast, by Application 2020 & 2033
- Table 30: Turkey MEA Leather Goods Industry Volume (K Units) Forecast, by Application 2020 & 2033
- Table 31: South Africa MEA Leather Goods Industry Revenue (Million) Forecast, by Application 2020 & 2033
- Table 32: South Africa MEA Leather Goods Industry Volume (K Units) Forecast, by Application 2020 & 2033
- Table 33: Rest of Middle East MEA Leather Goods Industry Revenue (Million) Forecast, by Application 2020 & 2033
- Table 34: Rest of Middle East MEA Leather Goods Industry Volume (K Units) Forecast, by Application 2020 & 2033
Frequently Asked Questions
1. What is the projected Compound Annual Growth Rate (CAGR) of the MEA Leather Goods Industry?
The projected CAGR is approximately 7.06%.
2. Which companies are prominent players in the MEA Leather Goods Industry?
Key companies in the market include Adidas AG, LVMH, Prada S p A, Michael Kors Holdings Ltd, Hermes International S A, Capri Holdings Ltd, Kering S A *List Not Exhaustive, Louis Vuitton, Ralph Lauren Corporation.
3. What are the main segments of the MEA Leather Goods Industry?
The market segments include Type, Distribution Channel, Geography.
4. Can you provide details about the market size?
The market size is estimated to be USD XX Million as of 2022.
5. What are some drivers contributing to market growth?
Increase in Sports Participation; Trend of Athleisure.
6. What are the notable trends driving market growth?
Specialized Leather Processing Hub leading to an Increase in Production and Exports.
7. Are there any restraints impacting market growth?
Availability of Fake and Counterfeit Products.
8. Can you provide examples of recent developments in the market?
N/A
9. What pricing options are available for accessing the report?
Pricing options include single-user, multi-user, and enterprise licenses priced at USD 3800, USD 4500, and USD 5800 respectively.
10. Is the market size provided in terms of value or volume?
The market size is provided in terms of value, measured in Million and volume, measured in K Units.
11. Are there any specific market keywords associated with the report?
Yes, the market keyword associated with the report is "MEA Leather Goods Industry," which aids in identifying and referencing the specific market segment covered.
12. How do I determine which pricing option suits my needs best?
The pricing options vary based on user requirements and access needs. Individual users may opt for single-user licenses, while businesses requiring broader access may choose multi-user or enterprise licenses for cost-effective access to the report.
13. Are there any additional resources or data provided in the MEA Leather Goods Industry report?
While the report offers comprehensive insights, it's advisable to review the specific contents or supplementary materials provided to ascertain if additional resources or data are available.
14. How can I stay updated on further developments or reports in the MEA Leather Goods Industry?
To stay informed about further developments, trends, and reports in the MEA Leather Goods Industry, consider subscribing to industry newsletters, following relevant companies and organizations, or regularly checking reputable industry news sources and publications.
Methodology
Step 1 - Identification of Relevant Samples Size from Population Database


Step 2 - Approaches for Defining Global Market Size (Value, Volume* & Price*)

Note*: In applicable scenarios
Step 3 - Data Sources
Primary Research
- Web Analytics
- Survey Reports
- Research Institute
- Latest Research Reports
- Opinion Leaders
Secondary Research
- Annual Reports
- White Paper
- Latest Press Release
- Industry Association
- Paid Database
- Investor Presentations

Step 4 - Data Triangulation
Involves using different sources of information in order to increase the validity of a study
These sources are likely to be stakeholders in a program - participants, other researchers, program staff, other community members, and so on.
Then we put all data in single framework & apply various statistical tools to find out the dynamic on the market.
During the analysis stage, feedback from the stakeholder groups would be compared to determine areas of agreement as well as areas of divergence