Key Insights
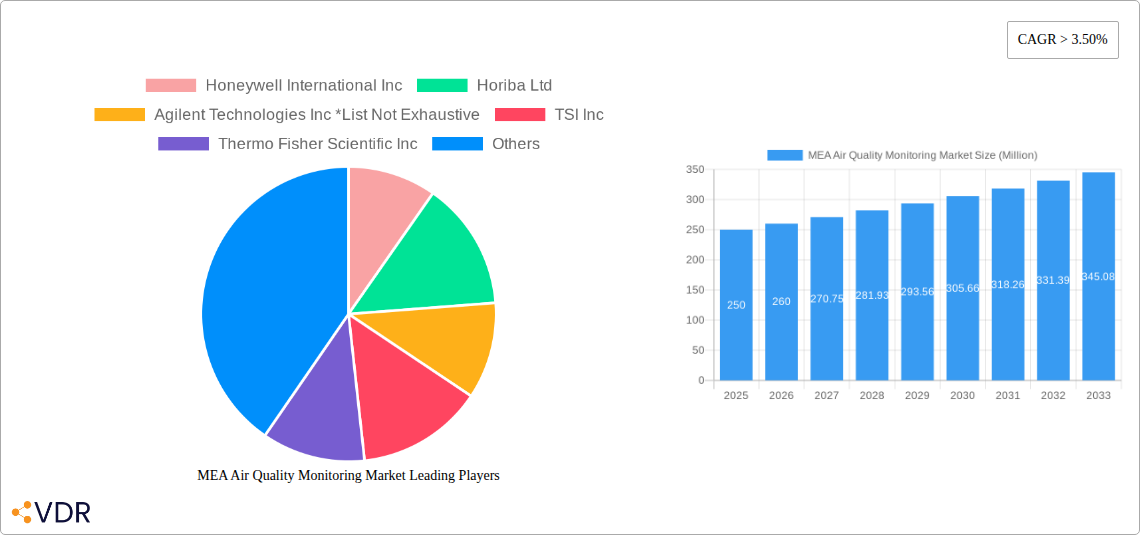
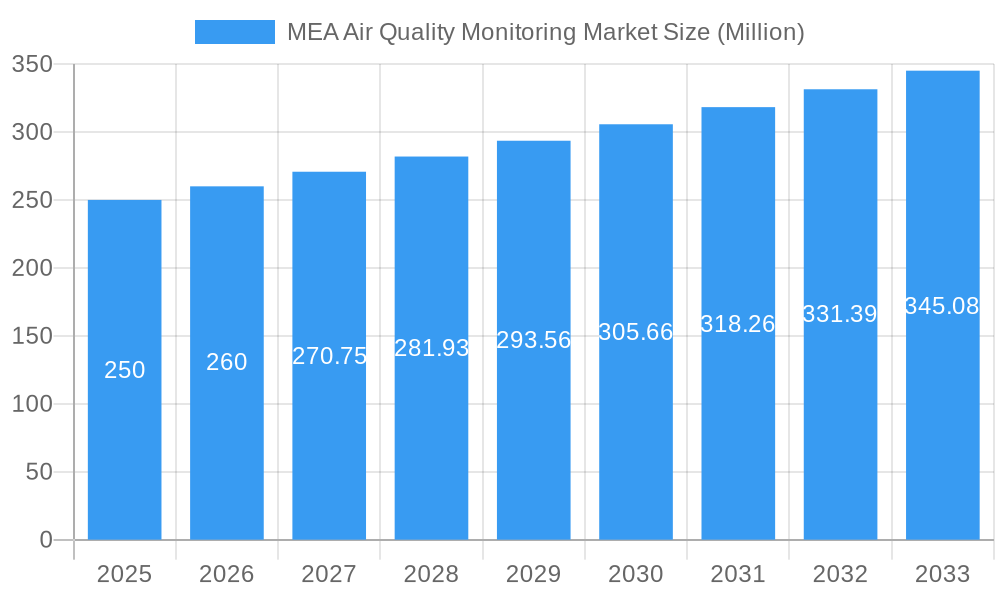
The Middle East & Africa (MEA) Air Quality Monitoring Market is poised for significant expansion, propelled by heightened environmental awareness, stricter regulatory mandates, and accelerating industrial development across the region. The market, valued at an estimated $5.5 billion in 2025, is projected to grow at a Compound Annual Growth Rate (CAGR) of 6.2% between 2025 and 2033. This growth is underpinned by several critical drivers. Firstly, the rising incidence of respiratory ailments linked to deteriorating air quality is compelling MEA governments to prioritize investments in comprehensive air quality monitoring infrastructure. Secondly, the expanding petrochemical and power generation industries, key sources of air pollution, are increasingly integrating advanced monitoring technologies to adhere to emission standards. The continuous monitoring segment is expected to lead the market, owing to its real-time data analytics capabilities and rapid response mechanisms to pollution events. Moreover, the demand for chemical pollutant monitoring is anticipated to be robust, reflecting the region's industrial activities. Leading companies such as Honeywell, Horiba, and Agilent Technologies are actively contributing to market growth through innovation and strategic collaborations. The proliferation of smart city initiatives further amplifies market momentum, driving the adoption of interconnected, sophisticated monitoring systems.
MEA Air Quality Monitoring Market Market Size (In Billion)
Despite positive growth prospects, the market confronts certain challenges. The substantial upfront investment required for sophisticated monitoring equipment may present a hurdle for smaller enterprises and local authorities. Furthermore, a deficit in skilled personnel for the operation and maintenance of complex systems, combined with the logistical complexities posed by the MEA region's diverse geography for installation and upkeep, could impede market penetration in specific areas. Nevertheless, continuous technological advancements are yielding more cost-effective and user-friendly solutions. Coupled with government incentives and public awareness campaigns, these developments are expected to counterbalance these challenges and ensure sustained market growth throughout the forecast period. The residential and commercial sectors are anticipated to see a notable increase in the adoption of air quality monitoring solutions.
MEA Air Quality Monitoring Market Company Market Share
MEA Air Quality Monitoring Market: A Comprehensive Market Report (2019-2033)
This in-depth report provides a comprehensive analysis of the Middle East and Africa (MEA) Air Quality Monitoring Market, offering invaluable insights for industry professionals, investors, and policymakers. The report covers the period 2019-2033, with a focus on the forecast period 2025-2033 and a base year of 2025. The market is segmented by product type (Indoor Monitor, Outdoor Monitor), sampling method (Continuous, Manual, Intermittent), pollutant type (Chemical, Physical, Biological), and end-user (Residential & Commercial, Power Generation, Petrochemicals, Other). Key players include Honeywell International Inc, Horiba Ltd, Agilent Technologies Inc, TSI Inc, Thermo Fisher Scientific Inc, Emerson Electric Co, Siemens AG, 3M Co, and Teledyne Technologies Inc. The report's total market value is estimated at xx Million in 2025, projected to reach xx Million by 2033.
MEA Air Quality Monitoring Market Dynamics & Structure
The MEA air quality monitoring market is experiencing significant growth driven by increasing environmental concerns, stringent government regulations, and rising industrialization. Market concentration is moderate, with several key players dominating specific segments. Technological innovation, particularly in sensor technology and data analytics, is a major driver, while regulatory frameworks are becoming increasingly stringent, pushing adoption of advanced monitoring solutions. The market witnesses a steady flow of M&A activity, as larger companies seek to consolidate their market share and expand their product portfolios.
- Market Concentration: Moderate, with a few major players holding significant shares.
- Technological Innovation: Advancements in sensor technology, data analytics, and IoT integration are key drivers.
- Regulatory Landscape: Stringent environmental regulations in several MEA countries are driving market demand.
- Competitive Substitutes: Limited direct substitutes exist, but alternative solutions for pollution control could indirectly impact market growth.
- End-User Demographics: Growth is fueled by a mix of industrial, commercial, and government end-users.
- M&A Activity: Consolidation through mergers and acquisitions is expected to continue, shaping market dynamics. The number of M&A deals in the last 5 years is estimated at xx.
MEA Air Quality Monitoring Market Growth Trends & Insights
The MEA air quality monitoring market is experiencing robust growth, driven by increasing awareness of air pollution's health impacts, government initiatives promoting environmental sustainability, and the rising adoption of advanced monitoring technologies. The market witnessed a CAGR of xx% during the historical period (2019-2024), and is expected to maintain a CAGR of xx% during the forecast period (2025-2033). Market penetration is currently at xx% and is anticipated to rise to xx% by 2033. Technological disruptions, such as the increasing adoption of IoT-enabled devices and AI-powered data analytics, are transforming the market. Consumer behavior is shifting towards greater awareness and demand for cleaner air, further fueling market growth. The rising adoption of continuous monitoring systems, especially in urban areas and industrial zones, is a significant trend.
Dominant Regions, Countries, or Segments in MEA Air Quality Monitoring Market
The UAE and Saudi Arabia are currently the dominant markets in the MEA region, driven by significant investments in infrastructure development, stringent environmental regulations, and increasing concerns about air quality. The Outdoor Monitor segment holds the largest market share due to the extensive need for monitoring ambient air quality across various settings. The continuous sampling method is gaining traction due to its ability to provide real-time data, critical for effective pollution control measures. Chemical pollutants monitoring is the largest segment, reflecting the prevalence of industrial emissions. Power generation and petrochemical industries are major end-users, with significant investment in air quality monitoring systems.
- Key Drivers: Stringent environmental regulations, rising urbanization, industrial development, and government initiatives.
- UAE & Saudi Arabia Dominance: High investments in infrastructure and stricter environmental policies fuel growth in these countries.
- Outdoor Monitor Segment: Largest market share due to the need for wide-area air quality monitoring.
- Continuous Sampling Method: Gaining popularity for real-time monitoring capabilities.
- Chemical Pollutant Monitoring: Largest pollutant segment, driven by industrial emissions.
MEA Air Quality Monitoring Market Product Landscape
The MEA air quality monitoring market showcases a wide range of products, from portable handheld devices to sophisticated, network-connected monitoring systems. Recent innovations focus on enhanced accuracy, real-time data analysis, and remote monitoring capabilities. Miniaturization and improved sensor technologies are driving the development of smaller, more cost-effective devices. Products with advanced data analytics and AI-powered insights are increasingly gaining traction. The unique selling propositions revolve around ease of use, data reliability, advanced analytics capabilities, and robust connectivity for remote monitoring.
Key Drivers, Barriers & Challenges in MEA Air Quality Monitoring Market
Key Drivers:
- Increasing environmental awareness and concerns about air pollution's health impact.
- Stringent government regulations and environmental policies.
- Rising industrialization and urbanization.
- Technological advancements in sensor technology, data analytics, and IoT.
Challenges & Restraints:
- High initial investment costs for advanced monitoring systems can deter adoption by smaller businesses.
- Lack of skilled personnel to operate and maintain complex monitoring systems in some regions.
- Supply chain disruptions, especially for specialized sensors and components.
- Data management and interpretation challenges associated with large datasets generated by monitoring systems. Estimated impact on market growth: xx%.
Emerging Opportunities in MEA Air Quality Monitoring Market
- Growing demand for affordable and user-friendly air quality monitors for residential use.
- Expansion into untapped markets, especially in smaller cities and rural areas.
- Integration of air quality monitoring data with smart city initiatives.
- Development of innovative solutions for specific pollutants, such as particulate matter and greenhouse gases.
Growth Accelerators in the MEA Air Quality Monitoring Market Industry
Strategic partnerships between technology providers and government agencies are accelerating market growth. Technological breakthroughs, including the development of more sensitive and selective sensors, will drive innovation. Market expansion strategies focused on underserved regions and end-user segments are vital. Government incentives and subsidies for adopting air quality monitoring technologies can further stimulate market expansion.
Key Players Shaping the MEA Air Quality Monitoring Market Market
Notable Milestones in MEA Air Quality Monitoring Market Sector
- July 2022: Ajman Free Zone implemented an ambient air quality monitoring system using AirSense technology. This initiative demonstrates the increasing adoption of advanced monitoring solutions in industrial areas.
- June 2022: The UAE's National Air Quality Agenda 2031 provides a strategic framework for managing air pollution, stimulating further growth in the market.
- March 2022: Expansion of Abu Dhabi's air monitoring network to 22 monitors underscores the commitment to improving air quality and data collection.
In-Depth MEA Air Quality Monitoring Market Market Outlook
The MEA air quality monitoring market is poised for substantial growth, driven by supportive government policies, escalating environmental concerns, and technological advancements. Strategic opportunities exist for companies to develop innovative solutions tailored to specific regional needs. Focusing on cost-effective and user-friendly products for residential use presents a significant growth avenue. Expansion into untapped markets and strategic partnerships will be key to unlocking future market potential.
MEA Air Quality Monitoring Market Segmentation
-
1. Product Type
- 1.1. Indoor Monitor
- 1.2. Outdoor Monitor
-
2. Sampling Method
- 2.1. Continuous
- 2.2. Manual
- 2.3. Intermittent
-
3. Pollutant Type
- 3.1. Chemical Pollutants
- 3.2. Physical Pollutants
- 3.3. Biological Pollutants
-
4. End User
- 4.1. Residential and Commercial
- 4.2. Power Generation
- 4.3. Petrochemicals
- 4.4. Other End Users
-
5. Geography
- 5.1. Saudi Arabia
- 5.2. United Arab Emirates
- 5.3. Rest of Middle-East and Africa
MEA Air Quality Monitoring Market Segmentation By Geography
- 1. Saudi Arabia
- 2. United Arab Emirates
- 3. Rest of Middle East and Africa
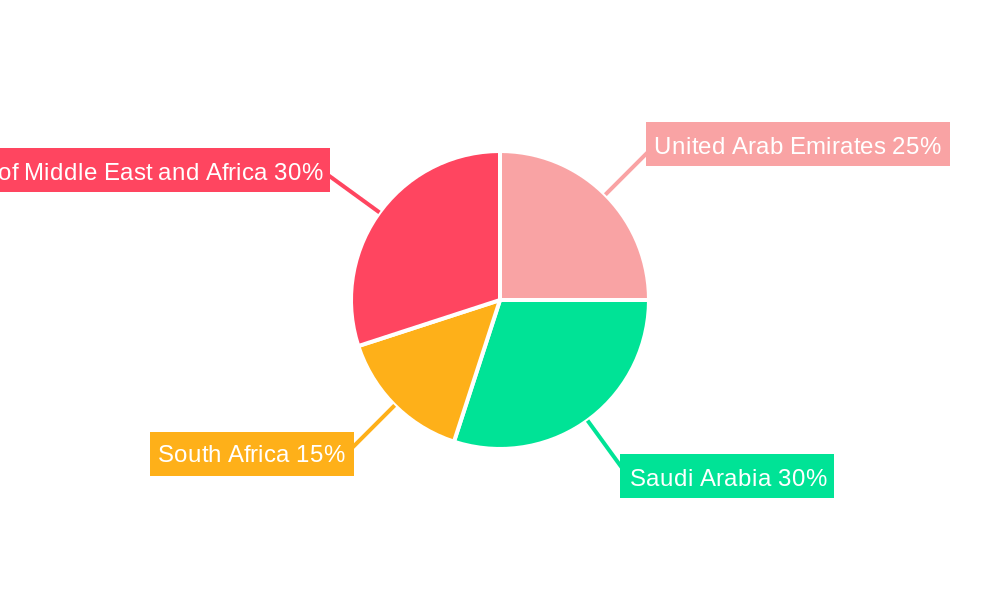
MEA Air Quality Monitoring Market Regional Market Share
Geographic Coverage of MEA Air Quality Monitoring Market
MEA Air Quality Monitoring Market REPORT HIGHLIGHTS
| Aspects | Details |
|---|---|
| Study Period | 2020-2034 |
| Base Year | 2025 |
| Estimated Year | 2026 |
| Forecast Period | 2026-2034 |
| Historical Period | 2020-2025 |
| Growth Rate | CAGR of 6.2% from 2020-2034 |
| Segmentation |
|
Table of Contents
- 1. Introduction
- 1.1. Research Scope
- 1.2. Market Segmentation
- 1.3. Research Objective
- 1.4. Definitions and Assumptions
- 2. Executive Summary
- 2.1. Market Snapshot
- 3. Market Dynamics
- 3.1. Market Drivers
- 3.2. Market Restrains
- 3.3. Market Trends
- 3.4. Market Opportunities
- 4. Market Factor Analysis
- 4.1. Porters Five Forces
- 4.1.1. Bargaining Power of Suppliers
- 4.1.2. Bargaining Power of Buyers
- 4.1.3. Threat of New Entrants
- 4.1.4. Threat of Substitutes
- 4.1.5. Competitive Rivalry
- 4.2. PESTEL analysis
- 4.3. BCG Analysis
- 4.3.1. Stars (High Growth, High Market Share)
- 4.3.2. Cash Cows (Low Growth, High Market Share)
- 4.3.3. Question Mark (High Growth, Low Market Share)
- 4.3.4. Dogs (Low Growth, Low Market Share)
- 4.4. Ansoff Matrix Analysis
- 4.5. Supply Chain Analysis
- 4.6. Regulatory Landscape
- 4.7. Current Market Potential and Opportunity Assessment (TAM–SAM–SOM Framework)
- 4.8. VDR Analyst Note
- 4.1. Porters Five Forces
- 5. Market Analysis, Insights and Forecast 2021-2033
- 5.1. Market Analysis, Insights and Forecast - by Product Type
- 5.1.1. Indoor Monitor
- 5.1.2. Outdoor Monitor
- 5.2. Market Analysis, Insights and Forecast - by Sampling Method
- 5.2.1. Continuous
- 5.2.2. Manual
- 5.2.3. Intermittent
- 5.3. Market Analysis, Insights and Forecast - by Pollutant Type
- 5.3.1. Chemical Pollutants
- 5.3.2. Physical Pollutants
- 5.3.3. Biological Pollutants
- 5.4. Market Analysis, Insights and Forecast - by End User
- 5.4.1. Residential and Commercial
- 5.4.2. Power Generation
- 5.4.3. Petrochemicals
- 5.4.4. Other End Users
- 5.5. Market Analysis, Insights and Forecast - by Geography
- 5.5.1. Saudi Arabia
- 5.5.2. United Arab Emirates
- 5.5.3. Rest of Middle-East and Africa
- 5.6. Market Analysis, Insights and Forecast - by Region
- 5.6.1. Saudi Arabia
- 5.6.2. United Arab Emirates
- 5.6.3. Rest of Middle East and Africa
- 5.1. Market Analysis, Insights and Forecast - by Product Type
- 6. MEA Air Quality Monitoring Market Analysis, Insights and Forecast, 2021-2033
- 6.1. Market Analysis, Insights and Forecast - by Product Type
- 6.1.1. Indoor Monitor
- 6.1.2. Outdoor Monitor
- 6.2. Market Analysis, Insights and Forecast - by Sampling Method
- 6.2.1. Continuous
- 6.2.2. Manual
- 6.2.3. Intermittent
- 6.3. Market Analysis, Insights and Forecast - by Pollutant Type
- 6.3.1. Chemical Pollutants
- 6.3.2. Physical Pollutants
- 6.3.3. Biological Pollutants
- 6.4. Market Analysis, Insights and Forecast - by End User
- 6.4.1. Residential and Commercial
- 6.4.2. Power Generation
- 6.4.3. Petrochemicals
- 6.4.4. Other End Users
- 6.5. Market Analysis, Insights and Forecast - by Geography
- 6.5.1. Saudi Arabia
- 6.5.2. United Arab Emirates
- 6.5.3. Rest of Middle-East and Africa
- 6.1. Market Analysis, Insights and Forecast - by Product Type
- 7. Saudi Arabia MEA Air Quality Monitoring Market Analysis, Insights and Forecast, 2021-2033
- 7.1. Market Analysis, Insights and Forecast - by Product Type
- 7.1.1. Indoor Monitor
- 7.1.2. Outdoor Monitor
- 7.2. Market Analysis, Insights and Forecast - by Sampling Method
- 7.2.1. Continuous
- 7.2.2. Manual
- 7.2.3. Intermittent
- 7.3. Market Analysis, Insights and Forecast - by Pollutant Type
- 7.3.1. Chemical Pollutants
- 7.3.2. Physical Pollutants
- 7.3.3. Biological Pollutants
- 7.4. Market Analysis, Insights and Forecast - by End User
- 7.4.1. Residential and Commercial
- 7.4.2. Power Generation
- 7.4.3. Petrochemicals
- 7.4.4. Other End Users
- 7.5. Market Analysis, Insights and Forecast - by Geography
- 7.5.1. Saudi Arabia
- 7.5.2. United Arab Emirates
- 7.5.3. Rest of Middle-East and Africa
- 7.1. Market Analysis, Insights and Forecast - by Product Type
- 8. United Arab Emirates MEA Air Quality Monitoring Market Analysis, Insights and Forecast, 2021-2033
- 8.1. Market Analysis, Insights and Forecast - by Product Type
- 8.1.1. Indoor Monitor
- 8.1.2. Outdoor Monitor
- 8.2. Market Analysis, Insights and Forecast - by Sampling Method
- 8.2.1. Continuous
- 8.2.2. Manual
- 8.2.3. Intermittent
- 8.3. Market Analysis, Insights and Forecast - by Pollutant Type
- 8.3.1. Chemical Pollutants
- 8.3.2. Physical Pollutants
- 8.3.3. Biological Pollutants
- 8.4. Market Analysis, Insights and Forecast - by End User
- 8.4.1. Residential and Commercial
- 8.4.2. Power Generation
- 8.4.3. Petrochemicals
- 8.4.4. Other End Users
- 8.5. Market Analysis, Insights and Forecast - by Geography
- 8.5.1. Saudi Arabia
- 8.5.2. United Arab Emirates
- 8.5.3. Rest of Middle-East and Africa
- 8.1. Market Analysis, Insights and Forecast - by Product Type
- 9. Rest of Middle East and Africa MEA Air Quality Monitoring Market Analysis, Insights and Forecast, 2021-2033
- 9.1. Market Analysis, Insights and Forecast - by Product Type
- 9.1.1. Indoor Monitor
- 9.1.2. Outdoor Monitor
- 9.2. Market Analysis, Insights and Forecast - by Sampling Method
- 9.2.1. Continuous
- 9.2.2. Manual
- 9.2.3. Intermittent
- 9.3. Market Analysis, Insights and Forecast - by Pollutant Type
- 9.3.1. Chemical Pollutants
- 9.3.2. Physical Pollutants
- 9.3.3. Biological Pollutants
- 9.4. Market Analysis, Insights and Forecast - by End User
- 9.4.1. Residential and Commercial
- 9.4.2. Power Generation
- 9.4.3. Petrochemicals
- 9.4.4. Other End Users
- 9.5. Market Analysis, Insights and Forecast - by Geography
- 9.5.1. Saudi Arabia
- 9.5.2. United Arab Emirates
- 9.5.3. Rest of Middle-East and Africa
- 9.1. Market Analysis, Insights and Forecast - by Product Type
- 10. Competitive Analysis
- 10.1. Company Profiles
- 10.1.1 Honeywell International Inc
- 10.1.1.1. Company Overview
- 10.1.1.2. Products
- 10.1.1.3. Company Financials
- 10.1.1.4. SWOT Analysis
- 10.1.2 Horiba Ltd
- 10.1.2.1. Company Overview
- 10.1.2.2. Products
- 10.1.2.3. Company Financials
- 10.1.2.4. SWOT Analysis
- 10.1.3 Agilent Technologies Inc *List Not Exhaustive
- 10.1.3.1. Company Overview
- 10.1.3.2. Products
- 10.1.3.3. Company Financials
- 10.1.3.4. SWOT Analysis
- 10.1.4 TSI Inc
- 10.1.4.1. Company Overview
- 10.1.4.2. Products
- 10.1.4.3. Company Financials
- 10.1.4.4. SWOT Analysis
- 10.1.5 Thermo Fisher Scientific Inc
- 10.1.5.1. Company Overview
- 10.1.5.2. Products
- 10.1.5.3. Company Financials
- 10.1.5.4. SWOT Analysis
- 10.1.6 Emerson Electric Co
- 10.1.6.1. Company Overview
- 10.1.6.2. Products
- 10.1.6.3. Company Financials
- 10.1.6.4. SWOT Analysis
- 10.1.7 Siemens AG
- 10.1.7.1. Company Overview
- 10.1.7.2. Products
- 10.1.7.3. Company Financials
- 10.1.7.4. SWOT Analysis
- 10.1.8 3M Co
- 10.1.8.1. Company Overview
- 10.1.8.2. Products
- 10.1.8.3. Company Financials
- 10.1.8.4. SWOT Analysis
- 10.1.9 Teledyne Technologies Inc
- 10.1.9.1. Company Overview
- 10.1.9.2. Products
- 10.1.9.3. Company Financials
- 10.1.9.4. SWOT Analysis
- 10.1.1 Honeywell International Inc
- 10.2. Market Entropy
- 10.2.1 Company's Key Areas Served
- 10.2.2 Recent Developments
- 10.3. Company Market Share Analysis 2025
- 10.3.1 Top 5 Companies Market Share Analysis
- 10.3.2 Top 3 Companies Market Share Analysis
- 10.4. List of Potential Customers
- 11. Research Methodology
List of Figures
- Figure 1: MEA Air Quality Monitoring Market Revenue Breakdown (billion, %) by Product 2025 & 2033
- Figure 2: MEA Air Quality Monitoring Market Share (%) by Company 2025
List of Tables
- Table 1: MEA Air Quality Monitoring Market Revenue billion Forecast, by Product Type 2020 & 2033
- Table 2: MEA Air Quality Monitoring Market Revenue billion Forecast, by Sampling Method 2020 & 2033
- Table 3: MEA Air Quality Monitoring Market Revenue billion Forecast, by Pollutant Type 2020 & 2033
- Table 4: MEA Air Quality Monitoring Market Revenue billion Forecast, by End User 2020 & 2033
- Table 5: MEA Air Quality Monitoring Market Revenue billion Forecast, by Geography 2020 & 2033
- Table 6: MEA Air Quality Monitoring Market Revenue billion Forecast, by Region 2020 & 2033
- Table 7: MEA Air Quality Monitoring Market Revenue billion Forecast, by Product Type 2020 & 2033
- Table 8: MEA Air Quality Monitoring Market Revenue billion Forecast, by Sampling Method 2020 & 2033
- Table 9: MEA Air Quality Monitoring Market Revenue billion Forecast, by Pollutant Type 2020 & 2033
- Table 10: MEA Air Quality Monitoring Market Revenue billion Forecast, by End User 2020 & 2033
- Table 11: MEA Air Quality Monitoring Market Revenue billion Forecast, by Geography 2020 & 2033
- Table 12: MEA Air Quality Monitoring Market Revenue billion Forecast, by Country 2020 & 2033
- Table 13: MEA Air Quality Monitoring Market Revenue billion Forecast, by Product Type 2020 & 2033
- Table 14: MEA Air Quality Monitoring Market Revenue billion Forecast, by Sampling Method 2020 & 2033
- Table 15: MEA Air Quality Monitoring Market Revenue billion Forecast, by Pollutant Type 2020 & 2033
- Table 16: MEA Air Quality Monitoring Market Revenue billion Forecast, by End User 2020 & 2033
- Table 17: MEA Air Quality Monitoring Market Revenue billion Forecast, by Geography 2020 & 2033
- Table 18: MEA Air Quality Monitoring Market Revenue billion Forecast, by Country 2020 & 2033
- Table 19: MEA Air Quality Monitoring Market Revenue billion Forecast, by Product Type 2020 & 2033
- Table 20: MEA Air Quality Monitoring Market Revenue billion Forecast, by Sampling Method 2020 & 2033
- Table 21: MEA Air Quality Monitoring Market Revenue billion Forecast, by Pollutant Type 2020 & 2033
- Table 22: MEA Air Quality Monitoring Market Revenue billion Forecast, by End User 2020 & 2033
- Table 23: MEA Air Quality Monitoring Market Revenue billion Forecast, by Geography 2020 & 2033
- Table 24: MEA Air Quality Monitoring Market Revenue billion Forecast, by Country 2020 & 2033
Frequently Asked Questions
1. What is the projected Compound Annual Growth Rate (CAGR) of the MEA Air Quality Monitoring Market?
The projected CAGR is approximately 6.2%.
2. Which companies are prominent players in the MEA Air Quality Monitoring Market?
Key companies in the market include Honeywell International Inc, Horiba Ltd, Agilent Technologies Inc *List Not Exhaustive, TSI Inc, Thermo Fisher Scientific Inc, Emerson Electric Co, Siemens AG, 3M Co, Teledyne Technologies Inc.
3. What are the main segments of the MEA Air Quality Monitoring Market?
The market segments include Product Type, Sampling Method, Pollutant Type, End User, Geography.
4. Can you provide details about the market size?
The market size is estimated to be USD 5.5 billion as of 2022.
5. What are some drivers contributing to market growth?
4.; Increasing Awareness and Favorable Government Policies and Non-government Initiatives for Curbing Air Pollution.
6. What are the notable trends driving market growth?
The Outdoor Monitor Segment is Expected to be the Fastest growing Segment.
7. Are there any restraints impacting market growth?
4.; High Costs of Air Quality Monitoring Systems.
8. Can you provide examples of recent developments in the market?
July 2022: Ajman Free Zone established an ambient air quality monitoring system in Gate 2 of its industrial sector in collaboration with the Municipality and Planning Department of Ajman. As part of the project, the free zone implemented cutting-edge AirSense technology to measure and evaluate the industrial area's pollution levels by current international regulations.
9. What pricing options are available for accessing the report?
Pricing options include single-user, multi-user, and enterprise licenses priced at USD 4750, USD 5250, and USD 8750 respectively.
10. Is the market size provided in terms of value or volume?
The market size is provided in terms of value, measured in billion.
11. Are there any specific market keywords associated with the report?
Yes, the market keyword associated with the report is "MEA Air Quality Monitoring Market," which aids in identifying and referencing the specific market segment covered.
12. How do I determine which pricing option suits my needs best?
The pricing options vary based on user requirements and access needs. Individual users may opt for single-user licenses, while businesses requiring broader access may choose multi-user or enterprise licenses for cost-effective access to the report.
13. Are there any additional resources or data provided in the MEA Air Quality Monitoring Market report?
While the report offers comprehensive insights, it's advisable to review the specific contents or supplementary materials provided to ascertain if additional resources or data are available.
14. How can I stay updated on further developments or reports in the MEA Air Quality Monitoring Market?
To stay informed about further developments, trends, and reports in the MEA Air Quality Monitoring Market, consider subscribing to industry newsletters, following relevant companies and organizations, or regularly checking reputable industry news sources and publications.
Methodology
Step 1 - Identification of Relevant Samples Size from Population Database


Step 2 - Approaches for Defining Global Market Size (Value, Volume* & Price*)

Note*: In applicable scenarios
Step 3 - Data Sources
Primary Research
- Web Analytics
- Survey Reports
- Research Institute
- Latest Research Reports
- Opinion Leaders
Secondary Research
- Annual Reports
- White Paper
- Latest Press Release
- Industry Association
- Paid Database
- Investor Presentations

Step 4 - Data Triangulation
Involves using different sources of information in order to increase the validity of a study
These sources are likely to be stakeholders in a program - participants, other researchers, program staff, other community members, and so on.
Then we put all data in single framework & apply various statistical tools to find out the dynamic on the market.
During the analysis stage, feedback from the stakeholder groups would be compared to determine areas of agreement as well as areas of divergence

