

Key Insights
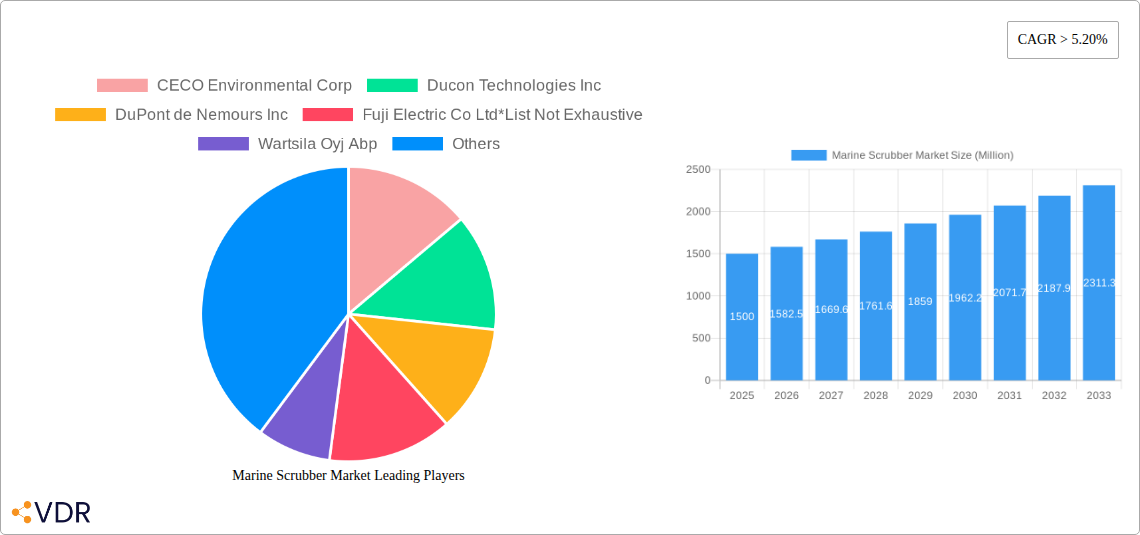
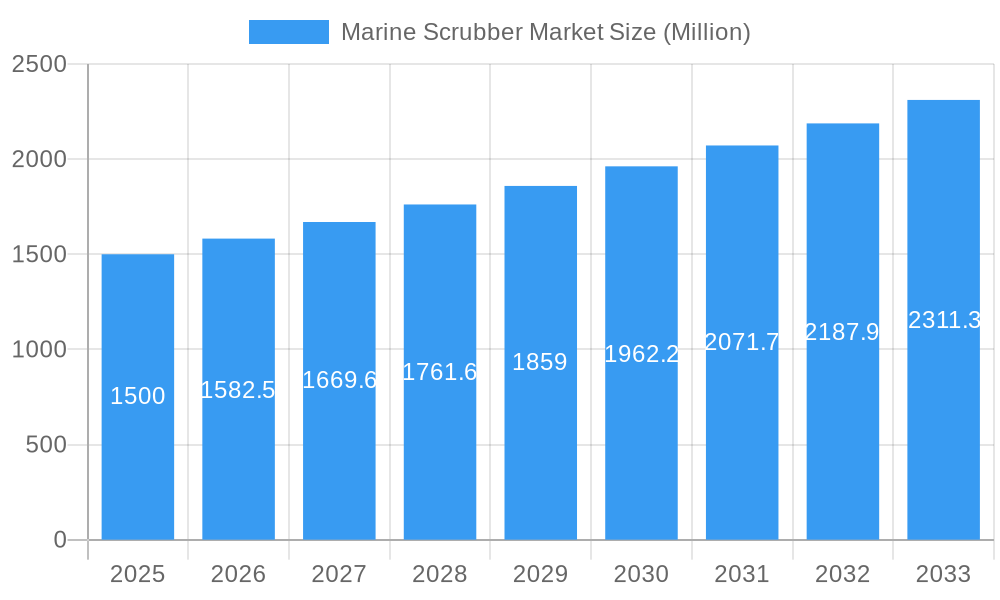
The marine scrubber market, valued at approximately $1.5 billion in 2025, is experiencing robust growth, driven by increasingly stringent environmental regulations aimed at reducing sulfur oxide (SOx) emissions from ships. The International Maritime Organization's (IMO) 2020 sulfur cap, which mandated a significant reduction in allowable sulfur content in marine fuels, acted as a major catalyst for market expansion. This regulation prompted a surge in demand for scrubbers as a cost-effective solution for compliance. Growth is further fueled by the expansion of global shipping traffic, particularly in regions with heavy maritime activity like Asia-Pacific and North America. The market is segmented by scrubber type (wet and dry) and end-user industry, with the oil and gas sector being a significant contributor. While the initial surge in demand might be slowing, consistent growth is projected throughout the forecast period (2025-2033) due to the ongoing need for compliance and the expected increase in vessel construction and retrofitting. The adoption of alternative fuels (LNG, methanol) presents a potential long-term challenge, but the current market remains largely dominated by scrubber technologies.
Marine Scrubber Market Market Size (In Billion)
The market's CAGR of over 5.20% reflects a healthy and sustainable growth trajectory. While the initial investment costs for scrubber installation can be substantial, the long-term operational cost savings associated with using less expensive high-sulfur fuels often outweigh the upfront investment. Furthermore, technological advancements are leading to the development of more efficient and environmentally friendly scrubber designs, mitigating some of the initial concerns regarding operational complexities and potential environmental impacts. Competition among major players like CECO Environmental Corp, Ducon Technologies Inc, and Wartsila Oyj Abp is driving innovation and price optimization, making scrubbers increasingly accessible to a broader range of vessel owners and operators. Regional variations in regulatory enforcement and shipping traffic density will continue to influence market performance in the coming years, with Asia-Pacific and Europe expected to remain key growth areas.
Marine Scrubber Market Company Market Share
Marine Scrubber Market: A Comprehensive Report (2019-2033)
This comprehensive report provides an in-depth analysis of the Marine Scrubber Market, encompassing its dynamics, growth trends, regional dominance, product landscape, key players, and future outlook. The study period covers 2019-2033, with 2025 serving as the base and estimated year. The report segments the market by type (Wet Scrubber, Dry Scrubber) and end-user industry (Oil and Gas, Power Generation, Marine, Pharmaceuticals, Others), offering a granular view of this evolving sector. The total market size in 2025 is estimated at xx Million units.
Marine Scrubber Market Market Dynamics & Structure
This section analyzes the Marine Scrubber market's competitive landscape, technological advancements, regulatory influences, and market consolidation. The market is characterized by a moderately concentrated structure, with key players holding significant market share. However, the entry of new players with innovative technologies is expected to intensify competition in the coming years. Technological innovation, driven by stricter emission regulations and the need for improved efficiency, is a major driver. The regulatory framework, particularly concerning sulfur emissions, significantly impacts market growth. The substitution of older scrubber technologies with more advanced and efficient ones is also a prominent trend.
- Market Concentration: Moderately concentrated, with top 5 players holding approximately xx% market share in 2025.
- Technological Innovation: Focus on energy efficiency, reduced maintenance, and improved emission reduction capabilities.
- Regulatory Framework: Stringent IMO 2020 regulations are the primary driver, with further tightening expected in the future.
- Competitive Substitutes: Alternative emission control technologies, such as LNG fuel switching, pose a competitive challenge.
- M&A Activity: A moderate level of mergers and acquisitions is observed, primarily focused on expanding market reach and technological capabilities. Approximately xx M&A deals were recorded between 2019 and 2024.
- End-User Demographics: The marine industry is the largest end-user segment, followed by power generation and oil & gas.
Marine Scrubber Market Growth Trends & Insights
The Marine Scrubber market witnessed robust expansion during the historical period (2019-2024), primarily propelled by the stringent implementation of International Maritime Organization (IMO) 2020 regulations mandating reduced sulfur emissions. The market size surged significantly, with an estimated increase from [Insert Specific Data Point] Million units in 2019 to [Insert Specific Data Point] Million units in 2024, reflecting a Compound Annual Growth Rate (CAGR) of approximately [Insert Specific CAGR]%. This upward trajectory is projected to persist through the forecast period (2025-2033), albeit at a potentially more moderated yet steady pace. Key contributing factors to this sustained growth include ongoing technological advancements, such as the development of more efficient, compact, and environmentally benign scrubber designs. While market penetration is already substantial within the global shipping industry, further significant growth is anticipated as adoption expands into other marine sectors and as regulations evolve. Evolving consumer behavior, marked by heightened environmental consciousness and a greater emphasis on regulatory compliance, acts as a powerful tailwind for this expanding market. The projected market size by 2033 is estimated to reach [Insert Specific Data Point] Million units, underscoring the market's sustained expansion and increasing importance in maritime emissions control.
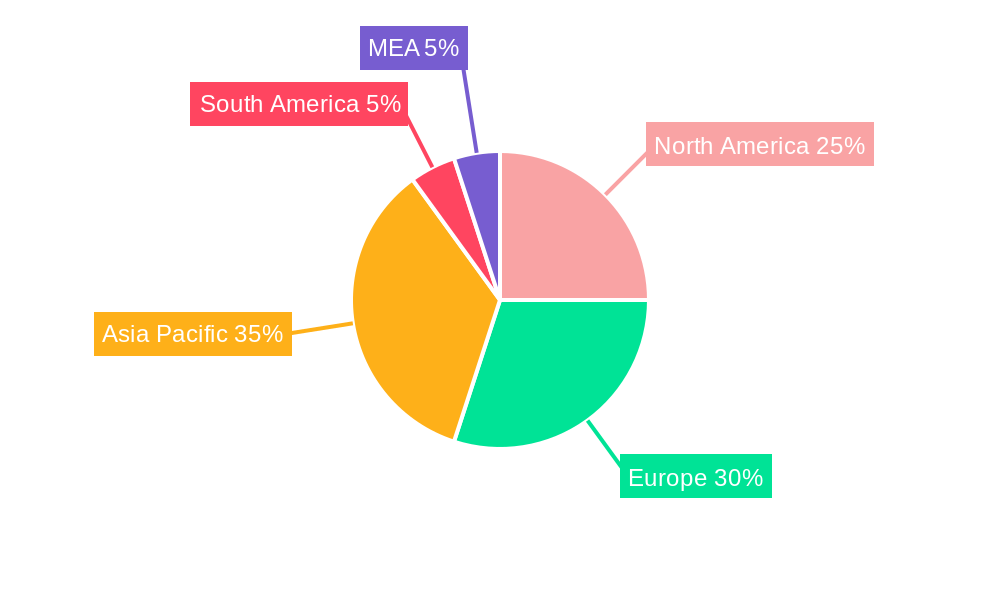
Dominant Regions, Countries, or Segments in Marine Scrubber Market
The marine scrubber market is geographically diverse, with significant growth witnessed across various regions. However, Asia-Pacific holds the largest market share, driven by a significant increase in shipping activity and stringent emission norms. Europe and North America also represent substantial markets, particularly due to mature regulatory environments and environmentally conscious policies.
Key Drivers:
- Asia-Pacific: High shipping activity, increasing infrastructure development, and stringent environmental regulations.
- Europe: Stringent emission regulations, proactive environmental policies, and a well-established maritime industry.
- North America: Growing awareness of environmental concerns and supportive government initiatives.
Dominant Segments:
- Type: Wet scrubbers currently dominate the market due to their maturity and relatively lower cost. However, dry scrubbers are gaining traction due to their space-saving advantages.
- End-user Industry: The marine segment is the largest contributor, followed by power generation.
Marine Scrubber Market Product Landscape
The marine scrubber market is characterized by a diverse array of products designed to cater to varying operational needs and environmental standards. Prominent among these are open-loop scrubbers, which remain a popular choice due to their comparatively lower initial installation costs and simpler operational mechanisms. However, there is a discernible shift towards closed-loop and hybrid scrubber systems, driven by their enhanced environmental performance, ability to handle stricter discharge regulations, and greater operational flexibility. Continuous innovation within the product landscape is centered on boosting operational efficiency, minimizing maintenance requirements, and further mitigating environmental impact. The latest generation of scrubbers are increasingly incorporating sophisticated automation, real-time monitoring capabilities, and advanced control systems to ensure optimal performance, unwavering compliance with emission standards, and a reduced operational footprint.
Key Drivers, Barriers & Challenges in Marine Scrubber Market
Key Drivers:
- Stringent Global Emission Regulations: The foundational driver for the marine scrubber market is the unwavering enforcement of rigorous global emission regulations, most notably IMO 2020, which mandates significant reductions in sulfur oxide (SOx) emissions from vessels.
- Heightened Environmental Awareness: A growing consciousness among shipping companies regarding their environmental responsibility and the long-term sustainability of their operations is significantly boosting the demand for emission control technologies like scrubbers.
- Technological Advancements: Ongoing innovation and research and development efforts are leading to the creation of more efficient, cost-effective, and user-friendly scrubber systems, thereby enhancing their attractiveness to shipowners.
- Economic Viability: In many operational scenarios, the cost savings derived from using cheaper, high-sulfur fuel with a scrubber installed can outweigh the initial investment, making it an economically prudent choice for long-term operations.
Key Challenges & Restraints:
- High Initial Investment Costs: The substantial upfront capital expenditure required for the purchase and installation of scrubber systems, along with ongoing maintenance and operational costs, remains a significant barrier for some operators.
- Environmental Concerns Regarding Wastewater Discharge: For open-loop systems, concerns persist regarding the environmental impact of discharging scrubber washwater into the marine environment, leading to potential regulatory scrutiny and calls for more advanced treatment solutions.
- Competition from Alternative Emission Reduction Technologies: The market faces competition from other emission abatement technologies, including the adoption of low-sulfur fuels, exhaust gas cleaning systems, and alternative fuel solutions like LNG or methanol.
- Supply Chain Volatility: Disruptions in global supply chains, as experienced in recent periods, can significantly impact the availability of critical raw materials and specialized components, leading to production delays and increased costs. This has contributed to an estimated [Insert Specific Percentage]% increase in production costs over the past year.
- Operational Complexity and Retrofitting Challenges: Integrating scrubbers into existing vessel infrastructure (retrofitting) can present complex engineering challenges and downtime, adding to the overall cost and timeline of implementation.
Emerging Opportunities in Marine Scrubber Market
Emerging opportunities lie in the development of advanced scrubber technologies, including those with enhanced efficiency and reduced environmental footprint. The integration of digital technologies, such as AI and IoT, to optimize scrubber operation and maintenance is another promising area. Expanding into untapped markets, such as inland waterways and smaller vessels, offers significant potential. Furthermore, exploring alternative applications of scrubber technology beyond the marine sector could unlock new revenue streams.
Growth Accelerators in the Marine Scrubber Market Industry
Key accelerators driving the expansion of the marine scrubber market include continuous technological innovations, particularly in the realm of advanced wastewater treatment technologies to address discharge concerns and in the development of more integrated and intelligent automation and monitoring systems for enhanced efficiency and compliance. Strategic partnerships and collaborations between leading scrubber manufacturers and major shipping companies are crucial for fostering wider adoption of advanced scrubber systems and for co-developing bespoke solutions. Furthermore, the strategic expansion into emerging maritime markets and the offering of comprehensive, end-to-end service packages encompassing installation, maintenance, and regulatory support can significantly enhance market penetration. The proactive implementation of supportive government incentives, tax benefits, and favorable policy frameworks by maritime authorities can also serve as powerful catalysts, stimulating market growth and encouraging investment in emission control technologies.
Key Players Shaping the Marine Scrubber Market Market
- CECO Environmental Corp
- Ducon Technologies Inc
- DuPont de Nemours Inc
- Fuji Electric Co Ltd
- Wärtsilä Oyj Abp
- GEA Group AG
- Babcock & Wilcox Enterprises Inc
- Andritz AG
- Alfa Laval AB
- Thermax Ltd
Notable Milestones in Marine Scrubber Market Sector
- 2020: Implementation of IMO 2020 sulfur cap significantly boosts market demand.
- 2021: Several key players announce new scrubber technologies with enhanced efficiency.
- 2022: Increased M&A activity as companies consolidate market share.
- 2023: Growing focus on closed-loop and hybrid scrubber systems.
- 2024: Development of scrubbers with integrated AI and IoT capabilities.
In-Depth Marine Scrubber Market Market Outlook
The global Marine Scrubber market is exceptionally well-positioned for sustained and robust growth in the coming years. This optimistic outlook is underpinned by the persistent and increasingly stringent global environmental regulations governing maritime emissions, the relentless pace of technological advancements leading to more efficient and versatile scrubber solutions, and the expanding demand from a diverse range of end-user industries within the maritime sector. Significant opportunities lie in the continued development of next-generation scrubber technologies that offer enhanced environmental performance and cost-effectiveness. Expanding into new geographic markets and establishing strong strategic partnerships with key stakeholders across the maritime value chain will be pivotal in accelerating market penetration. The future success and widespread adoption of efficient and environmentally responsible scrubber systems will, however, be contingent upon effectively addressing the persistent challenges associated with high initial investment costs, mitigating environmental concerns related to washwater discharge, and navigating the competitive landscape of alternative emission reduction technologies. A commitment to continuous innovation, collaborative efforts across the industry, and a proactive approach to regulatory evolution are paramount to ensuring a sustainable and prosperous future for the marine scrubber market.
Marine Scrubber Market Segmentation
-
1. Type
- 1.1. Wet Scrubber
- 1.2. Dry Scrubber
-
2. End-user Industry
- 2.1. Oil and Gas
- 2.2. Power Generation
- 2.3. Marine
- 2.4. Pharmaceuticals
- 2.5. Others
Marine Scrubber Market Segmentation By Geography
- 1. North America
- 2. Europe
- 3. Asia Pacific
- 4. South America
- 5. Middle East and Africa
Marine Scrubber Market Regional Market Share
Geographic Coverage of Marine Scrubber Market
Marine Scrubber Market REPORT HIGHLIGHTS
| Aspects | Details |
|---|---|
| Study Period | 2020-2034 |
| Base Year | 2025 |
| Estimated Year | 2026 |
| Forecast Period | 2026-2034 |
| Historical Period | 2020-2025 |
| Growth Rate | CAGR of 16.3% from 2020-2034 |
| Segmentation |
|
Table of Contents
- 1. Introduction
- 1.1. Research Scope
- 1.2. Market Segmentation
- 1.3. Research Objective
- 1.4. Definitions and Assumptions
- 2. Executive Summary
- 2.1. Market Snapshot
- 3. Market Dynamics
- 3.1. Market Drivers
- 3.2. Market Restrains
- 3.3. Market Trends
- 3.4. Market Opportunities
- 4. Market Factor Analysis
- 4.1. Porters Five Forces
- 4.1.1. Bargaining Power of Suppliers
- 4.1.2. Bargaining Power of Buyers
- 4.1.3. Threat of New Entrants
- 4.1.4. Threat of Substitutes
- 4.1.5. Competitive Rivalry
- 4.2. PESTEL analysis
- 4.3. BCG Analysis
- 4.3.1. Stars (High Growth, High Market Share)
- 4.3.2. Cash Cows (Low Growth, High Market Share)
- 4.3.3. Question Mark (High Growth, Low Market Share)
- 4.3.4. Dogs (Low Growth, Low Market Share)
- 4.4. Ansoff Matrix Analysis
- 4.5. Supply Chain Analysis
- 4.6. Regulatory Landscape
- 4.7. Current Market Potential and Opportunity Assessment (TAM–SAM–SOM Framework)
- 4.8. VDR Analyst Note
- 4.1. Porters Five Forces
- 5. Market Analysis, Insights and Forecast 2021-2033
- 5.1. Market Analysis, Insights and Forecast - by Type
- 5.1.1. Wet Scrubber
- 5.1.2. Dry Scrubber
- 5.2. Market Analysis, Insights and Forecast - by End-user Industry
- 5.2.1. Oil and Gas
- 5.2.2. Power Generation
- 5.2.3. Marine
- 5.2.4. Pharmaceuticals
- 5.2.5. Others
- 5.3. Market Analysis, Insights and Forecast - by Region
- 5.3.1. North America
- 5.3.2. Europe
- 5.3.3. Asia Pacific
- 5.3.4. South America
- 5.3.5. Middle East and Africa
- 5.1. Market Analysis, Insights and Forecast - by Type
- 6. Global Marine Scrubber Market Analysis, Insights and Forecast, 2021-2033
- 6.1. Market Analysis, Insights and Forecast - by Type
- 6.1.1. Wet Scrubber
- 6.1.2. Dry Scrubber
- 6.2. Market Analysis, Insights and Forecast - by End-user Industry
- 6.2.1. Oil and Gas
- 6.2.2. Power Generation
- 6.2.3. Marine
- 6.2.4. Pharmaceuticals
- 6.2.5. Others
- 6.1. Market Analysis, Insights and Forecast - by Type
- 7. North America Marine Scrubber Market Analysis, Insights and Forecast, 2021-2033
- 7.1. Market Analysis, Insights and Forecast - by Type
- 7.1.1. Wet Scrubber
- 7.1.2. Dry Scrubber
- 7.2. Market Analysis, Insights and Forecast - by End-user Industry
- 7.2.1. Oil and Gas
- 7.2.2. Power Generation
- 7.2.3. Marine
- 7.2.4. Pharmaceuticals
- 7.2.5. Others
- 7.1. Market Analysis, Insights and Forecast - by Type
- 8. Europe Marine Scrubber Market Analysis, Insights and Forecast, 2021-2033
- 8.1. Market Analysis, Insights and Forecast - by Type
- 8.1.1. Wet Scrubber
- 8.1.2. Dry Scrubber
- 8.2. Market Analysis, Insights and Forecast - by End-user Industry
- 8.2.1. Oil and Gas
- 8.2.2. Power Generation
- 8.2.3. Marine
- 8.2.4. Pharmaceuticals
- 8.2.5. Others
- 8.1. Market Analysis, Insights and Forecast - by Type
- 9. Asia Pacific Marine Scrubber Market Analysis, Insights and Forecast, 2021-2033
- 9.1. Market Analysis, Insights and Forecast - by Type
- 9.1.1. Wet Scrubber
- 9.1.2. Dry Scrubber
- 9.2. Market Analysis, Insights and Forecast - by End-user Industry
- 9.2.1. Oil and Gas
- 9.2.2. Power Generation
- 9.2.3. Marine
- 9.2.4. Pharmaceuticals
- 9.2.5. Others
- 9.1. Market Analysis, Insights and Forecast - by Type
- 10. South America Marine Scrubber Market Analysis, Insights and Forecast, 2021-2033
- 10.1. Market Analysis, Insights and Forecast - by Type
- 10.1.1. Wet Scrubber
- 10.1.2. Dry Scrubber
- 10.2. Market Analysis, Insights and Forecast - by End-user Industry
- 10.2.1. Oil and Gas
- 10.2.2. Power Generation
- 10.2.3. Marine
- 10.2.4. Pharmaceuticals
- 10.2.5. Others
- 10.1. Market Analysis, Insights and Forecast - by Type
- 11. Middle East and Africa Marine Scrubber Market Analysis, Insights and Forecast, 2021-2033
- 11.1. Market Analysis, Insights and Forecast - by Type
- 11.1.1. Wet Scrubber
- 11.1.2. Dry Scrubber
- 11.2. Market Analysis, Insights and Forecast - by End-user Industry
- 11.2.1. Oil and Gas
- 11.2.2. Power Generation
- 11.2.3. Marine
- 11.2.4. Pharmaceuticals
- 11.2.5. Others
- 11.1. Market Analysis, Insights and Forecast - by Type
- 12. Competitive Analysis
- 12.1. Company Profiles
- 12.1.1 CECO Environmental Corp
- 12.1.1.1. Company Overview
- 12.1.1.2. Products
- 12.1.1.3. Company Financials
- 12.1.1.4. SWOT Analysis
- 12.1.2 Ducon Technologies Inc
- 12.1.2.1. Company Overview
- 12.1.2.2. Products
- 12.1.2.3. Company Financials
- 12.1.2.4. SWOT Analysis
- 12.1.3 DuPont de Nemours Inc
- 12.1.3.1. Company Overview
- 12.1.3.2. Products
- 12.1.3.3. Company Financials
- 12.1.3.4. SWOT Analysis
- 12.1.4 Fuji Electric Co Ltd*List Not Exhaustive
- 12.1.4.1. Company Overview
- 12.1.4.2. Products
- 12.1.4.3. Company Financials
- 12.1.4.4. SWOT Analysis
- 12.1.5 Wartsila Oyj Abp
- 12.1.5.1. Company Overview
- 12.1.5.2. Products
- 12.1.5.3. Company Financials
- 12.1.5.4. SWOT Analysis
- 12.1.6 GEA Group AG
- 12.1.6.1. Company Overview
- 12.1.6.2. Products
- 12.1.6.3. Company Financials
- 12.1.6.4. SWOT Analysis
- 12.1.7 Babcock & Wilcox Enterprises Inc
- 12.1.7.1. Company Overview
- 12.1.7.2. Products
- 12.1.7.3. Company Financials
- 12.1.7.4. SWOT Analysis
- 12.1.8 Andritz AG
- 12.1.8.1. Company Overview
- 12.1.8.2. Products
- 12.1.8.3. Company Financials
- 12.1.8.4. SWOT Analysis
- 12.1.9 Alfa Laval AB
- 12.1.9.1. Company Overview
- 12.1.9.2. Products
- 12.1.9.3. Company Financials
- 12.1.9.4. SWOT Analysis
- 12.1.10 Thermax Ltd
- 12.1.10.1. Company Overview
- 12.1.10.2. Products
- 12.1.10.3. Company Financials
- 12.1.10.4. SWOT Analysis
- 12.1.1 CECO Environmental Corp
- 12.2. Market Entropy
- 12.2.1 Company's Key Areas Served
- 12.2.2 Recent Developments
- 12.3. Company Market Share Analysis 2025
- 12.3.1 Top 5 Companies Market Share Analysis
- 12.3.2 Top 3 Companies Market Share Analysis
- 12.4. List of Potential Customers
- 13. Research Methodology
List of Figures
- Figure 1: Global Marine Scrubber Market Revenue Breakdown (billion, %) by Region 2025 & 2033
- Figure 2: Global Marine Scrubber Market Volume Breakdown (K Units, %) by Region 2025 & 2033
- Figure 3: North America Marine Scrubber Market Revenue (billion), by Type 2025 & 2033
- Figure 4: North America Marine Scrubber Market Volume (K Units), by Type 2025 & 2033
- Figure 5: North America Marine Scrubber Market Revenue Share (%), by Type 2025 & 2033
- Figure 6: North America Marine Scrubber Market Volume Share (%), by Type 2025 & 2033
- Figure 7: North America Marine Scrubber Market Revenue (billion), by End-user Industry 2025 & 2033
- Figure 8: North America Marine Scrubber Market Volume (K Units), by End-user Industry 2025 & 2033
- Figure 9: North America Marine Scrubber Market Revenue Share (%), by End-user Industry 2025 & 2033
- Figure 10: North America Marine Scrubber Market Volume Share (%), by End-user Industry 2025 & 2033
- Figure 11: North America Marine Scrubber Market Revenue (billion), by Country 2025 & 2033
- Figure 12: North America Marine Scrubber Market Volume (K Units), by Country 2025 & 2033
- Figure 13: North America Marine Scrubber Market Revenue Share (%), by Country 2025 & 2033
- Figure 14: North America Marine Scrubber Market Volume Share (%), by Country 2025 & 2033
- Figure 15: Europe Marine Scrubber Market Revenue (billion), by Type 2025 & 2033
- Figure 16: Europe Marine Scrubber Market Volume (K Units), by Type 2025 & 2033
- Figure 17: Europe Marine Scrubber Market Revenue Share (%), by Type 2025 & 2033
- Figure 18: Europe Marine Scrubber Market Volume Share (%), by Type 2025 & 2033
- Figure 19: Europe Marine Scrubber Market Revenue (billion), by End-user Industry 2025 & 2033
- Figure 20: Europe Marine Scrubber Market Volume (K Units), by End-user Industry 2025 & 2033
- Figure 21: Europe Marine Scrubber Market Revenue Share (%), by End-user Industry 2025 & 2033
- Figure 22: Europe Marine Scrubber Market Volume Share (%), by End-user Industry 2025 & 2033
- Figure 23: Europe Marine Scrubber Market Revenue (billion), by Country 2025 & 2033
- Figure 24: Europe Marine Scrubber Market Volume (K Units), by Country 2025 & 2033
- Figure 25: Europe Marine Scrubber Market Revenue Share (%), by Country 2025 & 2033
- Figure 26: Europe Marine Scrubber Market Volume Share (%), by Country 2025 & 2033
- Figure 27: Asia Pacific Marine Scrubber Market Revenue (billion), by Type 2025 & 2033
- Figure 28: Asia Pacific Marine Scrubber Market Volume (K Units), by Type 2025 & 2033
- Figure 29: Asia Pacific Marine Scrubber Market Revenue Share (%), by Type 2025 & 2033
- Figure 30: Asia Pacific Marine Scrubber Market Volume Share (%), by Type 2025 & 2033
- Figure 31: Asia Pacific Marine Scrubber Market Revenue (billion), by End-user Industry 2025 & 2033
- Figure 32: Asia Pacific Marine Scrubber Market Volume (K Units), by End-user Industry 2025 & 2033
- Figure 33: Asia Pacific Marine Scrubber Market Revenue Share (%), by End-user Industry 2025 & 2033
- Figure 34: Asia Pacific Marine Scrubber Market Volume Share (%), by End-user Industry 2025 & 2033
- Figure 35: Asia Pacific Marine Scrubber Market Revenue (billion), by Country 2025 & 2033
- Figure 36: Asia Pacific Marine Scrubber Market Volume (K Units), by Country 2025 & 2033
- Figure 37: Asia Pacific Marine Scrubber Market Revenue Share (%), by Country 2025 & 2033
- Figure 38: Asia Pacific Marine Scrubber Market Volume Share (%), by Country 2025 & 2033
- Figure 39: South America Marine Scrubber Market Revenue (billion), by Type 2025 & 2033
- Figure 40: South America Marine Scrubber Market Volume (K Units), by Type 2025 & 2033
- Figure 41: South America Marine Scrubber Market Revenue Share (%), by Type 2025 & 2033
- Figure 42: South America Marine Scrubber Market Volume Share (%), by Type 2025 & 2033
- Figure 43: South America Marine Scrubber Market Revenue (billion), by End-user Industry 2025 & 2033
- Figure 44: South America Marine Scrubber Market Volume (K Units), by End-user Industry 2025 & 2033
- Figure 45: South America Marine Scrubber Market Revenue Share (%), by End-user Industry 2025 & 2033
- Figure 46: South America Marine Scrubber Market Volume Share (%), by End-user Industry 2025 & 2033
- Figure 47: South America Marine Scrubber Market Revenue (billion), by Country 2025 & 2033
- Figure 48: South America Marine Scrubber Market Volume (K Units), by Country 2025 & 2033
- Figure 49: South America Marine Scrubber Market Revenue Share (%), by Country 2025 & 2033
- Figure 50: South America Marine Scrubber Market Volume Share (%), by Country 2025 & 2033
- Figure 51: Middle East and Africa Marine Scrubber Market Revenue (billion), by Type 2025 & 2033
- Figure 52: Middle East and Africa Marine Scrubber Market Volume (K Units), by Type 2025 & 2033
- Figure 53: Middle East and Africa Marine Scrubber Market Revenue Share (%), by Type 2025 & 2033
- Figure 54: Middle East and Africa Marine Scrubber Market Volume Share (%), by Type 2025 & 2033
- Figure 55: Middle East and Africa Marine Scrubber Market Revenue (billion), by End-user Industry 2025 & 2033
- Figure 56: Middle East and Africa Marine Scrubber Market Volume (K Units), by End-user Industry 2025 & 2033
- Figure 57: Middle East and Africa Marine Scrubber Market Revenue Share (%), by End-user Industry 2025 & 2033
- Figure 58: Middle East and Africa Marine Scrubber Market Volume Share (%), by End-user Industry 2025 & 2033
- Figure 59: Middle East and Africa Marine Scrubber Market Revenue (billion), by Country 2025 & 2033
- Figure 60: Middle East and Africa Marine Scrubber Market Volume (K Units), by Country 2025 & 2033
- Figure 61: Middle East and Africa Marine Scrubber Market Revenue Share (%), by Country 2025 & 2033
- Figure 62: Middle East and Africa Marine Scrubber Market Volume Share (%), by Country 2025 & 2033
List of Tables
- Table 1: Global Marine Scrubber Market Revenue billion Forecast, by Type 2020 & 2033
- Table 2: Global Marine Scrubber Market Volume K Units Forecast, by Type 2020 & 2033
- Table 3: Global Marine Scrubber Market Revenue billion Forecast, by End-user Industry 2020 & 2033
- Table 4: Global Marine Scrubber Market Volume K Units Forecast, by End-user Industry 2020 & 2033
- Table 5: Global Marine Scrubber Market Revenue billion Forecast, by Region 2020 & 2033
- Table 6: Global Marine Scrubber Market Volume K Units Forecast, by Region 2020 & 2033
- Table 7: Global Marine Scrubber Market Revenue billion Forecast, by Type 2020 & 2033
- Table 8: Global Marine Scrubber Market Volume K Units Forecast, by Type 2020 & 2033
- Table 9: Global Marine Scrubber Market Revenue billion Forecast, by End-user Industry 2020 & 2033
- Table 10: Global Marine Scrubber Market Volume K Units Forecast, by End-user Industry 2020 & 2033
- Table 11: Global Marine Scrubber Market Revenue billion Forecast, by Country 2020 & 2033
- Table 12: Global Marine Scrubber Market Volume K Units Forecast, by Country 2020 & 2033
- Table 13: Global Marine Scrubber Market Revenue billion Forecast, by Type 2020 & 2033
- Table 14: Global Marine Scrubber Market Volume K Units Forecast, by Type 2020 & 2033
- Table 15: Global Marine Scrubber Market Revenue billion Forecast, by End-user Industry 2020 & 2033
- Table 16: Global Marine Scrubber Market Volume K Units Forecast, by End-user Industry 2020 & 2033
- Table 17: Global Marine Scrubber Market Revenue billion Forecast, by Country 2020 & 2033
- Table 18: Global Marine Scrubber Market Volume K Units Forecast, by Country 2020 & 2033
- Table 19: Global Marine Scrubber Market Revenue billion Forecast, by Type 2020 & 2033
- Table 20: Global Marine Scrubber Market Volume K Units Forecast, by Type 2020 & 2033
- Table 21: Global Marine Scrubber Market Revenue billion Forecast, by End-user Industry 2020 & 2033
- Table 22: Global Marine Scrubber Market Volume K Units Forecast, by End-user Industry 2020 & 2033
- Table 23: Global Marine Scrubber Market Revenue billion Forecast, by Country 2020 & 2033
- Table 24: Global Marine Scrubber Market Volume K Units Forecast, by Country 2020 & 2033
- Table 25: Global Marine Scrubber Market Revenue billion Forecast, by Type 2020 & 2033
- Table 26: Global Marine Scrubber Market Volume K Units Forecast, by Type 2020 & 2033
- Table 27: Global Marine Scrubber Market Revenue billion Forecast, by End-user Industry 2020 & 2033
- Table 28: Global Marine Scrubber Market Volume K Units Forecast, by End-user Industry 2020 & 2033
- Table 29: Global Marine Scrubber Market Revenue billion Forecast, by Country 2020 & 2033
- Table 30: Global Marine Scrubber Market Volume K Units Forecast, by Country 2020 & 2033
- Table 31: Global Marine Scrubber Market Revenue billion Forecast, by Type 2020 & 2033
- Table 32: Global Marine Scrubber Market Volume K Units Forecast, by Type 2020 & 2033
- Table 33: Global Marine Scrubber Market Revenue billion Forecast, by End-user Industry 2020 & 2033
- Table 34: Global Marine Scrubber Market Volume K Units Forecast, by End-user Industry 2020 & 2033
- Table 35: Global Marine Scrubber Market Revenue billion Forecast, by Country 2020 & 2033
- Table 36: Global Marine Scrubber Market Volume K Units Forecast, by Country 2020 & 2033
Frequently Asked Questions
1. What is the projected Compound Annual Growth Rate (CAGR) of the Marine Scrubber Market?
The projected CAGR is approximately 16.3%.
2. Which companies are prominent players in the Marine Scrubber Market?
Key companies in the market include CECO Environmental Corp, Ducon Technologies Inc, DuPont de Nemours Inc, Fuji Electric Co Ltd*List Not Exhaustive, Wartsila Oyj Abp, GEA Group AG, Babcock & Wilcox Enterprises Inc, Andritz AG, Alfa Laval AB, Thermax Ltd.
3. What are the main segments of the Marine Scrubber Market?
The market segments include Type, End-user Industry.
4. Can you provide details about the market size?
The market size is estimated to be USD 8.65 billion as of 2022.
5. What are some drivers contributing to market growth?
4.; The High Amount of Waste Generation in the Country4.; The growing Focus on Non-Fossil Fuel Sources.
6. What are the notable trends driving market growth?
Cement Industry to Witness the Fastest Growth.
7. Are there any restraints impacting market growth?
4.; The Recycling Rate of Waste in Germany.
8. Can you provide examples of recent developments in the market?
N/A
9. What pricing options are available for accessing the report?
Pricing options include single-user, multi-user, and enterprise licenses priced at USD 4750, USD 5250, and USD 8750 respectively.
10. Is the market size provided in terms of value or volume?
The market size is provided in terms of value, measured in billion and volume, measured in K Units.
11. Are there any specific market keywords associated with the report?
Yes, the market keyword associated with the report is "Marine Scrubber Market," which aids in identifying and referencing the specific market segment covered.
12. How do I determine which pricing option suits my needs best?
The pricing options vary based on user requirements and access needs. Individual users may opt for single-user licenses, while businesses requiring broader access may choose multi-user or enterprise licenses for cost-effective access to the report.
13. Are there any additional resources or data provided in the Marine Scrubber Market report?
While the report offers comprehensive insights, it's advisable to review the specific contents or supplementary materials provided to ascertain if additional resources or data are available.
14. How can I stay updated on further developments or reports in the Marine Scrubber Market?
To stay informed about further developments, trends, and reports in the Marine Scrubber Market, consider subscribing to industry newsletters, following relevant companies and organizations, or regularly checking reputable industry news sources and publications.
Methodology
Step 1 - Identification of Relevant Samples Size from Population Database


Step 2 - Approaches for Defining Global Market Size (Value, Volume* & Price*)

Note*: In applicable scenarios
Step 3 - Data Sources
Primary Research
- Web Analytics
- Survey Reports
- Research Institute
- Latest Research Reports
- Opinion Leaders
Secondary Research
- Annual Reports
- White Paper
- Latest Press Release
- Industry Association
- Paid Database
- Investor Presentations

Step 4 - Data Triangulation
Involves using different sources of information in order to increase the validity of a study
These sources are likely to be stakeholders in a program - participants, other researchers, program staff, other community members, and so on.
Then we put all data in single framework & apply various statistical tools to find out the dynamic on the market.
During the analysis stage, feedback from the stakeholder groups would be compared to determine areas of agreement as well as areas of divergence