

Key Insights
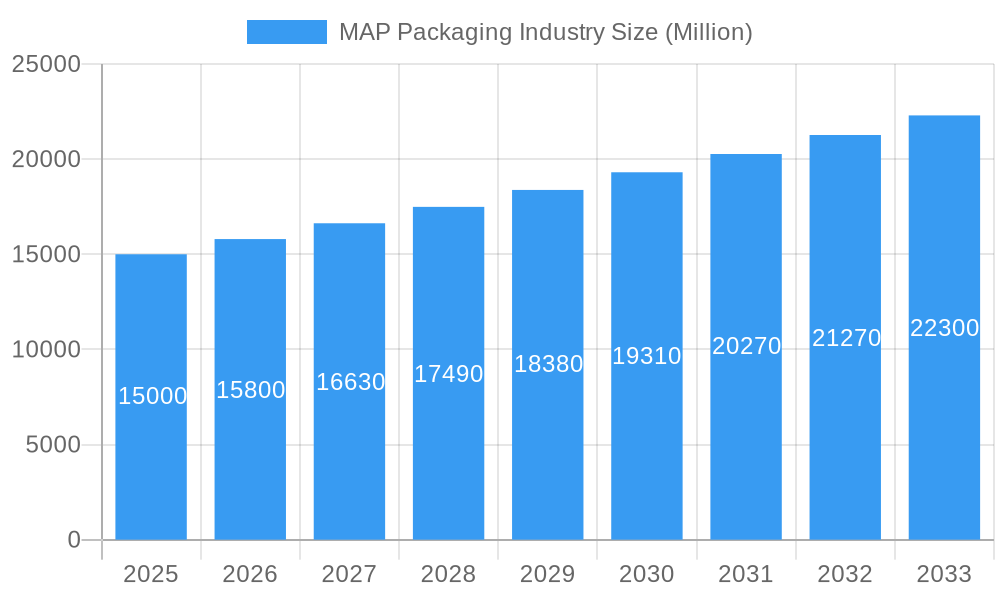
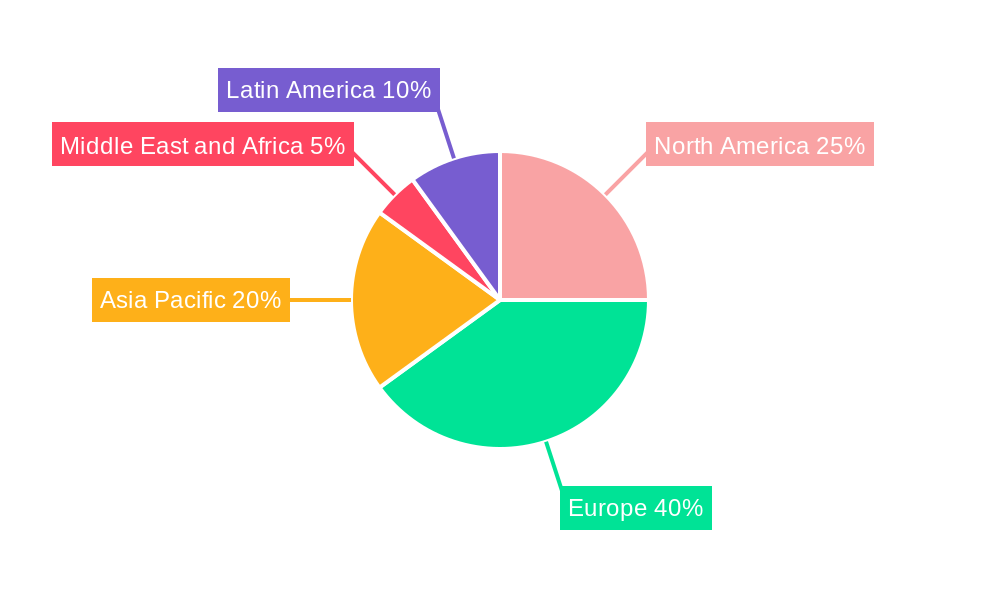
The Modified Atmosphere Packaging (MAP) market is experiencing robust growth, driven by increasing consumer demand for extended shelf life and improved food quality. The market's 5.30% CAGR signifies a consistent upward trajectory, projected to reach a substantial value by 2033. Key drivers include the rising popularity of ready-to-eat meals, the growth of the e-commerce food sector necessitating extended product freshness during transit, and a growing awareness among consumers about food waste reduction. The European region, specifically the UK, Germany, France, and Italy, represents a significant market share due to established food processing industries and stringent food safety regulations. Within the packaging material segment, Polypropylene (PP) and Polyvinylchloride (PVC) hold a dominant position due to their cost-effectiveness and barrier properties. However, increasing concerns regarding the environmental impact of certain plastics are driving demand for sustainable alternatives like biodegradable materials, presenting both a challenge and an opportunity for market players. The application segment shows strong growth across poultry, seafood & meat products, fruits & vegetables, and bakery & confectionery, reflecting the versatility of MAP technology in preserving diverse food types. Leading companies like SEALPAC, Linde AG, and Amcor Plc are strategically investing in innovation and expansion to capitalize on this expanding market.
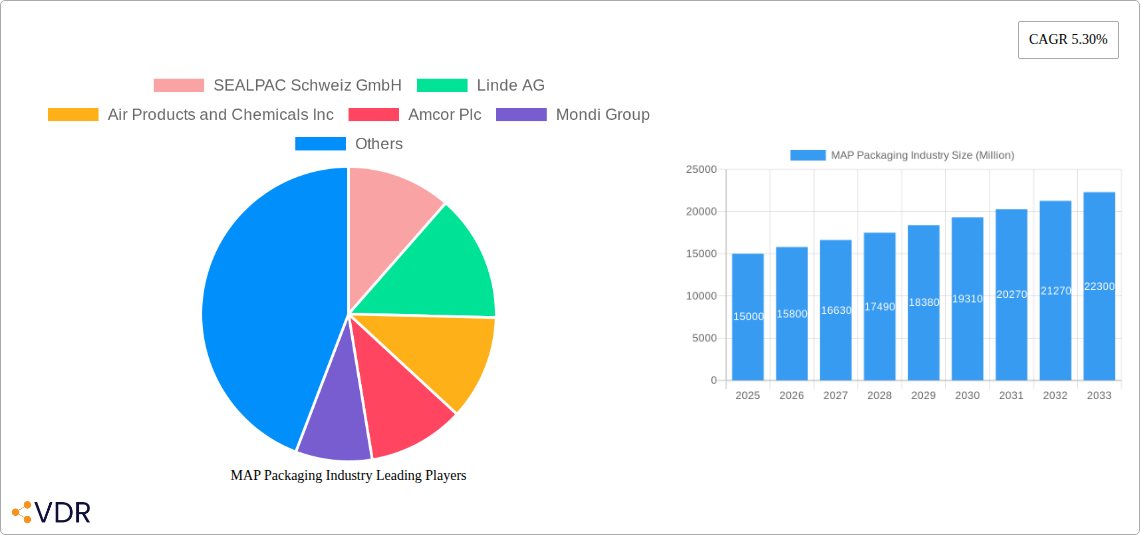
MAP Packaging Industry Market Size (In Billion)
The competitive landscape is marked by both large multinational corporations and specialized packaging solution providers. Strategic partnerships and acquisitions are common strategies to expand market reach and product portfolios. While the market faces restraints such as fluctuating raw material prices and potential regulatory changes related to packaging sustainability, the overall outlook remains positive due to the strong consumer preference for convenient, high-quality, and less wasteful food products. This trend is expected to further drive the adoption of MAP across various food categories and geographic regions, resulting in consistent market expansion throughout the forecast period. Further research into sustainable packaging solutions and advancements in packaging technology will significantly influence future market growth and innovation.
MAP Packaging Industry Company Market Share
MAP Packaging Industry Market Report: 2019-2033
This comprehensive report provides a detailed analysis of the MAP (Modified Atmosphere Packaging) industry, offering invaluable insights for industry professionals, investors, and strategic decision-makers. The report covers the period 2019-2033, with a focus on the 2025-2033 forecast period and utilizing 2025 as the base year. The analysis encompasses key market segments including country (United Kingdom, Germany, France, Italy, Rest of Europe), packaging gas type (Oxygen, Nitrogen, Carbon Dioxide, Other Gases), type of packaging material (Polypropylene (PP), Polyvinylchloride (PVC), Low-Density Polyethylene (LDPE), Other Materials), and application (Poultry, Seafood, & Meat Products, Fruits & Vegetables, Bakery & Confectionery, Other Applications). Key players such as SEALPAC Schweiz GmbH, Linde AG, Air Products and Chemicals Inc, Amcor Plc, Mondi Group, Syntegon Technology GmbH, Barry-Wehmiller Companies, ULMA Packaging, CV-Tek, and Sealed Air Corporation are profiled, although the list is not exhaustive. The total market size is projected to reach xx Million units by 2033.
MAP Packaging Industry Market Dynamics & Structure
The MAP packaging market is characterized by moderate concentration, with a few dominant players holding significant market share. Technological innovation, particularly in barrier film materials and gas mixing technologies, is a key driver. Stringent regulatory frameworks concerning food safety and sustainability influence packaging choices. Competitive pressure from alternative packaging methods, such as vacuum packaging, exists, but MAP's advantages in extending shelf life and maintaining product quality ensure its continued relevance. End-user demographics, particularly the growing demand for convenience foods and fresh produce, bolster market growth. M&A activity in the sector has been steady, with xx deals recorded between 2019 and 2024, primarily focused on consolidating market share and expanding geographic reach.
- Market Concentration: Moderately concentrated, with top 5 players holding approximately xx% market share in 2025.
- Technological Innovation: Focus on improved barrier films, smart packaging solutions, and efficient gas mixing systems.
- Regulatory Landscape: Stringent food safety regulations and increasing focus on sustainable packaging materials.
- Competitive Landscape: Competition from vacuum packaging and other preservation methods.
- M&A Activity: xx deals recorded between 2019 and 2024, primarily driven by consolidation and expansion.
MAP Packaging Industry Growth Trends & Insights
The MAP packaging market has experienced steady growth over the historical period (2019-2024), with a CAGR of xx%. This growth is fueled by increasing demand for fresh and processed foods, alongside a heightened focus on minimizing food waste and extending product shelf life. Technological advancements, such as active and intelligent packaging, further contribute to market expansion. Consumer preferences are shifting towards convenient, longer-lasting food products, which directly benefits the MAP packaging segment. Adoption rates are increasing steadily across various food categories, particularly in poultry, seafood, and prepared meals. Technological disruptions, such as the introduction of biodegradable and compostable MAP packaging options, are shaping the future of the industry. Market penetration is expected to reach xx% by 2033.
Dominant Regions, Countries, or Segments in MAP Packaging Industry
Western Europe dominates the MAP packaging market, driven by high per capita consumption of packaged foods, advanced food processing infrastructure, and stringent food safety regulations. Within this region, Germany and the United Kingdom are the leading markets, accounting for a combined xx% market share in 2025. Nitrogen is the most widely used packaging gas, owing to its inert properties and effectiveness in maintaining product freshness. Polypropylene (PP) is the dominant packaging material due to its cost-effectiveness, barrier properties, and recyclability. The Poultry, Seafood, & Meat Products segment represents the largest application area for MAP packaging.
- Key Drivers: High demand for convenient food, stringent food safety regulations, robust food processing infrastructure.
- Germany & UK Dominance: Large food processing industries, high consumer spending on packaged goods, and favorable regulatory environment.
- Nitrogen Gas Dominance: Effective in extending shelf life and maintaining product quality.
- Polypropylene (PP) Material Dominance: Cost-effective, versatile, and possesses good barrier properties.
- Poultry, Seafood & Meat Segment Leadership: High susceptibility to spoilage and the need for extended shelf life.
MAP Packaging Industry Product Landscape
Innovations in MAP packaging focus on enhancing barrier properties, incorporating active and intelligent features, and improving sustainability. New materials like biodegradable polymers and recycled content are gaining traction. Active packaging technologies, such as oxygen scavengers, extend shelf life further. Performance metrics are increasingly focused on minimizing environmental impact while maintaining product quality and safety. Unique selling propositions include enhanced shelf life, improved product presentation, and reduced food waste. Technological advancements contribute to improved barrier properties, enhanced gas exchange control, and easier integration into existing packaging lines.
Key Drivers, Barriers & Challenges in MAP Packaging Industry
Key Drivers: Increasing demand for extended shelf life products, growing consumer preference for convenience foods, stringent food safety regulations, and technological advancements. The rising prevalence of e-commerce and food delivery services necessitates robust packaging solutions like MAP.
Key Challenges: Fluctuating raw material costs, regulatory hurdles surrounding the use of certain gases and materials, competition from alternative packaging methods, and the complexity of integrating MAP into existing packaging lines. Supply chain disruptions pose further challenges, impacting material availability and costs. The predicted impact of these challenges on market growth is xx% reduction in CAGR by 2033.
Emerging Opportunities in MAP Packaging Industry
Emerging opportunities lie in the development of sustainable and eco-friendly MAP packaging solutions, such as biodegradable and compostable materials. Untapped markets in developing economies offer substantial growth potential. Innovative applications, such as MAP packaging for ready-to-eat meals and pharmaceuticals, are emerging. Evolving consumer preferences towards healthier and more convenient foods create further opportunities for the industry.
Growth Accelerators in the MAP Packaging Industry
Long-term growth will be driven by advancements in active and intelligent packaging technologies, leading to improved shelf life and reduced food waste. Strategic partnerships between packaging material suppliers, gas providers, and food producers can accelerate innovation and market penetration. Expansion into new geographical markets, particularly in developing regions, presents significant growth opportunities.
Key Players Shaping the MAP Packaging Industry Market
- SEALPAC Schweiz GmbH
- Linde AG
- Air Products and Chemicals Inc
- Amcor Plc
- Mondi Group
- Syntegon Technology GmbH
- Barry-Wehmiller Companies
- ULMA Packaging
- CV-Tek
- Sealed Air Corporation
Notable Milestones in MAP Packaging Industry Sector
- 2020: Introduction of a new biodegradable MAP packaging material by Amcor Plc.
- 2021: Merger between two key players in the MAP packaging gas supply chain, leading to increased market consolidation.
- 2022: Launch of a novel active packaging technology that further extends shelf life by xx%.
- 2023: Implementation of stricter regulations regarding the use of certain gases in MAP packaging in the EU.
- 2024: Significant investment in R&D focused on sustainable MAP packaging solutions by several key players.
In-Depth MAP Packaging Industry Market Outlook
The future of the MAP packaging industry is bright, fueled by continued innovation in sustainable packaging materials, advancements in gas mixing technologies, and expansion into new applications and geographical markets. Strategic partnerships and investments in R&D will play a crucial role in driving long-term growth. The market is poised for significant expansion, with opportunities for companies that prioritize sustainability, innovation, and efficient supply chain management. The market is projected to achieve xx Million units by 2033.
MAP Packaging Industry Segmentation
-
1. Packaging Gas Type
- 1.1. Oxygen
- 1.2. Nitrogen
- 1.3. Carbon Dioxide
- 1.4. Other Gases
-
2. Type of Packaging Material
- 2.1. Polypropylene (PP)
- 2.2. Polyvinylchloride (PVC)
- 2.3. Low-Density Polyethylene (LDPE)
- 2.4. Other Materials
-
3. Application
- 3.1. Poultry, Seafood, & Meat Products
- 3.2. Fruits & Vegetables
- 3.3. Bakery & Confectionery
- 3.4. Other Applications
MAP Packaging Industry Segmentation By Geography
-
1. North America
- 1.1. United States
- 1.2. Canada
- 1.3. Mexico
-
2. South America
- 2.1. Brazil
- 2.2. Argentina
- 2.3. Rest of South America
-
3. Europe
- 3.1. United Kingdom
- 3.2. Germany
- 3.3. France
- 3.4. Italy
- 3.5. Spain
- 3.6. Russia
- 3.7. Benelux
- 3.8. Nordics
- 3.9. Rest of Europe
-
4. Middle East & Africa
- 4.1. Turkey
- 4.2. Israel
- 4.3. GCC
- 4.4. North Africa
- 4.5. South Africa
- 4.6. Rest of Middle East & Africa
-
5. Asia Pacific
- 5.1. China
- 5.2. India
- 5.3. Japan
- 5.4. South Korea
- 5.5. ASEAN
- 5.6. Oceania
- 5.7. Rest of Asia Pacific
MAP Packaging Industry Regional Market Share
Geographic Coverage of MAP Packaging Industry
MAP Packaging Industry REPORT HIGHLIGHTS
| Aspects | Details |
|---|---|
| Study Period | 2020-2034 |
| Base Year | 2025 |
| Estimated Year | 2026 |
| Forecast Period | 2026-2034 |
| Historical Period | 2020-2025 |
| Growth Rate | CAGR of 5.30% from 2020-2034 |
| Segmentation |
|
Table of Contents
- 1. Introduction
- 1.1. Research Scope
- 1.2. Market Segmentation
- 1.3. Research Objective
- 1.4. Definitions and Assumptions
- 2. Executive Summary
- 2.1. Market Snapshot
- 3. Market Dynamics
- 3.1. Market Drivers
- 3.2. Market Restrains
- 3.3. Market Trends
- 3.4. Market Opportunities
- 4. Market Factor Analysis
- 4.1. Porters Five Forces
- 4.1.1. Bargaining Power of Suppliers
- 4.1.2. Bargaining Power of Buyers
- 4.1.3. Threat of New Entrants
- 4.1.4. Threat of Substitutes
- 4.1.5. Competitive Rivalry
- 4.2. PESTEL analysis
- 4.3. BCG Analysis
- 4.3.1. Stars (High Growth, High Market Share)
- 4.3.2. Cash Cows (Low Growth, High Market Share)
- 4.3.3. Question Mark (High Growth, Low Market Share)
- 4.3.4. Dogs (Low Growth, Low Market Share)
- 4.4. Ansoff Matrix Analysis
- 4.5. Supply Chain Analysis
- 4.6. Regulatory Landscape
- 4.7. Current Market Potential and Opportunity Assessment (TAM–SAM–SOM Framework)
- 4.8. VDR Analyst Note
- 4.1. Porters Five Forces
- 5. Market Analysis, Insights and Forecast 2021-2033
- 5.1. Market Analysis, Insights and Forecast - by Packaging Gas Type
- 5.1.1. Oxygen
- 5.1.2. Nitrogen
- 5.1.3. Carbon Dioxide
- 5.1.4. Other Gases
- 5.2. Market Analysis, Insights and Forecast - by Type of Packaging Material
- 5.2.1. Polypropylene (PP)
- 5.2.2. Polyvinylchloride (PVC)
- 5.2.3. Low-Density Polyethylene (LDPE)
- 5.2.4. Other Materials
- 5.3. Market Analysis, Insights and Forecast - by Application
- 5.3.1. Poultry, Seafood, & Meat Products
- 5.3.2. Fruits & Vegetables
- 5.3.3. Bakery & Confectionery
- 5.3.4. Other Applications
- 5.4. Market Analysis, Insights and Forecast - by Region
- 5.4.1. North America
- 5.4.2. South America
- 5.4.3. Europe
- 5.4.4. Middle East & Africa
- 5.4.5. Asia Pacific
- 5.1. Market Analysis, Insights and Forecast - by Packaging Gas Type
- 6. Global MAP Packaging Industry Analysis, Insights and Forecast, 2021-2033
- 6.1. Market Analysis, Insights and Forecast - by Packaging Gas Type
- 6.1.1. Oxygen
- 6.1.2. Nitrogen
- 6.1.3. Carbon Dioxide
- 6.1.4. Other Gases
- 6.2. Market Analysis, Insights and Forecast - by Type of Packaging Material
- 6.2.1. Polypropylene (PP)
- 6.2.2. Polyvinylchloride (PVC)
- 6.2.3. Low-Density Polyethylene (LDPE)
- 6.2.4. Other Materials
- 6.3. Market Analysis, Insights and Forecast - by Application
- 6.3.1. Poultry, Seafood, & Meat Products
- 6.3.2. Fruits & Vegetables
- 6.3.3. Bakery & Confectionery
- 6.3.4. Other Applications
- 6.1. Market Analysis, Insights and Forecast - by Packaging Gas Type
- 7. North America MAP Packaging Industry Analysis, Insights and Forecast, 2021-2033
- 7.1. Market Analysis, Insights and Forecast - by Packaging Gas Type
- 7.1.1. Oxygen
- 7.1.2. Nitrogen
- 7.1.3. Carbon Dioxide
- 7.1.4. Other Gases
- 7.2. Market Analysis, Insights and Forecast - by Type of Packaging Material
- 7.2.1. Polypropylene (PP)
- 7.2.2. Polyvinylchloride (PVC)
- 7.2.3. Low-Density Polyethylene (LDPE)
- 7.2.4. Other Materials
- 7.3. Market Analysis, Insights and Forecast - by Application
- 7.3.1. Poultry, Seafood, & Meat Products
- 7.3.2. Fruits & Vegetables
- 7.3.3. Bakery & Confectionery
- 7.3.4. Other Applications
- 7.1. Market Analysis, Insights and Forecast - by Packaging Gas Type
- 8. South America MAP Packaging Industry Analysis, Insights and Forecast, 2021-2033
- 8.1. Market Analysis, Insights and Forecast - by Packaging Gas Type
- 8.1.1. Oxygen
- 8.1.2. Nitrogen
- 8.1.3. Carbon Dioxide
- 8.1.4. Other Gases
- 8.2. Market Analysis, Insights and Forecast - by Type of Packaging Material
- 8.2.1. Polypropylene (PP)
- 8.2.2. Polyvinylchloride (PVC)
- 8.2.3. Low-Density Polyethylene (LDPE)
- 8.2.4. Other Materials
- 8.3. Market Analysis, Insights and Forecast - by Application
- 8.3.1. Poultry, Seafood, & Meat Products
- 8.3.2. Fruits & Vegetables
- 8.3.3. Bakery & Confectionery
- 8.3.4. Other Applications
- 8.1. Market Analysis, Insights and Forecast - by Packaging Gas Type
- 9. Europe MAP Packaging Industry Analysis, Insights and Forecast, 2021-2033
- 9.1. Market Analysis, Insights and Forecast - by Packaging Gas Type
- 9.1.1. Oxygen
- 9.1.2. Nitrogen
- 9.1.3. Carbon Dioxide
- 9.1.4. Other Gases
- 9.2. Market Analysis, Insights and Forecast - by Type of Packaging Material
- 9.2.1. Polypropylene (PP)
- 9.2.2. Polyvinylchloride (PVC)
- 9.2.3. Low-Density Polyethylene (LDPE)
- 9.2.4. Other Materials
- 9.3. Market Analysis, Insights and Forecast - by Application
- 9.3.1. Poultry, Seafood, & Meat Products
- 9.3.2. Fruits & Vegetables
- 9.3.3. Bakery & Confectionery
- 9.3.4. Other Applications
- 9.1. Market Analysis, Insights and Forecast - by Packaging Gas Type
- 10. Middle East & Africa MAP Packaging Industry Analysis, Insights and Forecast, 2021-2033
- 10.1. Market Analysis, Insights and Forecast - by Packaging Gas Type
- 10.1.1. Oxygen
- 10.1.2. Nitrogen
- 10.1.3. Carbon Dioxide
- 10.1.4. Other Gases
- 10.2. Market Analysis, Insights and Forecast - by Type of Packaging Material
- 10.2.1. Polypropylene (PP)
- 10.2.2. Polyvinylchloride (PVC)
- 10.2.3. Low-Density Polyethylene (LDPE)
- 10.2.4. Other Materials
- 10.3. Market Analysis, Insights and Forecast - by Application
- 10.3.1. Poultry, Seafood, & Meat Products
- 10.3.2. Fruits & Vegetables
- 10.3.3. Bakery & Confectionery
- 10.3.4. Other Applications
- 10.1. Market Analysis, Insights and Forecast - by Packaging Gas Type
- 11. Asia Pacific MAP Packaging Industry Analysis, Insights and Forecast, 2021-2033
- 11.1. Market Analysis, Insights and Forecast - by Packaging Gas Type
- 11.1.1. Oxygen
- 11.1.2. Nitrogen
- 11.1.3. Carbon Dioxide
- 11.1.4. Other Gases
- 11.2. Market Analysis, Insights and Forecast - by Type of Packaging Material
- 11.2.1. Polypropylene (PP)
- 11.2.2. Polyvinylchloride (PVC)
- 11.2.3. Low-Density Polyethylene (LDPE)
- 11.2.4. Other Materials
- 11.3. Market Analysis, Insights and Forecast - by Application
- 11.3.1. Poultry, Seafood, & Meat Products
- 11.3.2. Fruits & Vegetables
- 11.3.3. Bakery & Confectionery
- 11.3.4. Other Applications
- 11.1. Market Analysis, Insights and Forecast - by Packaging Gas Type
- 12. Competitive Analysis
- 12.1. Company Profiles
- 12.1.1 SEALPAC Schweiz GmbH
- 12.1.1.1. Company Overview
- 12.1.1.2. Products
- 12.1.1.3. Company Financials
- 12.1.1.4. SWOT Analysis
- 12.1.2 Linde AG
- 12.1.2.1. Company Overview
- 12.1.2.2. Products
- 12.1.2.3. Company Financials
- 12.1.2.4. SWOT Analysis
- 12.1.3 Air Products and Chemicals Inc
- 12.1.3.1. Company Overview
- 12.1.3.2. Products
- 12.1.3.3. Company Financials
- 12.1.3.4. SWOT Analysis
- 12.1.4 Amcor Plc
- 12.1.4.1. Company Overview
- 12.1.4.2. Products
- 12.1.4.3. Company Financials
- 12.1.4.4. SWOT Analysis
- 12.1.5 Mondi Group
- 12.1.5.1. Company Overview
- 12.1.5.2. Products
- 12.1.5.3. Company Financials
- 12.1.5.4. SWOT Analysis
- 12.1.6 Syntegon Technology GmbH*List Not Exhaustive
- 12.1.6.1. Company Overview
- 12.1.6.2. Products
- 12.1.6.3. Company Financials
- 12.1.6.4. SWOT Analysis
- 12.1.7 Barry-Wehmiller Companies
- 12.1.7.1. Company Overview
- 12.1.7.2. Products
- 12.1.7.3. Company Financials
- 12.1.7.4. SWOT Analysis
- 12.1.8 ULMA Packaging
- 12.1.8.1. Company Overview
- 12.1.8.2. Products
- 12.1.8.3. Company Financials
- 12.1.8.4. SWOT Analysis
- 12.1.9 CV-Tek
- 12.1.9.1. Company Overview
- 12.1.9.2. Products
- 12.1.9.3. Company Financials
- 12.1.9.4. SWOT Analysis
- 12.1.10 Sealed Air Corporation
- 12.1.10.1. Company Overview
- 12.1.10.2. Products
- 12.1.10.3. Company Financials
- 12.1.10.4. SWOT Analysis
- 12.1.1 SEALPAC Schweiz GmbH
- 12.2. Market Entropy
- 12.2.1 Company's Key Areas Served
- 12.2.2 Recent Developments
- 12.3. Company Market Share Analysis 2025
- 12.3.1 Top 5 Companies Market Share Analysis
- 12.3.2 Top 3 Companies Market Share Analysis
- 12.4. List of Potential Customers
- 13. Research Methodology
List of Figures
- Figure 1: Global MAP Packaging Industry Revenue Breakdown (Million, %) by Region 2025 & 2033
- Figure 2: North America MAP Packaging Industry Revenue (Million), by Packaging Gas Type 2025 & 2033
- Figure 3: North America MAP Packaging Industry Revenue Share (%), by Packaging Gas Type 2025 & 2033
- Figure 4: North America MAP Packaging Industry Revenue (Million), by Type of Packaging Material 2025 & 2033
- Figure 5: North America MAP Packaging Industry Revenue Share (%), by Type of Packaging Material 2025 & 2033
- Figure 6: North America MAP Packaging Industry Revenue (Million), by Application 2025 & 2033
- Figure 7: North America MAP Packaging Industry Revenue Share (%), by Application 2025 & 2033
- Figure 8: North America MAP Packaging Industry Revenue (Million), by Country 2025 & 2033
- Figure 9: North America MAP Packaging Industry Revenue Share (%), by Country 2025 & 2033
- Figure 10: South America MAP Packaging Industry Revenue (Million), by Packaging Gas Type 2025 & 2033
- Figure 11: South America MAP Packaging Industry Revenue Share (%), by Packaging Gas Type 2025 & 2033
- Figure 12: South America MAP Packaging Industry Revenue (Million), by Type of Packaging Material 2025 & 2033
- Figure 13: South America MAP Packaging Industry Revenue Share (%), by Type of Packaging Material 2025 & 2033
- Figure 14: South America MAP Packaging Industry Revenue (Million), by Application 2025 & 2033
- Figure 15: South America MAP Packaging Industry Revenue Share (%), by Application 2025 & 2033
- Figure 16: South America MAP Packaging Industry Revenue (Million), by Country 2025 & 2033
- Figure 17: South America MAP Packaging Industry Revenue Share (%), by Country 2025 & 2033
- Figure 18: Europe MAP Packaging Industry Revenue (Million), by Packaging Gas Type 2025 & 2033
- Figure 19: Europe MAP Packaging Industry Revenue Share (%), by Packaging Gas Type 2025 & 2033
- Figure 20: Europe MAP Packaging Industry Revenue (Million), by Type of Packaging Material 2025 & 2033
- Figure 21: Europe MAP Packaging Industry Revenue Share (%), by Type of Packaging Material 2025 & 2033
- Figure 22: Europe MAP Packaging Industry Revenue (Million), by Application 2025 & 2033
- Figure 23: Europe MAP Packaging Industry Revenue Share (%), by Application 2025 & 2033
- Figure 24: Europe MAP Packaging Industry Revenue (Million), by Country 2025 & 2033
- Figure 25: Europe MAP Packaging Industry Revenue Share (%), by Country 2025 & 2033
- Figure 26: Middle East & Africa MAP Packaging Industry Revenue (Million), by Packaging Gas Type 2025 & 2033
- Figure 27: Middle East & Africa MAP Packaging Industry Revenue Share (%), by Packaging Gas Type 2025 & 2033
- Figure 28: Middle East & Africa MAP Packaging Industry Revenue (Million), by Type of Packaging Material 2025 & 2033
- Figure 29: Middle East & Africa MAP Packaging Industry Revenue Share (%), by Type of Packaging Material 2025 & 2033
- Figure 30: Middle East & Africa MAP Packaging Industry Revenue (Million), by Application 2025 & 2033
- Figure 31: Middle East & Africa MAP Packaging Industry Revenue Share (%), by Application 2025 & 2033
- Figure 32: Middle East & Africa MAP Packaging Industry Revenue (Million), by Country 2025 & 2033
- Figure 33: Middle East & Africa MAP Packaging Industry Revenue Share (%), by Country 2025 & 2033
- Figure 34: Asia Pacific MAP Packaging Industry Revenue (Million), by Packaging Gas Type 2025 & 2033
- Figure 35: Asia Pacific MAP Packaging Industry Revenue Share (%), by Packaging Gas Type 2025 & 2033
- Figure 36: Asia Pacific MAP Packaging Industry Revenue (Million), by Type of Packaging Material 2025 & 2033
- Figure 37: Asia Pacific MAP Packaging Industry Revenue Share (%), by Type of Packaging Material 2025 & 2033
- Figure 38: Asia Pacific MAP Packaging Industry Revenue (Million), by Application 2025 & 2033
- Figure 39: Asia Pacific MAP Packaging Industry Revenue Share (%), by Application 2025 & 2033
- Figure 40: Asia Pacific MAP Packaging Industry Revenue (Million), by Country 2025 & 2033
- Figure 41: Asia Pacific MAP Packaging Industry Revenue Share (%), by Country 2025 & 2033
List of Tables
- Table 1: Global MAP Packaging Industry Revenue Million Forecast, by Packaging Gas Type 2020 & 2033
- Table 2: Global MAP Packaging Industry Revenue Million Forecast, by Type of Packaging Material 2020 & 2033
- Table 3: Global MAP Packaging Industry Revenue Million Forecast, by Application 2020 & 2033
- Table 4: Global MAP Packaging Industry Revenue Million Forecast, by Region 2020 & 2033
- Table 5: Global MAP Packaging Industry Revenue Million Forecast, by Packaging Gas Type 2020 & 2033
- Table 6: Global MAP Packaging Industry Revenue Million Forecast, by Type of Packaging Material 2020 & 2033
- Table 7: Global MAP Packaging Industry Revenue Million Forecast, by Application 2020 & 2033
- Table 8: Global MAP Packaging Industry Revenue Million Forecast, by Country 2020 & 2033
- Table 9: United States MAP Packaging Industry Revenue (Million) Forecast, by Application 2020 & 2033
- Table 10: Canada MAP Packaging Industry Revenue (Million) Forecast, by Application 2020 & 2033
- Table 11: Mexico MAP Packaging Industry Revenue (Million) Forecast, by Application 2020 & 2033
- Table 12: Global MAP Packaging Industry Revenue Million Forecast, by Packaging Gas Type 2020 & 2033
- Table 13: Global MAP Packaging Industry Revenue Million Forecast, by Type of Packaging Material 2020 & 2033
- Table 14: Global MAP Packaging Industry Revenue Million Forecast, by Application 2020 & 2033
- Table 15: Global MAP Packaging Industry Revenue Million Forecast, by Country 2020 & 2033
- Table 16: Brazil MAP Packaging Industry Revenue (Million) Forecast, by Application 2020 & 2033
- Table 17: Argentina MAP Packaging Industry Revenue (Million) Forecast, by Application 2020 & 2033
- Table 18: Rest of South America MAP Packaging Industry Revenue (Million) Forecast, by Application 2020 & 2033
- Table 19: Global MAP Packaging Industry Revenue Million Forecast, by Packaging Gas Type 2020 & 2033
- Table 20: Global MAP Packaging Industry Revenue Million Forecast, by Type of Packaging Material 2020 & 2033
- Table 21: Global MAP Packaging Industry Revenue Million Forecast, by Application 2020 & 2033
- Table 22: Global MAP Packaging Industry Revenue Million Forecast, by Country 2020 & 2033
- Table 23: United Kingdom MAP Packaging Industry Revenue (Million) Forecast, by Application 2020 & 2033
- Table 24: Germany MAP Packaging Industry Revenue (Million) Forecast, by Application 2020 & 2033
- Table 25: France MAP Packaging Industry Revenue (Million) Forecast, by Application 2020 & 2033
- Table 26: Italy MAP Packaging Industry Revenue (Million) Forecast, by Application 2020 & 2033
- Table 27: Spain MAP Packaging Industry Revenue (Million) Forecast, by Application 2020 & 2033
- Table 28: Russia MAP Packaging Industry Revenue (Million) Forecast, by Application 2020 & 2033
- Table 29: Benelux MAP Packaging Industry Revenue (Million) Forecast, by Application 2020 & 2033
- Table 30: Nordics MAP Packaging Industry Revenue (Million) Forecast, by Application 2020 & 2033
- Table 31: Rest of Europe MAP Packaging Industry Revenue (Million) Forecast, by Application 2020 & 2033
- Table 32: Global MAP Packaging Industry Revenue Million Forecast, by Packaging Gas Type 2020 & 2033
- Table 33: Global MAP Packaging Industry Revenue Million Forecast, by Type of Packaging Material 2020 & 2033
- Table 34: Global MAP Packaging Industry Revenue Million Forecast, by Application 2020 & 2033
- Table 35: Global MAP Packaging Industry Revenue Million Forecast, by Country 2020 & 2033
- Table 36: Turkey MAP Packaging Industry Revenue (Million) Forecast, by Application 2020 & 2033
- Table 37: Israel MAP Packaging Industry Revenue (Million) Forecast, by Application 2020 & 2033
- Table 38: GCC MAP Packaging Industry Revenue (Million) Forecast, by Application 2020 & 2033
- Table 39: North Africa MAP Packaging Industry Revenue (Million) Forecast, by Application 2020 & 2033
- Table 40: South Africa MAP Packaging Industry Revenue (Million) Forecast, by Application 2020 & 2033
- Table 41: Rest of Middle East & Africa MAP Packaging Industry Revenue (Million) Forecast, by Application 2020 & 2033
- Table 42: Global MAP Packaging Industry Revenue Million Forecast, by Packaging Gas Type 2020 & 2033
- Table 43: Global MAP Packaging Industry Revenue Million Forecast, by Type of Packaging Material 2020 & 2033
- Table 44: Global MAP Packaging Industry Revenue Million Forecast, by Application 2020 & 2033
- Table 45: Global MAP Packaging Industry Revenue Million Forecast, by Country 2020 & 2033
- Table 46: China MAP Packaging Industry Revenue (Million) Forecast, by Application 2020 & 2033
- Table 47: India MAP Packaging Industry Revenue (Million) Forecast, by Application 2020 & 2033
- Table 48: Japan MAP Packaging Industry Revenue (Million) Forecast, by Application 2020 & 2033
- Table 49: South Korea MAP Packaging Industry Revenue (Million) Forecast, by Application 2020 & 2033
- Table 50: ASEAN MAP Packaging Industry Revenue (Million) Forecast, by Application 2020 & 2033
- Table 51: Oceania MAP Packaging Industry Revenue (Million) Forecast, by Application 2020 & 2033
- Table 52: Rest of Asia Pacific MAP Packaging Industry Revenue (Million) Forecast, by Application 2020 & 2033
Frequently Asked Questions
1. What is the projected Compound Annual Growth Rate (CAGR) of the MAP Packaging Industry?
The projected CAGR is approximately 5.30%.
2. Which companies are prominent players in the MAP Packaging Industry?
Key companies in the market include SEALPAC Schweiz GmbH, Linde AG, Air Products and Chemicals Inc, Amcor Plc, Mondi Group, Syntegon Technology GmbH*List Not Exhaustive, Barry-Wehmiller Companies, ULMA Packaging, CV-Tek, Sealed Air Corporation.
3. What are the main segments of the MAP Packaging Industry?
The market segments include Packaging Gas Type, Type of Packaging Material, Application.
4. Can you provide details about the market size?
The market size is estimated to be USD XX Million as of 2022.
5. What are some drivers contributing to market growth?
; Increasing demand for longer shelf life; Rising demand for ready to eat food products in European countries.
6. What are the notable trends driving market growth?
Poultry. Seafood & Meat Products are Expected to Hold a Significant Share in the European Market.
7. Are there any restraints impacting market growth?
; Significantly higher cost of MAP related equipments.
8. Can you provide examples of recent developments in the market?
N/A
9. What pricing options are available for accessing the report?
Pricing options include single-user, multi-user, and enterprise licenses priced at USD 4750, USD 4950, and USD 6800 respectively.
10. Is the market size provided in terms of value or volume?
The market size is provided in terms of value, measured in Million.
11. Are there any specific market keywords associated with the report?
Yes, the market keyword associated with the report is "MAP Packaging Industry," which aids in identifying and referencing the specific market segment covered.
12. How do I determine which pricing option suits my needs best?
The pricing options vary based on user requirements and access needs. Individual users may opt for single-user licenses, while businesses requiring broader access may choose multi-user or enterprise licenses for cost-effective access to the report.
13. Are there any additional resources or data provided in the MAP Packaging Industry report?
While the report offers comprehensive insights, it's advisable to review the specific contents or supplementary materials provided to ascertain if additional resources or data are available.
14. How can I stay updated on further developments or reports in the MAP Packaging Industry?
To stay informed about further developments, trends, and reports in the MAP Packaging Industry, consider subscribing to industry newsletters, following relevant companies and organizations, or regularly checking reputable industry news sources and publications.
Methodology
Step 1 - Identification of Relevant Samples Size from Population Database


Step 2 - Approaches for Defining Global Market Size (Value, Volume* & Price*)

Note*: In applicable scenarios
Step 3 - Data Sources
Primary Research
- Web Analytics
- Survey Reports
- Research Institute
- Latest Research Reports
- Opinion Leaders
Secondary Research
- Annual Reports
- White Paper
- Latest Press Release
- Industry Association
- Paid Database
- Investor Presentations

Step 4 - Data Triangulation
Involves using different sources of information in order to increase the validity of a study
These sources are likely to be stakeholders in a program - participants, other researchers, program staff, other community members, and so on.
Then we put all data in single framework & apply various statistical tools to find out the dynamic on the market.
During the analysis stage, feedback from the stakeholder groups would be compared to determine areas of agreement as well as areas of divergence