


Key Insights
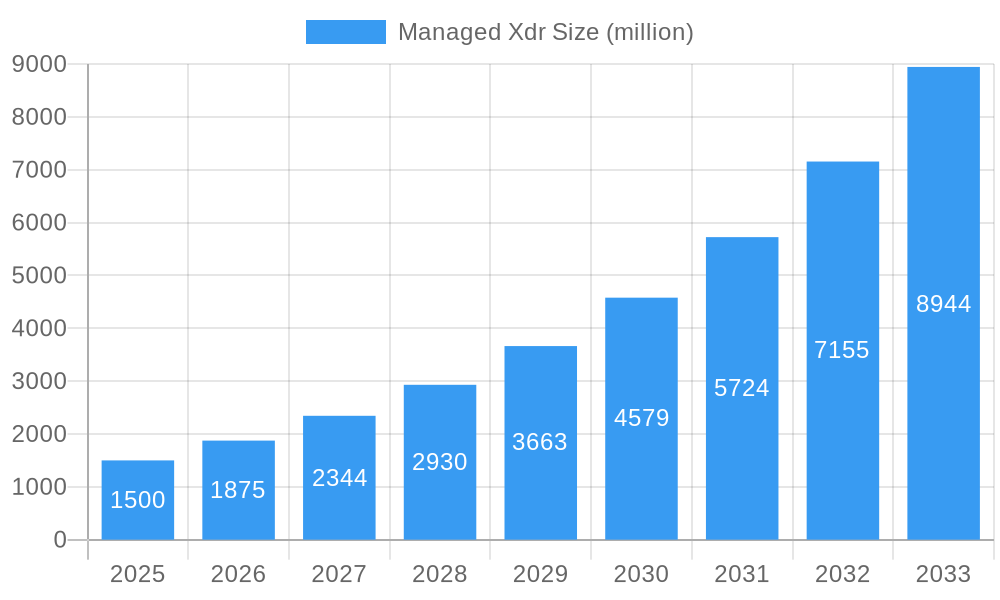
The Managed Extended Detection and Response (XDR) market is experiencing robust growth, driven by the increasing sophistication of cyberattacks and the need for comprehensive threat detection and response capabilities. The market's expansion is fueled by several key factors: the rising adoption of cloud-based services, the growing volume of data generated by organizations, and the increasing demand for proactive security measures. Organizations are increasingly recognizing the limitations of traditional security solutions that operate in silos and are seeking integrated platforms that provide a unified view of their security landscape. This shift is driving the adoption of Managed XDR, which offers centralized management, automated threat response, and improved visibility across various security domains including endpoints, networks, and clouds. The market is expected to witness significant expansion in the coming years, with a projected Compound Annual Growth Rate (CAGR) estimated at 25% between 2025 and 2033. This growth will be fueled by ongoing digital transformation initiatives across various industries, increasing cyber threats, and the growing need for managed security services.
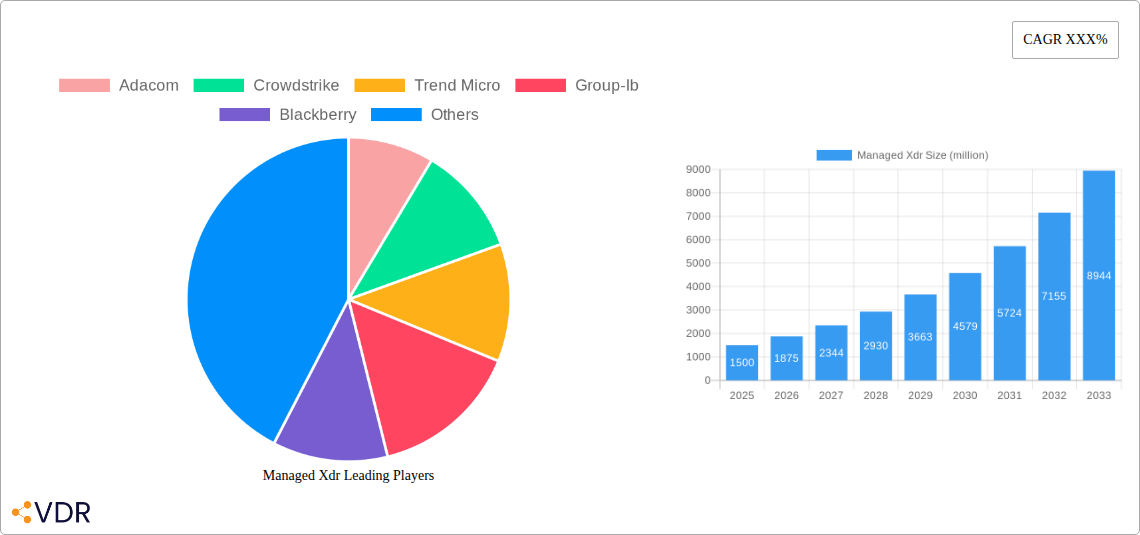
Managed Xdr Market Size (In Billion)

The competitive landscape is highly dynamic, with numerous established players and emerging vendors vying for market share. Key players such as CrowdStrike, Palo Alto Networks, and Trend Micro are leveraging their existing expertise in endpoint security and threat intelligence to expand their Managed XDR offerings. Smaller, specialized vendors are also emerging, offering niche solutions and innovative approaches to threat detection and response. The market's growth will likely be influenced by factors such as technological advancements in AI and machine learning, the evolving regulatory landscape, and the increasing adoption of cloud-native security solutions. Geographic expansion, particularly in developing economies, will also significantly contribute to the overall market growth. Furthermore, ongoing investments in research and development, coupled with strategic partnerships and acquisitions, will shape the competitive dynamics and product innovation within the Managed XDR space.
Managed Xdr Company Market Share
Managed XDR Market Report: 2019-2033
This comprehensive report provides an in-depth analysis of the Managed XDR market, offering invaluable insights for industry professionals, investors, and strategic decision-makers. With a study period spanning 2019-2033, a base year of 2025, and a forecast period of 2025-2033, this report leverages extensive data analysis to project the market's future trajectory. The report segments the market by various factors [Segment details are not provided; please provide segment information for a complete report]. The market size is expected to reach xx million USD by 2033.
Managed XDR Market Dynamics & Structure
The Managed XDR market is characterized by a moderately concentrated landscape, with key players like CrowdStrike, Palo Alto Networks, and Trend Micro holding significant market share. The market's growth is fueled by technological advancements such as AI-powered threat detection, automation, and cloud-based solutions. Regulatory frameworks like GDPR and CCPA are influencing vendor strategies and driving demand for robust security solutions. Competition from traditional endpoint detection and response (EDR) solutions exists; however, Managed XDR’s comprehensive approach offers a competitive advantage. The market witnesses frequent M&A activity, with an estimated xx million USD in deal value recorded during 2019-2024. End-user demographics span various industries, with increasing adoption among large enterprises and government agencies.
- Market Concentration: Moderately concentrated, with top 5 players holding approximately xx% market share in 2025.
- Technological Innovation: AI/ML, automation, cloud integration are key drivers.
- Regulatory Landscape: GDPR, CCPA, and other cybersecurity regulations drive adoption.
- M&A Activity: xx deals with a total estimated value of xx million USD during 2019-2024.
- Innovation Barriers: High initial investment costs, integration complexities, and skill gaps.
Managed XDR Growth Trends & Insights
The Managed XDR market experienced significant growth during the historical period (2019-2024), with a CAGR of xx%. This growth is attributed to the increasing sophistication of cyberattacks, rising adoption of cloud-based infrastructure, and a growing awareness of the need for comprehensive security solutions. The market is anticipated to continue its upward trajectory, with a projected CAGR of xx% during the forecast period (2025-2033), driven by factors such as the expansion of the cloud-native applications ecosystem and heightened regulatory compliance requirements. Market penetration is expected to increase from xx% in 2025 to xx% by 2033. Technological disruptions, such as the emergence of extended detection and response (XDR) solutions, are altering consumer behavior, with a shift towards holistic security platforms. The increase in remote work arrangements further strengthens the demand for remote monitoring and managed security services.
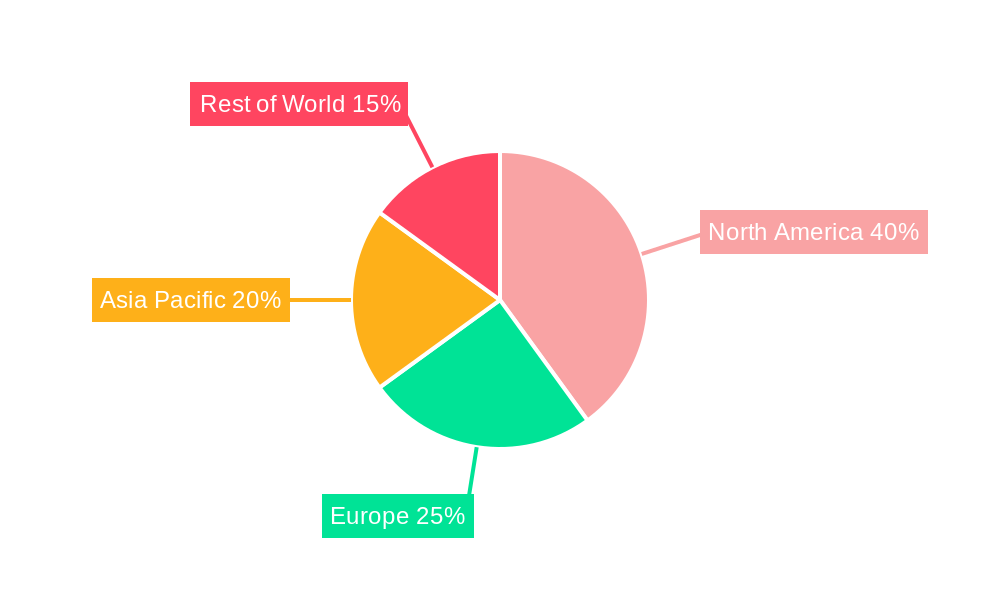
Dominant Regions, Countries, or Segments in Managed XDR
North America currently holds the largest market share in the Managed XDR sector, followed by Europe and Asia Pacific. This dominance is attributed to factors like strong cybersecurity infrastructure, higher technological adoption rates, stringent data privacy regulations, and increased digital transformation initiatives. The US market specifically stands out due to its large and mature IT sector, coupled with high levels of cybersecurity investment. Europe's growth is spurred by strong regulatory frameworks, particularly GDPR. The Asia-Pacific region is showing significant growth potential driven by rising digitalization and increasing cybersecurity awareness.
- North America: High IT spending, mature infrastructure, stringent regulations drive growth.
- Europe: Strong regulatory framework (GDPR) and increasing digitalization.
- Asia Pacific: Rapid digital transformation, rising cybersecurity awareness, cost-effective solutions are drivers.
Managed XDR Product Landscape
Managed XDR solutions offer a diverse range of functionalities, including threat detection, incident response, vulnerability management, and security information and event management (SIEM). Product innovations focus on enhancing automation, AI-powered threat intelligence, and seamless integration with existing security tools. Key performance indicators include detection rates, false positive rates, mean time to detect (MTTD), and mean time to respond (MTTR). Unique selling propositions frequently include proactive threat hunting, advanced analytics, and tailored services to specific industry needs.
Key Drivers, Barriers & Challenges in Managed XDR
Key Drivers: The increasing complexity and frequency of cyberattacks, coupled with the rising adoption of cloud-based and remote work models, significantly drive the demand for Managed XDR solutions. Stringent regulations further intensify the need for enhanced security posture, fueling the growth of the market. The rising demand for scalable and cost-effective security solutions also serves as a driver.
Key Barriers & Challenges: High initial investment costs, integration complexity with existing security infrastructure, and the scarcity of skilled professionals can hinder market growth. Competitive pressures from traditional security providers also present a challenge. Supply chain vulnerabilities, particularly reliance on third-party vendors, pose risks, affecting service quality and potentially leading to disruptions. The constantly evolving threat landscape necessitates continuous updates and adaptations, increasing operational costs. The regulatory landscape can add additional complexity and compliance costs.
Emerging Opportunities in Managed XDR
Emerging opportunities lie in untapped markets, particularly in developing economies with rapidly expanding digital infrastructure. Innovative applications like integrating XDR with IoT security and expanding into the healthcare and financial services sectors hold high potential. The evolving consumer preferences for cloud-based, AI-driven, and automated security solutions will drive further opportunities.
Growth Accelerators in the Managed XDR Industry
Technological advancements such as AI-powered threat detection and automation are crucial growth accelerators. Strategic partnerships between Managed Security Service Providers (MSSPs) and technology vendors enhance the delivery and reach of solutions. Expansion into new markets and vertical industries, combined with tailored solutions to specific industry needs, further accelerates market growth.
Key Players Shaping the Managed XDR Market
- Adacom
- Crowdstrike
- Trend Micro
- Group-IB
- Blackberry
- Barracuda
- Secureworks
- Difenda
- Fisglobal
- Optiv
- Cybalt
- Orange Cyberdefense
- Eci
- Quorum Cyber
- Criticalstart
- Infosec Partners
- Palo Alto Networks
Notable Milestones in Managed XDR Sector
- 2020-Q4: CrowdStrike launched its Falcon XDR platform.
- 2021-Q1: Microsoft integrated XDR capabilities into its Defender platform.
- 2022-Q2: Several significant M&A deals were announced within the XDR space. (Specific details require additional data to provide precise specifics.)
- 2023-Q1: Significant product updates by major vendors focusing on AI and ML integration.
In-Depth Managed XDR Market Outlook
The Managed XDR market exhibits significant future potential, driven by continued technological advancements, expanding adoption across diverse industries, and an increasing need for robust cybersecurity solutions. Strategic partnerships, innovative product offerings, and expansion into new markets will shape the industry's future landscape, providing substantial opportunities for growth and investment. The market is poised for continued expansion, with substantial growth anticipated in the forecast period.
Managed Xdr Segmentation
-
1. Application
- 1.1. Large Enterprise
- 1.2. SMEs
-
2. Type
- 2.1. Cloud Based
- 2.2. Local Based
Managed Xdr Segmentation By Geography
-
1. North America
- 1.1. United States
- 1.2. Canada
- 1.3. Mexico
-
2. South America
- 2.1. Brazil
- 2.2. Argentina
- 2.3. Rest of South America
-
3. Europe
- 3.1. United Kingdom
- 3.2. Germany
- 3.3. France
- 3.4. Italy
- 3.5. Spain
- 3.6. Russia
- 3.7. Benelux
- 3.8. Nordics
- 3.9. Rest of Europe
-
4. Middle East & Africa
- 4.1. Turkey
- 4.2. Israel
- 4.3. GCC
- 4.4. North Africa
- 4.5. South Africa
- 4.6. Rest of Middle East & Africa
-
5. Asia Pacific
- 5.1. China
- 5.2. India
- 5.3. Japan
- 5.4. South Korea
- 5.5. ASEAN
- 5.6. Oceania
- 5.7. Rest of Asia Pacific
Managed Xdr Regional Market Share
Geographic Coverage of Managed Xdr
Managed Xdr REPORT HIGHLIGHTS
| Aspects | Details |
|---|---|
| Study Period | 2020-2034 |
| Base Year | 2025 |
| Estimated Year | 2026 |
| Forecast Period | 2026-2034 |
| Historical Period | 2020-2025 |
| Growth Rate | CAGR of XXX% from 2020-2034 |
| Segmentation |
|
Table of Contents
- 1. Introduction
- 1.1. Research Scope
- 1.2. Market Segmentation
- 1.3. Research Methodology
- 1.4. Definitions and Assumptions
- 2. Executive Summary
- 2.1. Introduction
- 3. Market Dynamics
- 3.1. Introduction
- 3.2. Market Drivers
- 3.3. Market Restrains
- 3.4. Market Trends
- 4. Market Factor Analysis
- 4.1. Porters Five Forces
- 4.2. Supply/Value Chain
- 4.3. PESTEL analysis
- 4.4. Market Entropy
- 4.5. Patent/Trademark Analysis
- 5. Global Managed Xdr Analysis, Insights and Forecast, 2020-2032
- 5.1. Market Analysis, Insights and Forecast - by Application
- 5.1.1. Large Enterprise
- 5.1.2. SMEs
- 5.2. Market Analysis, Insights and Forecast - by Type
- 5.2.1. Cloud Based
- 5.2.2. Local Based
- 5.3. Market Analysis, Insights and Forecast - by Region
- 5.3.1. North America
- 5.3.2. South America
- 5.3.3. Europe
- 5.3.4. Middle East & Africa
- 5.3.5. Asia Pacific
- 5.1. Market Analysis, Insights and Forecast - by Application
- 6. North America Managed Xdr Analysis, Insights and Forecast, 2020-2032
- 6.1. Market Analysis, Insights and Forecast - by Application
- 6.1.1. Large Enterprise
- 6.1.2. SMEs
- 6.2. Market Analysis, Insights and Forecast - by Type
- 6.2.1. Cloud Based
- 6.2.2. Local Based
- 6.1. Market Analysis, Insights and Forecast - by Application
- 7. South America Managed Xdr Analysis, Insights and Forecast, 2020-2032
- 7.1. Market Analysis, Insights and Forecast - by Application
- 7.1.1. Large Enterprise
- 7.1.2. SMEs
- 7.2. Market Analysis, Insights and Forecast - by Type
- 7.2.1. Cloud Based
- 7.2.2. Local Based
- 7.1. Market Analysis, Insights and Forecast - by Application
- 8. Europe Managed Xdr Analysis, Insights and Forecast, 2020-2032
- 8.1. Market Analysis, Insights and Forecast - by Application
- 8.1.1. Large Enterprise
- 8.1.2. SMEs
- 8.2. Market Analysis, Insights and Forecast - by Type
- 8.2.1. Cloud Based
- 8.2.2. Local Based
- 8.1. Market Analysis, Insights and Forecast - by Application
- 9. Middle East & Africa Managed Xdr Analysis, Insights and Forecast, 2020-2032
- 9.1. Market Analysis, Insights and Forecast - by Application
- 9.1.1. Large Enterprise
- 9.1.2. SMEs
- 9.2. Market Analysis, Insights and Forecast - by Type
- 9.2.1. Cloud Based
- 9.2.2. Local Based
- 9.1. Market Analysis, Insights and Forecast - by Application
- 10. Asia Pacific Managed Xdr Analysis, Insights and Forecast, 2020-2032
- 10.1. Market Analysis, Insights and Forecast - by Application
- 10.1.1. Large Enterprise
- 10.1.2. SMEs
- 10.2. Market Analysis, Insights and Forecast - by Type
- 10.2.1. Cloud Based
- 10.2.2. Local Based
- 10.1. Market Analysis, Insights and Forecast - by Application
- 11. Competitive Analysis
- 11.1. Global Market Share Analysis 2025
- 11.2. Company Profiles
- 11.2.1 Adacom
- 11.2.1.1. Overview
- 11.2.1.2. Products
- 11.2.1.3. SWOT Analysis
- 11.2.1.4. Recent Developments
- 11.2.1.5. Financials (Based on Availability)
- 11.2.2 Crowdstrike
- 11.2.2.1. Overview
- 11.2.2.2. Products
- 11.2.2.3. SWOT Analysis
- 11.2.2.4. Recent Developments
- 11.2.2.5. Financials (Based on Availability)
- 11.2.3 Trend Micro
- 11.2.3.1. Overview
- 11.2.3.2. Products
- 11.2.3.3. SWOT Analysis
- 11.2.3.4. Recent Developments
- 11.2.3.5. Financials (Based on Availability)
- 11.2.4 Group-Ib
- 11.2.4.1. Overview
- 11.2.4.2. Products
- 11.2.4.3. SWOT Analysis
- 11.2.4.4. Recent Developments
- 11.2.4.5. Financials (Based on Availability)
- 11.2.5 Blackberry
- 11.2.5.1. Overview
- 11.2.5.2. Products
- 11.2.5.3. SWOT Analysis
- 11.2.5.4. Recent Developments
- 11.2.5.5. Financials (Based on Availability)
- 11.2.6 Barracuda
- 11.2.6.1. Overview
- 11.2.6.2. Products
- 11.2.6.3. SWOT Analysis
- 11.2.6.4. Recent Developments
- 11.2.6.5. Financials (Based on Availability)
- 11.2.7 Secureworks
- 11.2.7.1. Overview
- 11.2.7.2. Products
- 11.2.7.3. SWOT Analysis
- 11.2.7.4. Recent Developments
- 11.2.7.5. Financials (Based on Availability)
- 11.2.8 Difenda
- 11.2.8.1. Overview
- 11.2.8.2. Products
- 11.2.8.3. SWOT Analysis
- 11.2.8.4. Recent Developments
- 11.2.8.5. Financials (Based on Availability)
- 11.2.9 Fisglobal
- 11.2.9.1. Overview
- 11.2.9.2. Products
- 11.2.9.3. SWOT Analysis
- 11.2.9.4. Recent Developments
- 11.2.9.5. Financials (Based on Availability)
- 11.2.10 Optiv
- 11.2.10.1. Overview
- 11.2.10.2. Products
- 11.2.10.3. SWOT Analysis
- 11.2.10.4. Recent Developments
- 11.2.10.5. Financials (Based on Availability)
- 11.2.11 Cybalt
- 11.2.11.1. Overview
- 11.2.11.2. Products
- 11.2.11.3. SWOT Analysis
- 11.2.11.4. Recent Developments
- 11.2.11.5. Financials (Based on Availability)
- 11.2.12 Orange Cyberdefense
- 11.2.12.1. Overview
- 11.2.12.2. Products
- 11.2.12.3. SWOT Analysis
- 11.2.12.4. Recent Developments
- 11.2.12.5. Financials (Based on Availability)
- 11.2.13 Eci
- 11.2.13.1. Overview
- 11.2.13.2. Products
- 11.2.13.3. SWOT Analysis
- 11.2.13.4. Recent Developments
- 11.2.13.5. Financials (Based on Availability)
- 11.2.14 Quorum Cyber
- 11.2.14.1. Overview
- 11.2.14.2. Products
- 11.2.14.3. SWOT Analysis
- 11.2.14.4. Recent Developments
- 11.2.14.5. Financials (Based on Availability)
- 11.2.15 Criticalstart
- 11.2.15.1. Overview
- 11.2.15.2. Products
- 11.2.15.3. SWOT Analysis
- 11.2.15.4. Recent Developments
- 11.2.15.5. Financials (Based on Availability)
- 11.2.16 Infosec Partners
- 11.2.16.1. Overview
- 11.2.16.2. Products
- 11.2.16.3. SWOT Analysis
- 11.2.16.4. Recent Developments
- 11.2.16.5. Financials (Based on Availability)
- 11.2.17 Palo Alto Networks
- 11.2.17.1. Overview
- 11.2.17.2. Products
- 11.2.17.3. SWOT Analysis
- 11.2.17.4. Recent Developments
- 11.2.17.5. Financials (Based on Availability)
- 11.2.1 Adacom
List of Figures
- Figure 1: Global Managed Xdr Revenue Breakdown (million, %) by Region 2025 & 2033
- Figure 2: North America Managed Xdr Revenue (million), by Application 2025 & 2033
- Figure 3: North America Managed Xdr Revenue Share (%), by Application 2025 & 2033
- Figure 4: North America Managed Xdr Revenue (million), by Type 2025 & 2033
- Figure 5: North America Managed Xdr Revenue Share (%), by Type 2025 & 2033
- Figure 6: North America Managed Xdr Revenue (million), by Country 2025 & 2033
- Figure 7: North America Managed Xdr Revenue Share (%), by Country 2025 & 2033
- Figure 8: South America Managed Xdr Revenue (million), by Application 2025 & 2033
- Figure 9: South America Managed Xdr Revenue Share (%), by Application 2025 & 2033
- Figure 10: South America Managed Xdr Revenue (million), by Type 2025 & 2033
- Figure 11: South America Managed Xdr Revenue Share (%), by Type 2025 & 2033
- Figure 12: South America Managed Xdr Revenue (million), by Country 2025 & 2033
- Figure 13: South America Managed Xdr Revenue Share (%), by Country 2025 & 2033
- Figure 14: Europe Managed Xdr Revenue (million), by Application 2025 & 2033
- Figure 15: Europe Managed Xdr Revenue Share (%), by Application 2025 & 2033
- Figure 16: Europe Managed Xdr Revenue (million), by Type 2025 & 2033
- Figure 17: Europe Managed Xdr Revenue Share (%), by Type 2025 & 2033
- Figure 18: Europe Managed Xdr Revenue (million), by Country 2025 & 2033
- Figure 19: Europe Managed Xdr Revenue Share (%), by Country 2025 & 2033
- Figure 20: Middle East & Africa Managed Xdr Revenue (million), by Application 2025 & 2033
- Figure 21: Middle East & Africa Managed Xdr Revenue Share (%), by Application 2025 & 2033
- Figure 22: Middle East & Africa Managed Xdr Revenue (million), by Type 2025 & 2033
- Figure 23: Middle East & Africa Managed Xdr Revenue Share (%), by Type 2025 & 2033
- Figure 24: Middle East & Africa Managed Xdr Revenue (million), by Country 2025 & 2033
- Figure 25: Middle East & Africa Managed Xdr Revenue Share (%), by Country 2025 & 2033
- Figure 26: Asia Pacific Managed Xdr Revenue (million), by Application 2025 & 2033
- Figure 27: Asia Pacific Managed Xdr Revenue Share (%), by Application 2025 & 2033
- Figure 28: Asia Pacific Managed Xdr Revenue (million), by Type 2025 & 2033
- Figure 29: Asia Pacific Managed Xdr Revenue Share (%), by Type 2025 & 2033
- Figure 30: Asia Pacific Managed Xdr Revenue (million), by Country 2025 & 2033
- Figure 31: Asia Pacific Managed Xdr Revenue Share (%), by Country 2025 & 2033
List of Tables
- Table 1: Global Managed Xdr Revenue million Forecast, by Application 2020 & 2033
- Table 2: Global Managed Xdr Revenue million Forecast, by Type 2020 & 2033
- Table 3: Global Managed Xdr Revenue million Forecast, by Region 2020 & 2033
- Table 4: Global Managed Xdr Revenue million Forecast, by Application 2020 & 2033
- Table 5: Global Managed Xdr Revenue million Forecast, by Type 2020 & 2033
- Table 6: Global Managed Xdr Revenue million Forecast, by Country 2020 & 2033
- Table 7: United States Managed Xdr Revenue (million) Forecast, by Application 2020 & 2033
- Table 8: Canada Managed Xdr Revenue (million) Forecast, by Application 2020 & 2033
- Table 9: Mexico Managed Xdr Revenue (million) Forecast, by Application 2020 & 2033
- Table 10: Global Managed Xdr Revenue million Forecast, by Application 2020 & 2033
- Table 11: Global Managed Xdr Revenue million Forecast, by Type 2020 & 2033
- Table 12: Global Managed Xdr Revenue million Forecast, by Country 2020 & 2033
- Table 13: Brazil Managed Xdr Revenue (million) Forecast, by Application 2020 & 2033
- Table 14: Argentina Managed Xdr Revenue (million) Forecast, by Application 2020 & 2033
- Table 15: Rest of South America Managed Xdr Revenue (million) Forecast, by Application 2020 & 2033
- Table 16: Global Managed Xdr Revenue million Forecast, by Application 2020 & 2033
- Table 17: Global Managed Xdr Revenue million Forecast, by Type 2020 & 2033
- Table 18: Global Managed Xdr Revenue million Forecast, by Country 2020 & 2033
- Table 19: United Kingdom Managed Xdr Revenue (million) Forecast, by Application 2020 & 2033
- Table 20: Germany Managed Xdr Revenue (million) Forecast, by Application 2020 & 2033
- Table 21: France Managed Xdr Revenue (million) Forecast, by Application 2020 & 2033
- Table 22: Italy Managed Xdr Revenue (million) Forecast, by Application 2020 & 2033
- Table 23: Spain Managed Xdr Revenue (million) Forecast, by Application 2020 & 2033
- Table 24: Russia Managed Xdr Revenue (million) Forecast, by Application 2020 & 2033
- Table 25: Benelux Managed Xdr Revenue (million) Forecast, by Application 2020 & 2033
- Table 26: Nordics Managed Xdr Revenue (million) Forecast, by Application 2020 & 2033
- Table 27: Rest of Europe Managed Xdr Revenue (million) Forecast, by Application 2020 & 2033
- Table 28: Global Managed Xdr Revenue million Forecast, by Application 2020 & 2033
- Table 29: Global Managed Xdr Revenue million Forecast, by Type 2020 & 2033
- Table 30: Global Managed Xdr Revenue million Forecast, by Country 2020 & 2033
- Table 31: Turkey Managed Xdr Revenue (million) Forecast, by Application 2020 & 2033
- Table 32: Israel Managed Xdr Revenue (million) Forecast, by Application 2020 & 2033
- Table 33: GCC Managed Xdr Revenue (million) Forecast, by Application 2020 & 2033
- Table 34: North Africa Managed Xdr Revenue (million) Forecast, by Application 2020 & 2033
- Table 35: South Africa Managed Xdr Revenue (million) Forecast, by Application 2020 & 2033
- Table 36: Rest of Middle East & Africa Managed Xdr Revenue (million) Forecast, by Application 2020 & 2033
- Table 37: Global Managed Xdr Revenue million Forecast, by Application 2020 & 2033
- Table 38: Global Managed Xdr Revenue million Forecast, by Type 2020 & 2033
- Table 39: Global Managed Xdr Revenue million Forecast, by Country 2020 & 2033
- Table 40: China Managed Xdr Revenue (million) Forecast, by Application 2020 & 2033
- Table 41: India Managed Xdr Revenue (million) Forecast, by Application 2020 & 2033
- Table 42: Japan Managed Xdr Revenue (million) Forecast, by Application 2020 & 2033
- Table 43: South Korea Managed Xdr Revenue (million) Forecast, by Application 2020 & 2033
- Table 44: ASEAN Managed Xdr Revenue (million) Forecast, by Application 2020 & 2033
- Table 45: Oceania Managed Xdr Revenue (million) Forecast, by Application 2020 & 2033
- Table 46: Rest of Asia Pacific Managed Xdr Revenue (million) Forecast, by Application 2020 & 2033
Frequently Asked Questions
1. What is the projected Compound Annual Growth Rate (CAGR) of the Managed Xdr?
The projected CAGR is approximately XXX%.
2. Which companies are prominent players in the Managed Xdr?
Key companies in the market include Adacom, Crowdstrike, Trend Micro, Group-Ib, Blackberry, Barracuda, Secureworks, Difenda, Fisglobal, Optiv, Cybalt, Orange Cyberdefense, Eci, Quorum Cyber, Criticalstart, Infosec Partners, Palo Alto Networks.
3. What are the main segments of the Managed Xdr?
The market segments include Application, Type.
4. Can you provide details about the market size?
The market size is estimated to be USD XXX million as of 2022.
5. What are some drivers contributing to market growth?
N/A
6. What are the notable trends driving market growth?
N/A
7. Are there any restraints impacting market growth?
N/A
8. Can you provide examples of recent developments in the market?
N/A
9. What pricing options are available for accessing the report?
Pricing options include single-user, multi-user, and enterprise licenses priced at USD 2900.00, USD 4350.00, and USD 5800.00 respectively.
10. Is the market size provided in terms of value or volume?
The market size is provided in terms of value, measured in million.
11. Are there any specific market keywords associated with the report?
Yes, the market keyword associated with the report is "Managed Xdr," which aids in identifying and referencing the specific market segment covered.
12. How do I determine which pricing option suits my needs best?
The pricing options vary based on user requirements and access needs. Individual users may opt for single-user licenses, while businesses requiring broader access may choose multi-user or enterprise licenses for cost-effective access to the report.
13. Are there any additional resources or data provided in the Managed Xdr report?
While the report offers comprehensive insights, it's advisable to review the specific contents or supplementary materials provided to ascertain if additional resources or data are available.
14. How can I stay updated on further developments or reports in the Managed Xdr?
To stay informed about further developments, trends, and reports in the Managed Xdr, consider subscribing to industry newsletters, following relevant companies and organizations, or regularly checking reputable industry news sources and publications.
Methodology
Step 1 - Identification of Relevant Samples Size from Population Database


Step 2 - Approaches for Defining Global Market Size (Value, Volume* & Price*)

Note*: In applicable scenarios
Step 3 - Data Sources
Primary Research
- Web Analytics
- Survey Reports
- Research Institute
- Latest Research Reports
- Opinion Leaders
Secondary Research
- Annual Reports
- White Paper
- Latest Press Release
- Industry Association
- Paid Database
- Investor Presentations

Step 4 - Data Triangulation
Involves using different sources of information in order to increase the validity of a study
These sources are likely to be stakeholders in a program - participants, other researchers, program staff, other community members, and so on.
Then we put all data in single framework & apply various statistical tools to find out the dynamic on the market.
During the analysis stage, feedback from the stakeholder groups would be compared to determine areas of agreement as well as areas of divergence