


Key Insights
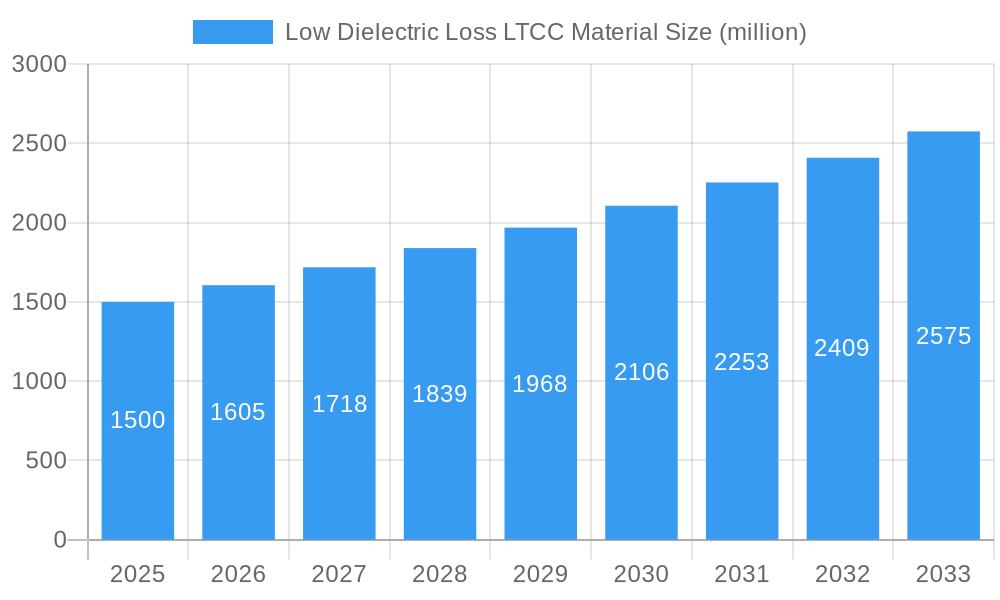
The Low Dielectric Loss LTCC (Low Temperature Co-fired Ceramic) Material market is experiencing robust growth, driven by the increasing demand for high-frequency applications in the electronics industry. The market, estimated at $1.5 billion in 2025, is projected to achieve a Compound Annual Growth Rate (CAGR) of 7% from 2025 to 2033, reaching approximately $2.7 billion by 2033. This growth is fueled by several key factors, including the miniaturization of electronic devices, the rise of 5G and beyond-5G technologies requiring advanced materials with low dielectric losses, and the growing adoption of LTCC in automotive electronics and aerospace applications. Key players such as NEG, Yamamura, Heraeus, DuPont, Ferro, Vibrantz, Okamoto, Siramic-Tech, and Beijing Tian Li Chuang Glass Technology Development are driving innovation and competition within the market, leading to advancements in material properties and process optimization.
Low Dielectric Loss LTCC Material Market Size (In Billion)

The market segmentation reveals a strong demand across various applications, with the automotive and telecommunications sectors as leading drivers of growth. Growth is further enhanced by the increasing need for high-performance, energy-efficient electronics, along with the development of new manufacturing techniques for LTCC components. Although challenges like the high initial investment in LTCC manufacturing facilities and the complexity of the process might pose restraints, the overall market outlook remains positive, with continuous improvements in material characteristics and manufacturing processes expected to overcome these hurdles. This sustained growth trajectory indicates a significant investment opportunity for companies operating in this space, while simultaneously fueling technological advancements to meet the expanding demands of modern electronics.
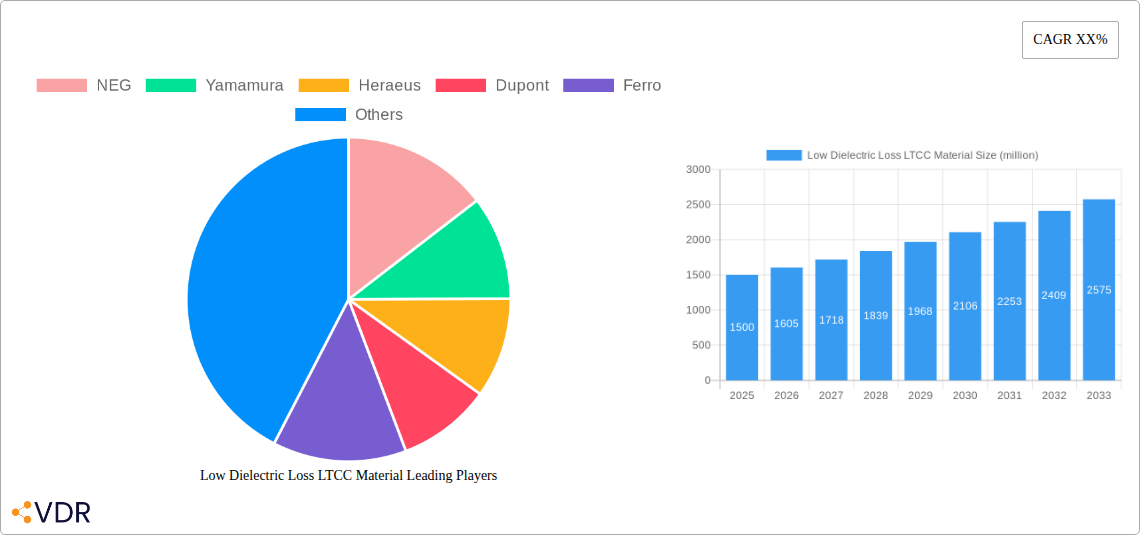
Low Dielectric Loss LTCC Material Company Market Share
Low Dielectric Loss LTCC Material Market Report: 2019-2033
This comprehensive report provides a detailed analysis of the Low Dielectric Loss LTCC (Low Temperature Co-fired Ceramic) Material market, offering invaluable insights for industry professionals, investors, and strategic decision-makers. The report covers the period 2019-2033, with a focus on the forecast period 2025-2033 and a base year of 2025. The study encompasses market size estimations (in millions of units), growth trends, regional dominance, product landscape, competitive analysis, and future opportunities within the parent market of advanced materials and the child market of electronic components.
Low Dielectric Loss LTCC Material Market Dynamics & Structure
The Low Dielectric Loss LTCC Material market is characterized by moderate concentration, with key players such as NEG, Yamamura, Heraeus, DuPont, Ferro, Vibrantz, Okamoto, Siramic-Tech, and Beijing Tian Li Chuang Glass Technology Development vying for market share. Technological innovation, particularly in materials science and miniaturization, is a primary growth driver. Stringent regulatory frameworks concerning material safety and environmental impact also influence market dynamics. Competitive substitutes, such as high-frequency PCBs, exist but LTCC's unique advantages in miniaturization and high-frequency applications maintain its market position. M&A activity has been relatively subdued in recent years (xx deals in the historical period), reflecting a focus on organic growth and technological advancement. End-user demographics are heavily skewed towards the electronics industry, particularly in the 5G and high-frequency communication segments.
- Market Concentration: Moderately concentrated, with top 5 players holding approximately 60% market share (2025 estimate).
- Technological Innovation: Focus on reducing dielectric loss, improving thermal stability, and enhancing miniaturization capabilities.
- Regulatory Landscape: Compliance with RoHS and REACH regulations is crucial.
- Competitive Substitutes: High-frequency PCBs, but LTCC offers advantages in miniaturization and performance.
- M&A Activity: xx deals between 2019-2024, with a projected increase to xx deals by 2033 driven by increasing demand in the automotive industry.
- End-User Demographics: Primarily electronics, telecommunications, and automotive industries.
Low Dielectric Loss LTCC Material Growth Trends & Insights
The Low Dielectric Loss LTCC Material market experienced steady growth during the historical period (2019-2024), with a CAGR of xx%. Driven by increasing demand for high-frequency applications (5G, IoT, automotive electronics), the market is projected to continue its expansion during the forecast period (2025-2033), achieving a CAGR of xx%. This growth is fueled by technological advancements, including the development of lower-loss materials and improved manufacturing processes. Market penetration is expected to increase significantly in emerging economies, driven by infrastructure development and rising consumer electronics adoption. However, the market faces challenges in adopting newer technologies, supply chain complexities, and competitive pressures from alternative technologies. Consumer behavior trends indicate a growing preference for smaller, faster, and more energy-efficient electronic devices, further bolstering demand for LTCC materials.
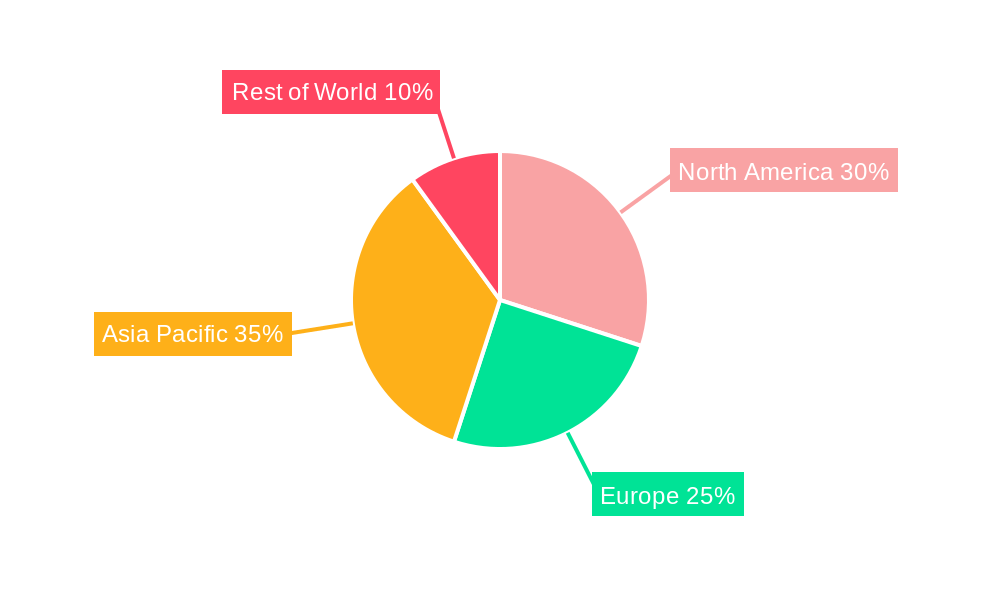
Dominant Regions, Countries, or Segments in Low Dielectric Loss LTCC Material
The Asia-Pacific region dominates the Low Dielectric Loss LTCC Material market, driven by robust growth in the electronics manufacturing sector, particularly in China, Japan, South Korea, and Taiwan. These countries benefit from strong technological capabilities, established manufacturing infrastructure, and a large pool of skilled labor. North America and Europe also represent significant markets, although growth rates are comparatively slower.
- Key Drivers in Asia-Pacific:
- Strong electronics manufacturing base.
- Government support for technological advancements.
- High adoption of 5G and IoT technologies.
- Dominance Factors: High market share (xx% in 2025), significant manufacturing capacity, and proximity to key end-users.
- Growth Potential: Continued expansion is expected, driven by the increasing penetration of electronic devices and the development of advanced technologies.
Low Dielectric Loss LTCC Material Product Landscape
Product innovations in Low Dielectric Loss LTCC Material focus on achieving lower dielectric losses, higher thermal conductivity, and improved material strength. Applications span diverse sectors, including high-frequency filters, antennas, and integrated circuits for mobile devices, automobiles, and communication equipment. Key performance metrics include dielectric constant, dissipation factor, and thermal conductivity. Unique selling propositions often involve customized material properties and improved manufacturing efficiency. Recent advancements include the incorporation of nanoparticles and novel ceramic compositions to optimize performance characteristics.
Key Drivers, Barriers & Challenges in Low Dielectric Loss LTCC Material
Key Drivers:
- Growing demand for miniaturized electronic components.
- Rise of 5G and IoT technologies.
- Increasing adoption in automotive electronics.
- Development of low-loss materials with superior performance characteristics.
Key Barriers & Challenges:
- High material costs and manufacturing complexity.
- Supply chain disruptions and geopolitical uncertainties.
- Intense competition from alternative technologies.
- Stringent environmental regulations impacting material selection and manufacturing processes. This has resulted in a xx% increase in production costs in the last 5 years.
Emerging Opportunities in Low Dielectric Loss LTCC Material
Emerging opportunities include the integration of LTCC materials into next-generation electronic devices, such as wearable technology and flexible electronics. Untapped markets exist in developing economies with expanding infrastructure and consumer electronics demand. The development of specialized LTCC materials for specific applications (e.g., high-temperature operation, biocompatibility) also presents significant growth potential.
Growth Accelerators in the Low Dielectric Loss LTCC Material Industry
Technological breakthroughs in material science, driving further reductions in dielectric loss and improved thermal conductivity, are key growth accelerators. Strategic partnerships between material suppliers and electronics manufacturers are also critical for fostering innovation and market expansion. Targeted market expansion into emerging economies, emphasizing local manufacturing and distribution channels, will further accelerate market growth.
Notable Milestones in Low Dielectric Loss LTCC Material Sector
- 2020: Introduction of a new LTCC material with significantly reduced dielectric loss by Heraeus.
- 2021: NEG announces a strategic partnership with a major electronics manufacturer to develop customized LTCC solutions.
- 2022: Significant investment in R&D by Yamamura focused on improving the thermal conductivity of LTCC materials.
- 2023: New regulatory standards for LTCC materials are implemented in Europe, impacting material specifications.
In-Depth Low Dielectric Loss LTCC Material Market Outlook
The Low Dielectric Loss LTCC Material market is poised for robust growth over the next decade, driven by continued technological advancements, increasing demand from high-growth sectors, and the expansion into new markets. Strategic opportunities lie in developing specialized LTCC materials for emerging applications, forging strong partnerships, and optimizing manufacturing processes for improved efficiency and cost reduction. The market's future hinges on the ability of key players to adapt to evolving technological demands and meet the stringent requirements of the end-user industries.
Low Dielectric Loss LTCC Material Segmentation
-
1. Application
- 1.1. LTCC Components
- 1.2. LTCC Substrate
-
2. Types
- 2.1. LTCC Tape
- 2.2. Raw Material Powder
- 2.3. Other
Low Dielectric Loss LTCC Material Segmentation By Geography
-
1. North America
- 1.1. United States
- 1.2. Canada
- 1.3. Mexico
-
2. South America
- 2.1. Brazil
- 2.2. Argentina
- 2.3. Rest of South America
-
3. Europe
- 3.1. United Kingdom
- 3.2. Germany
- 3.3. France
- 3.4. Italy
- 3.5. Spain
- 3.6. Russia
- 3.7. Benelux
- 3.8. Nordics
- 3.9. Rest of Europe
-
4. Middle East & Africa
- 4.1. Turkey
- 4.2. Israel
- 4.3. GCC
- 4.4. North Africa
- 4.5. South Africa
- 4.6. Rest of Middle East & Africa
-
5. Asia Pacific
- 5.1. China
- 5.2. India
- 5.3. Japan
- 5.4. South Korea
- 5.5. ASEAN
- 5.6. Oceania
- 5.7. Rest of Asia Pacific
Low Dielectric Loss LTCC Material Regional Market Share
Geographic Coverage of Low Dielectric Loss LTCC Material
Low Dielectric Loss LTCC Material REPORT HIGHLIGHTS
| Aspects | Details |
|---|---|
| Study Period | 2020-2034 |
| Base Year | 2025 |
| Estimated Year | 2026 |
| Forecast Period | 2026-2034 |
| Historical Period | 2020-2025 |
| Growth Rate | CAGR of 8% from 2020-2034 |
| Segmentation |
|
Table of Contents
- 1. Introduction
- 1.1. Research Scope
- 1.2. Market Segmentation
- 1.3. Research Methodology
- 1.4. Definitions and Assumptions
- 2. Executive Summary
- 2.1. Introduction
- 3. Market Dynamics
- 3.1. Introduction
- 3.2. Market Drivers
- 3.3. Market Restrains
- 3.4. Market Trends
- 4. Market Factor Analysis
- 4.1. Porters Five Forces
- 4.2. Supply/Value Chain
- 4.3. PESTEL analysis
- 4.4. Market Entropy
- 4.5. Patent/Trademark Analysis
- 5. Global Low Dielectric Loss LTCC Material Analysis, Insights and Forecast, 2020-2032
- 5.1. Market Analysis, Insights and Forecast - by Application
- 5.1.1. LTCC Components
- 5.1.2. LTCC Substrate
- 5.2. Market Analysis, Insights and Forecast - by Types
- 5.2.1. LTCC Tape
- 5.2.2. Raw Material Powder
- 5.2.3. Other
- 5.3. Market Analysis, Insights and Forecast - by Region
- 5.3.1. North America
- 5.3.2. South America
- 5.3.3. Europe
- 5.3.4. Middle East & Africa
- 5.3.5. Asia Pacific
- 5.1. Market Analysis, Insights and Forecast - by Application
- 6. North America Low Dielectric Loss LTCC Material Analysis, Insights and Forecast, 2020-2032
- 6.1. Market Analysis, Insights and Forecast - by Application
- 6.1.1. LTCC Components
- 6.1.2. LTCC Substrate
- 6.2. Market Analysis, Insights and Forecast - by Types
- 6.2.1. LTCC Tape
- 6.2.2. Raw Material Powder
- 6.2.3. Other
- 6.1. Market Analysis, Insights and Forecast - by Application
- 7. South America Low Dielectric Loss LTCC Material Analysis, Insights and Forecast, 2020-2032
- 7.1. Market Analysis, Insights and Forecast - by Application
- 7.1.1. LTCC Components
- 7.1.2. LTCC Substrate
- 7.2. Market Analysis, Insights and Forecast - by Types
- 7.2.1. LTCC Tape
- 7.2.2. Raw Material Powder
- 7.2.3. Other
- 7.1. Market Analysis, Insights and Forecast - by Application
- 8. Europe Low Dielectric Loss LTCC Material Analysis, Insights and Forecast, 2020-2032
- 8.1. Market Analysis, Insights and Forecast - by Application
- 8.1.1. LTCC Components
- 8.1.2. LTCC Substrate
- 8.2. Market Analysis, Insights and Forecast - by Types
- 8.2.1. LTCC Tape
- 8.2.2. Raw Material Powder
- 8.2.3. Other
- 8.1. Market Analysis, Insights and Forecast - by Application
- 9. Middle East & Africa Low Dielectric Loss LTCC Material Analysis, Insights and Forecast, 2020-2032
- 9.1. Market Analysis, Insights and Forecast - by Application
- 9.1.1. LTCC Components
- 9.1.2. LTCC Substrate
- 9.2. Market Analysis, Insights and Forecast - by Types
- 9.2.1. LTCC Tape
- 9.2.2. Raw Material Powder
- 9.2.3. Other
- 9.1. Market Analysis, Insights and Forecast - by Application
- 10. Asia Pacific Low Dielectric Loss LTCC Material Analysis, Insights and Forecast, 2020-2032
- 10.1. Market Analysis, Insights and Forecast - by Application
- 10.1.1. LTCC Components
- 10.1.2. LTCC Substrate
- 10.2. Market Analysis, Insights and Forecast - by Types
- 10.2.1. LTCC Tape
- 10.2.2. Raw Material Powder
- 10.2.3. Other
- 10.1. Market Analysis, Insights and Forecast - by Application
- 11. Competitive Analysis
- 11.1. Global Market Share Analysis 2025
- 11.2. Company Profiles
- 11.2.1 NEG
- 11.2.1.1. Overview
- 11.2.1.2. Products
- 11.2.1.3. SWOT Analysis
- 11.2.1.4. Recent Developments
- 11.2.1.5. Financials (Based on Availability)
- 11.2.2 Yamamura
- 11.2.2.1. Overview
- 11.2.2.2. Products
- 11.2.2.3. SWOT Analysis
- 11.2.2.4. Recent Developments
- 11.2.2.5. Financials (Based on Availability)
- 11.2.3 Heraeus
- 11.2.3.1. Overview
- 11.2.3.2. Products
- 11.2.3.3. SWOT Analysis
- 11.2.3.4. Recent Developments
- 11.2.3.5. Financials (Based on Availability)
- 11.2.4 Dupont
- 11.2.4.1. Overview
- 11.2.4.2. Products
- 11.2.4.3. SWOT Analysis
- 11.2.4.4. Recent Developments
- 11.2.4.5. Financials (Based on Availability)
- 11.2.5 Ferro
- 11.2.5.1. Overview
- 11.2.5.2. Products
- 11.2.5.3. SWOT Analysis
- 11.2.5.4. Recent Developments
- 11.2.5.5. Financials (Based on Availability)
- 11.2.6 Vibrantz
- 11.2.6.1. Overview
- 11.2.6.2. Products
- 11.2.6.3. SWOT Analysis
- 11.2.6.4. Recent Developments
- 11.2.6.5. Financials (Based on Availability)
- 11.2.7 Okamoto
- 11.2.7.1. Overview
- 11.2.7.2. Products
- 11.2.7.3. SWOT Analysis
- 11.2.7.4. Recent Developments
- 11.2.7.5. Financials (Based on Availability)
- 11.2.8 Siramic-Tech
- 11.2.8.1. Overview
- 11.2.8.2. Products
- 11.2.8.3. SWOT Analysis
- 11.2.8.4. Recent Developments
- 11.2.8.5. Financials (Based on Availability)
- 11.2.9 Beijing Tian Li Chuang Glass Technology Development
- 11.2.9.1. Overview
- 11.2.9.2. Products
- 11.2.9.3. SWOT Analysis
- 11.2.9.4. Recent Developments
- 11.2.9.5. Financials (Based on Availability)
- 11.2.1 NEG
List of Figures
- Figure 1: Global Low Dielectric Loss LTCC Material Revenue Breakdown (undefined, %) by Region 2025 & 2033
- Figure 2: Global Low Dielectric Loss LTCC Material Volume Breakdown (K, %) by Region 2025 & 2033
- Figure 3: North America Low Dielectric Loss LTCC Material Revenue (undefined), by Application 2025 & 2033
- Figure 4: North America Low Dielectric Loss LTCC Material Volume (K), by Application 2025 & 2033
- Figure 5: North America Low Dielectric Loss LTCC Material Revenue Share (%), by Application 2025 & 2033
- Figure 6: North America Low Dielectric Loss LTCC Material Volume Share (%), by Application 2025 & 2033
- Figure 7: North America Low Dielectric Loss LTCC Material Revenue (undefined), by Types 2025 & 2033
- Figure 8: North America Low Dielectric Loss LTCC Material Volume (K), by Types 2025 & 2033
- Figure 9: North America Low Dielectric Loss LTCC Material Revenue Share (%), by Types 2025 & 2033
- Figure 10: North America Low Dielectric Loss LTCC Material Volume Share (%), by Types 2025 & 2033
- Figure 11: North America Low Dielectric Loss LTCC Material Revenue (undefined), by Country 2025 & 2033
- Figure 12: North America Low Dielectric Loss LTCC Material Volume (K), by Country 2025 & 2033
- Figure 13: North America Low Dielectric Loss LTCC Material Revenue Share (%), by Country 2025 & 2033
- Figure 14: North America Low Dielectric Loss LTCC Material Volume Share (%), by Country 2025 & 2033
- Figure 15: South America Low Dielectric Loss LTCC Material Revenue (undefined), by Application 2025 & 2033
- Figure 16: South America Low Dielectric Loss LTCC Material Volume (K), by Application 2025 & 2033
- Figure 17: South America Low Dielectric Loss LTCC Material Revenue Share (%), by Application 2025 & 2033
- Figure 18: South America Low Dielectric Loss LTCC Material Volume Share (%), by Application 2025 & 2033
- Figure 19: South America Low Dielectric Loss LTCC Material Revenue (undefined), by Types 2025 & 2033
- Figure 20: South America Low Dielectric Loss LTCC Material Volume (K), by Types 2025 & 2033
- Figure 21: South America Low Dielectric Loss LTCC Material Revenue Share (%), by Types 2025 & 2033
- Figure 22: South America Low Dielectric Loss LTCC Material Volume Share (%), by Types 2025 & 2033
- Figure 23: South America Low Dielectric Loss LTCC Material Revenue (undefined), by Country 2025 & 2033
- Figure 24: South America Low Dielectric Loss LTCC Material Volume (K), by Country 2025 & 2033
- Figure 25: South America Low Dielectric Loss LTCC Material Revenue Share (%), by Country 2025 & 2033
- Figure 26: South America Low Dielectric Loss LTCC Material Volume Share (%), by Country 2025 & 2033
- Figure 27: Europe Low Dielectric Loss LTCC Material Revenue (undefined), by Application 2025 & 2033
- Figure 28: Europe Low Dielectric Loss LTCC Material Volume (K), by Application 2025 & 2033
- Figure 29: Europe Low Dielectric Loss LTCC Material Revenue Share (%), by Application 2025 & 2033
- Figure 30: Europe Low Dielectric Loss LTCC Material Volume Share (%), by Application 2025 & 2033
- Figure 31: Europe Low Dielectric Loss LTCC Material Revenue (undefined), by Types 2025 & 2033
- Figure 32: Europe Low Dielectric Loss LTCC Material Volume (K), by Types 2025 & 2033
- Figure 33: Europe Low Dielectric Loss LTCC Material Revenue Share (%), by Types 2025 & 2033
- Figure 34: Europe Low Dielectric Loss LTCC Material Volume Share (%), by Types 2025 & 2033
- Figure 35: Europe Low Dielectric Loss LTCC Material Revenue (undefined), by Country 2025 & 2033
- Figure 36: Europe Low Dielectric Loss LTCC Material Volume (K), by Country 2025 & 2033
- Figure 37: Europe Low Dielectric Loss LTCC Material Revenue Share (%), by Country 2025 & 2033
- Figure 38: Europe Low Dielectric Loss LTCC Material Volume Share (%), by Country 2025 & 2033
- Figure 39: Middle East & Africa Low Dielectric Loss LTCC Material Revenue (undefined), by Application 2025 & 2033
- Figure 40: Middle East & Africa Low Dielectric Loss LTCC Material Volume (K), by Application 2025 & 2033
- Figure 41: Middle East & Africa Low Dielectric Loss LTCC Material Revenue Share (%), by Application 2025 & 2033
- Figure 42: Middle East & Africa Low Dielectric Loss LTCC Material Volume Share (%), by Application 2025 & 2033
- Figure 43: Middle East & Africa Low Dielectric Loss LTCC Material Revenue (undefined), by Types 2025 & 2033
- Figure 44: Middle East & Africa Low Dielectric Loss LTCC Material Volume (K), by Types 2025 & 2033
- Figure 45: Middle East & Africa Low Dielectric Loss LTCC Material Revenue Share (%), by Types 2025 & 2033
- Figure 46: Middle East & Africa Low Dielectric Loss LTCC Material Volume Share (%), by Types 2025 & 2033
- Figure 47: Middle East & Africa Low Dielectric Loss LTCC Material Revenue (undefined), by Country 2025 & 2033
- Figure 48: Middle East & Africa Low Dielectric Loss LTCC Material Volume (K), by Country 2025 & 2033
- Figure 49: Middle East & Africa Low Dielectric Loss LTCC Material Revenue Share (%), by Country 2025 & 2033
- Figure 50: Middle East & Africa Low Dielectric Loss LTCC Material Volume Share (%), by Country 2025 & 2033
- Figure 51: Asia Pacific Low Dielectric Loss LTCC Material Revenue (undefined), by Application 2025 & 2033
- Figure 52: Asia Pacific Low Dielectric Loss LTCC Material Volume (K), by Application 2025 & 2033
- Figure 53: Asia Pacific Low Dielectric Loss LTCC Material Revenue Share (%), by Application 2025 & 2033
- Figure 54: Asia Pacific Low Dielectric Loss LTCC Material Volume Share (%), by Application 2025 & 2033
- Figure 55: Asia Pacific Low Dielectric Loss LTCC Material Revenue (undefined), by Types 2025 & 2033
- Figure 56: Asia Pacific Low Dielectric Loss LTCC Material Volume (K), by Types 2025 & 2033
- Figure 57: Asia Pacific Low Dielectric Loss LTCC Material Revenue Share (%), by Types 2025 & 2033
- Figure 58: Asia Pacific Low Dielectric Loss LTCC Material Volume Share (%), by Types 2025 & 2033
- Figure 59: Asia Pacific Low Dielectric Loss LTCC Material Revenue (undefined), by Country 2025 & 2033
- Figure 60: Asia Pacific Low Dielectric Loss LTCC Material Volume (K), by Country 2025 & 2033
- Figure 61: Asia Pacific Low Dielectric Loss LTCC Material Revenue Share (%), by Country 2025 & 2033
- Figure 62: Asia Pacific Low Dielectric Loss LTCC Material Volume Share (%), by Country 2025 & 2033
List of Tables
- Table 1: Global Low Dielectric Loss LTCC Material Revenue undefined Forecast, by Application 2020 & 2033
- Table 2: Global Low Dielectric Loss LTCC Material Volume K Forecast, by Application 2020 & 2033
- Table 3: Global Low Dielectric Loss LTCC Material Revenue undefined Forecast, by Types 2020 & 2033
- Table 4: Global Low Dielectric Loss LTCC Material Volume K Forecast, by Types 2020 & 2033
- Table 5: Global Low Dielectric Loss LTCC Material Revenue undefined Forecast, by Region 2020 & 2033
- Table 6: Global Low Dielectric Loss LTCC Material Volume K Forecast, by Region 2020 & 2033
- Table 7: Global Low Dielectric Loss LTCC Material Revenue undefined Forecast, by Application 2020 & 2033
- Table 8: Global Low Dielectric Loss LTCC Material Volume K Forecast, by Application 2020 & 2033
- Table 9: Global Low Dielectric Loss LTCC Material Revenue undefined Forecast, by Types 2020 & 2033
- Table 10: Global Low Dielectric Loss LTCC Material Volume K Forecast, by Types 2020 & 2033
- Table 11: Global Low Dielectric Loss LTCC Material Revenue undefined Forecast, by Country 2020 & 2033
- Table 12: Global Low Dielectric Loss LTCC Material Volume K Forecast, by Country 2020 & 2033
- Table 13: United States Low Dielectric Loss LTCC Material Revenue (undefined) Forecast, by Application 2020 & 2033
- Table 14: United States Low Dielectric Loss LTCC Material Volume (K) Forecast, by Application 2020 & 2033
- Table 15: Canada Low Dielectric Loss LTCC Material Revenue (undefined) Forecast, by Application 2020 & 2033
- Table 16: Canada Low Dielectric Loss LTCC Material Volume (K) Forecast, by Application 2020 & 2033
- Table 17: Mexico Low Dielectric Loss LTCC Material Revenue (undefined) Forecast, by Application 2020 & 2033
- Table 18: Mexico Low Dielectric Loss LTCC Material Volume (K) Forecast, by Application 2020 & 2033
- Table 19: Global Low Dielectric Loss LTCC Material Revenue undefined Forecast, by Application 2020 & 2033
- Table 20: Global Low Dielectric Loss LTCC Material Volume K Forecast, by Application 2020 & 2033
- Table 21: Global Low Dielectric Loss LTCC Material Revenue undefined Forecast, by Types 2020 & 2033
- Table 22: Global Low Dielectric Loss LTCC Material Volume K Forecast, by Types 2020 & 2033
- Table 23: Global Low Dielectric Loss LTCC Material Revenue undefined Forecast, by Country 2020 & 2033
- Table 24: Global Low Dielectric Loss LTCC Material Volume K Forecast, by Country 2020 & 2033
- Table 25: Brazil Low Dielectric Loss LTCC Material Revenue (undefined) Forecast, by Application 2020 & 2033
- Table 26: Brazil Low Dielectric Loss LTCC Material Volume (K) Forecast, by Application 2020 & 2033
- Table 27: Argentina Low Dielectric Loss LTCC Material Revenue (undefined) Forecast, by Application 2020 & 2033
- Table 28: Argentina Low Dielectric Loss LTCC Material Volume (K) Forecast, by Application 2020 & 2033
- Table 29: Rest of South America Low Dielectric Loss LTCC Material Revenue (undefined) Forecast, by Application 2020 & 2033
- Table 30: Rest of South America Low Dielectric Loss LTCC Material Volume (K) Forecast, by Application 2020 & 2033
- Table 31: Global Low Dielectric Loss LTCC Material Revenue undefined Forecast, by Application 2020 & 2033
- Table 32: Global Low Dielectric Loss LTCC Material Volume K Forecast, by Application 2020 & 2033
- Table 33: Global Low Dielectric Loss LTCC Material Revenue undefined Forecast, by Types 2020 & 2033
- Table 34: Global Low Dielectric Loss LTCC Material Volume K Forecast, by Types 2020 & 2033
- Table 35: Global Low Dielectric Loss LTCC Material Revenue undefined Forecast, by Country 2020 & 2033
- Table 36: Global Low Dielectric Loss LTCC Material Volume K Forecast, by Country 2020 & 2033
- Table 37: United Kingdom Low Dielectric Loss LTCC Material Revenue (undefined) Forecast, by Application 2020 & 2033
- Table 38: United Kingdom Low Dielectric Loss LTCC Material Volume (K) Forecast, by Application 2020 & 2033
- Table 39: Germany Low Dielectric Loss LTCC Material Revenue (undefined) Forecast, by Application 2020 & 2033
- Table 40: Germany Low Dielectric Loss LTCC Material Volume (K) Forecast, by Application 2020 & 2033
- Table 41: France Low Dielectric Loss LTCC Material Revenue (undefined) Forecast, by Application 2020 & 2033
- Table 42: France Low Dielectric Loss LTCC Material Volume (K) Forecast, by Application 2020 & 2033
- Table 43: Italy Low Dielectric Loss LTCC Material Revenue (undefined) Forecast, by Application 2020 & 2033
- Table 44: Italy Low Dielectric Loss LTCC Material Volume (K) Forecast, by Application 2020 & 2033
- Table 45: Spain Low Dielectric Loss LTCC Material Revenue (undefined) Forecast, by Application 2020 & 2033
- Table 46: Spain Low Dielectric Loss LTCC Material Volume (K) Forecast, by Application 2020 & 2033
- Table 47: Russia Low Dielectric Loss LTCC Material Revenue (undefined) Forecast, by Application 2020 & 2033
- Table 48: Russia Low Dielectric Loss LTCC Material Volume (K) Forecast, by Application 2020 & 2033
- Table 49: Benelux Low Dielectric Loss LTCC Material Revenue (undefined) Forecast, by Application 2020 & 2033
- Table 50: Benelux Low Dielectric Loss LTCC Material Volume (K) Forecast, by Application 2020 & 2033
- Table 51: Nordics Low Dielectric Loss LTCC Material Revenue (undefined) Forecast, by Application 2020 & 2033
- Table 52: Nordics Low Dielectric Loss LTCC Material Volume (K) Forecast, by Application 2020 & 2033
- Table 53: Rest of Europe Low Dielectric Loss LTCC Material Revenue (undefined) Forecast, by Application 2020 & 2033
- Table 54: Rest of Europe Low Dielectric Loss LTCC Material Volume (K) Forecast, by Application 2020 & 2033
- Table 55: Global Low Dielectric Loss LTCC Material Revenue undefined Forecast, by Application 2020 & 2033
- Table 56: Global Low Dielectric Loss LTCC Material Volume K Forecast, by Application 2020 & 2033
- Table 57: Global Low Dielectric Loss LTCC Material Revenue undefined Forecast, by Types 2020 & 2033
- Table 58: Global Low Dielectric Loss LTCC Material Volume K Forecast, by Types 2020 & 2033
- Table 59: Global Low Dielectric Loss LTCC Material Revenue undefined Forecast, by Country 2020 & 2033
- Table 60: Global Low Dielectric Loss LTCC Material Volume K Forecast, by Country 2020 & 2033
- Table 61: Turkey Low Dielectric Loss LTCC Material Revenue (undefined) Forecast, by Application 2020 & 2033
- Table 62: Turkey Low Dielectric Loss LTCC Material Volume (K) Forecast, by Application 2020 & 2033
- Table 63: Israel Low Dielectric Loss LTCC Material Revenue (undefined) Forecast, by Application 2020 & 2033
- Table 64: Israel Low Dielectric Loss LTCC Material Volume (K) Forecast, by Application 2020 & 2033
- Table 65: GCC Low Dielectric Loss LTCC Material Revenue (undefined) Forecast, by Application 2020 & 2033
- Table 66: GCC Low Dielectric Loss LTCC Material Volume (K) Forecast, by Application 2020 & 2033
- Table 67: North Africa Low Dielectric Loss LTCC Material Revenue (undefined) Forecast, by Application 2020 & 2033
- Table 68: North Africa Low Dielectric Loss LTCC Material Volume (K) Forecast, by Application 2020 & 2033
- Table 69: South Africa Low Dielectric Loss LTCC Material Revenue (undefined) Forecast, by Application 2020 & 2033
- Table 70: South Africa Low Dielectric Loss LTCC Material Volume (K) Forecast, by Application 2020 & 2033
- Table 71: Rest of Middle East & Africa Low Dielectric Loss LTCC Material Revenue (undefined) Forecast, by Application 2020 & 2033
- Table 72: Rest of Middle East & Africa Low Dielectric Loss LTCC Material Volume (K) Forecast, by Application 2020 & 2033
- Table 73: Global Low Dielectric Loss LTCC Material Revenue undefined Forecast, by Application 2020 & 2033
- Table 74: Global Low Dielectric Loss LTCC Material Volume K Forecast, by Application 2020 & 2033
- Table 75: Global Low Dielectric Loss LTCC Material Revenue undefined Forecast, by Types 2020 & 2033
- Table 76: Global Low Dielectric Loss LTCC Material Volume K Forecast, by Types 2020 & 2033
- Table 77: Global Low Dielectric Loss LTCC Material Revenue undefined Forecast, by Country 2020 & 2033
- Table 78: Global Low Dielectric Loss LTCC Material Volume K Forecast, by Country 2020 & 2033
- Table 79: China Low Dielectric Loss LTCC Material Revenue (undefined) Forecast, by Application 2020 & 2033
- Table 80: China Low Dielectric Loss LTCC Material Volume (K) Forecast, by Application 2020 & 2033
- Table 81: India Low Dielectric Loss LTCC Material Revenue (undefined) Forecast, by Application 2020 & 2033
- Table 82: India Low Dielectric Loss LTCC Material Volume (K) Forecast, by Application 2020 & 2033
- Table 83: Japan Low Dielectric Loss LTCC Material Revenue (undefined) Forecast, by Application 2020 & 2033
- Table 84: Japan Low Dielectric Loss LTCC Material Volume (K) Forecast, by Application 2020 & 2033
- Table 85: South Korea Low Dielectric Loss LTCC Material Revenue (undefined) Forecast, by Application 2020 & 2033
- Table 86: South Korea Low Dielectric Loss LTCC Material Volume (K) Forecast, by Application 2020 & 2033
- Table 87: ASEAN Low Dielectric Loss LTCC Material Revenue (undefined) Forecast, by Application 2020 & 2033
- Table 88: ASEAN Low Dielectric Loss LTCC Material Volume (K) Forecast, by Application 2020 & 2033
- Table 89: Oceania Low Dielectric Loss LTCC Material Revenue (undefined) Forecast, by Application 2020 & 2033
- Table 90: Oceania Low Dielectric Loss LTCC Material Volume (K) Forecast, by Application 2020 & 2033
- Table 91: Rest of Asia Pacific Low Dielectric Loss LTCC Material Revenue (undefined) Forecast, by Application 2020 & 2033
- Table 92: Rest of Asia Pacific Low Dielectric Loss LTCC Material Volume (K) Forecast, by Application 2020 & 2033
Frequently Asked Questions
1. What is the projected Compound Annual Growth Rate (CAGR) of the Low Dielectric Loss LTCC Material?
The projected CAGR is approximately 8%.
2. Which companies are prominent players in the Low Dielectric Loss LTCC Material?
Key companies in the market include NEG, Yamamura, Heraeus, Dupont, Ferro, Vibrantz, Okamoto, Siramic-Tech, Beijing Tian Li Chuang Glass Technology Development.
3. What are the main segments of the Low Dielectric Loss LTCC Material?
The market segments include Application, Types.
4. Can you provide details about the market size?
The market size is estimated to be USD XXX N/A as of 2022.
5. What are some drivers contributing to market growth?
N/A
6. What are the notable trends driving market growth?
N/A
7. Are there any restraints impacting market growth?
N/A
8. Can you provide examples of recent developments in the market?
N/A
9. What pricing options are available for accessing the report?
Pricing options include single-user, multi-user, and enterprise licenses priced at USD 3950.00, USD 5925.00, and USD 7900.00 respectively.
10. Is the market size provided in terms of value or volume?
The market size is provided in terms of value, measured in N/A and volume, measured in K.
11. Are there any specific market keywords associated with the report?
Yes, the market keyword associated with the report is "Low Dielectric Loss LTCC Material," which aids in identifying and referencing the specific market segment covered.
12. How do I determine which pricing option suits my needs best?
The pricing options vary based on user requirements and access needs. Individual users may opt for single-user licenses, while businesses requiring broader access may choose multi-user or enterprise licenses for cost-effective access to the report.
13. Are there any additional resources or data provided in the Low Dielectric Loss LTCC Material report?
While the report offers comprehensive insights, it's advisable to review the specific contents or supplementary materials provided to ascertain if additional resources or data are available.
14. How can I stay updated on further developments or reports in the Low Dielectric Loss LTCC Material?
To stay informed about further developments, trends, and reports in the Low Dielectric Loss LTCC Material, consider subscribing to industry newsletters, following relevant companies and organizations, or regularly checking reputable industry news sources and publications.
Methodology
Step 1 - Identification of Relevant Samples Size from Population Database


Step 2 - Approaches for Defining Global Market Size (Value, Volume* & Price*)

Note*: In applicable scenarios
Step 3 - Data Sources
Primary Research
- Web Analytics
- Survey Reports
- Research Institute
- Latest Research Reports
- Opinion Leaders
Secondary Research
- Annual Reports
- White Paper
- Latest Press Release
- Industry Association
- Paid Database
- Investor Presentations

Step 4 - Data Triangulation
Involves using different sources of information in order to increase the validity of a study
These sources are likely to be stakeholders in a program - participants, other researchers, program staff, other community members, and so on.
Then we put all data in single framework & apply various statistical tools to find out the dynamic on the market.
During the analysis stage, feedback from the stakeholder groups would be compared to determine areas of agreement as well as areas of divergence