

Key Insights
The global Low-Calorie Sweeteners Market is poised for significant expansion, with an estimated market size of $32.9 billion in 2025. The market is projected to grow at a robust Compound Annual Growth Rate (CAGR) of 4.7% during the forecast period of 2025-2033, reflecting a sustained demand for healthier food and beverage alternatives. This growth is primarily driven by increasing consumer awareness regarding the adverse health effects of excessive sugar consumption, including obesity, diabetes, and cardiovascular diseases. Consequently, there's a burgeoning preference for sugar substitutes that offer similar taste profiles without the caloric impact. Regulatory bodies in various regions are also supporting the adoption of low-calorie sweeteners through approvals and guidelines, further bolstering market confidence. The expanding food and beverage industry, coupled with advancements in sweetener production technologies, is creating new opportunities for market players.
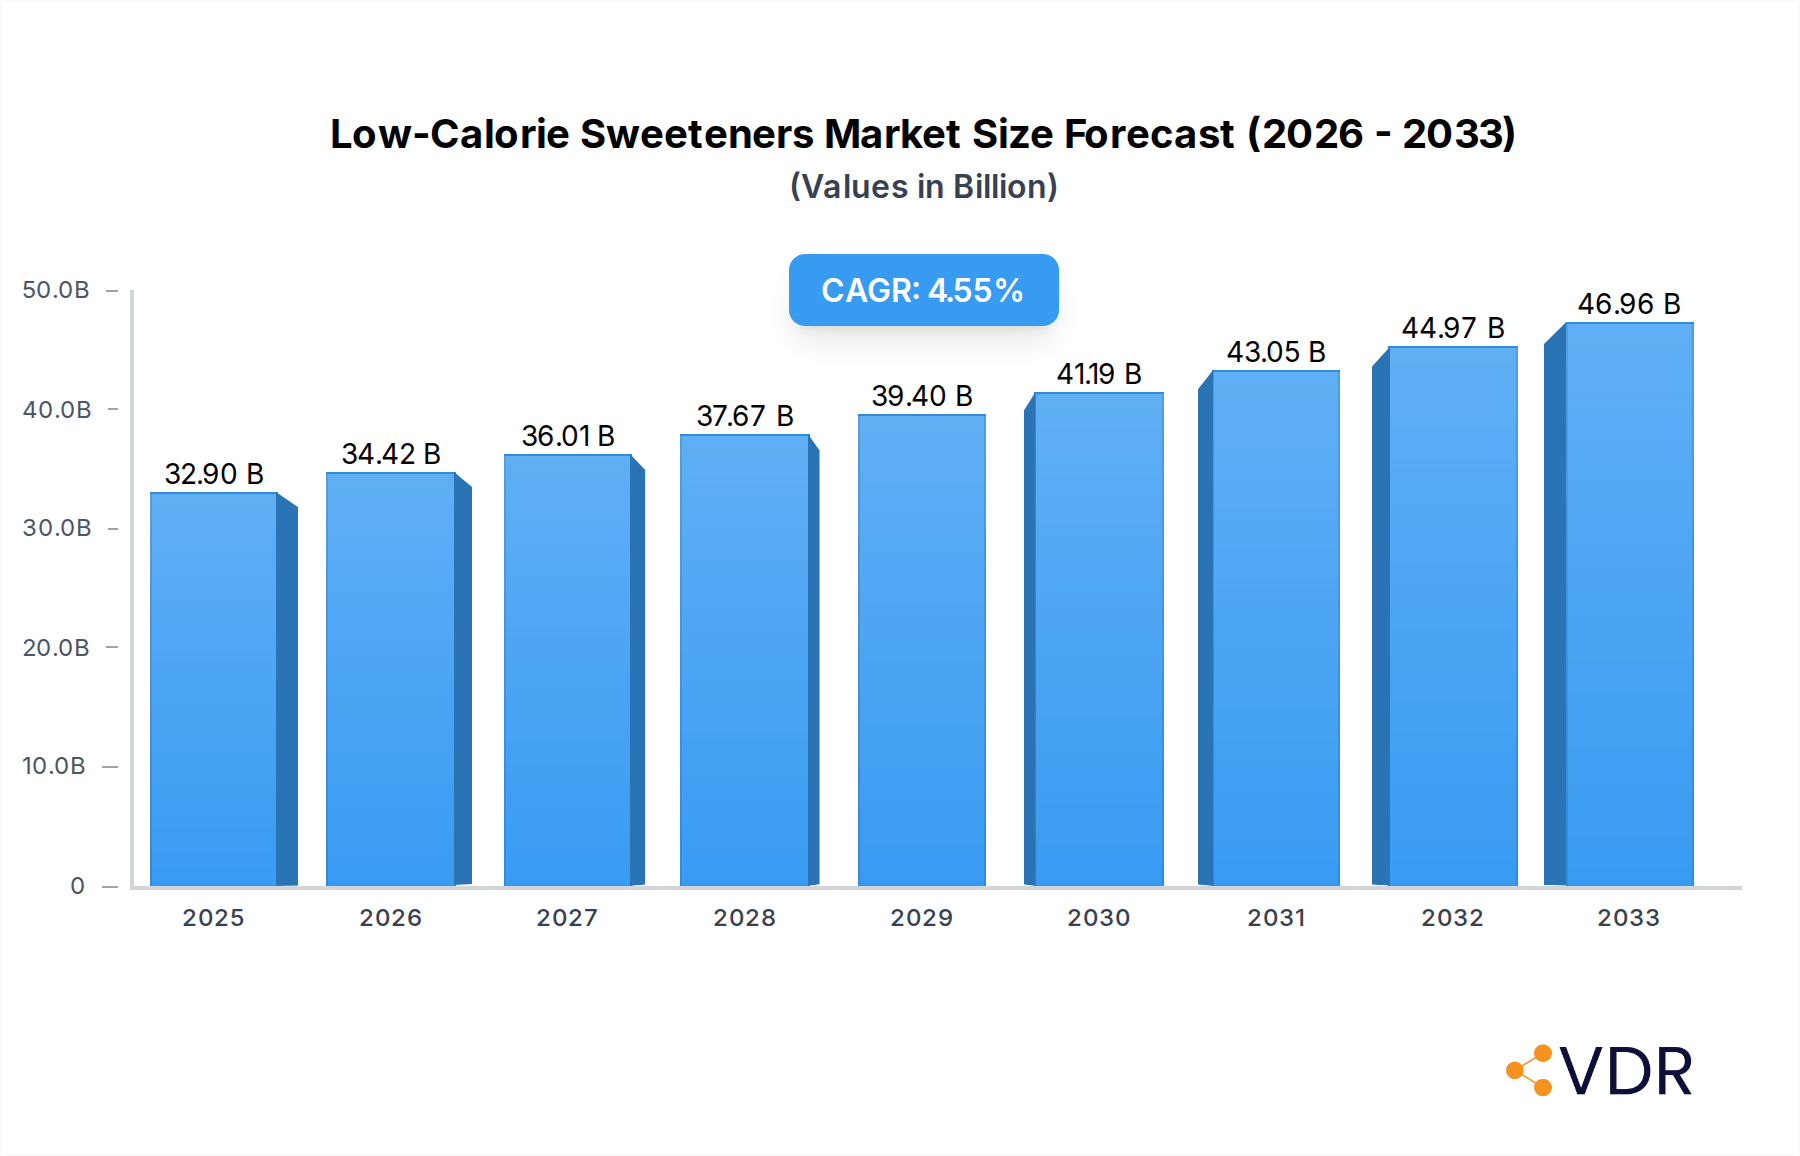
Low-Calorie Sweeteners Market Market Size (In Billion)
Key trends shaping the market include the rising popularity of naturally derived sweeteners like Stevia, catering to the clean-label movement and consumer preference for ingredients perceived as healthier and more sustainable. Innovations in blending different types of low-calorie sweeteners are also enabling manufacturers to achieve more desirable taste profiles and functionalities. The pharmaceutical sector is witnessing increased utilization of these sweeteners for sugar-free formulations, particularly in medicines aimed at diabetic patients and weight management. Despite the positive outlook, challenges such as potential consumer concerns about the long-term health effects of artificial sweeteners and stringent regulatory approvals for new ingredients can act as restraints. However, the overarching demand for reduced-calorie products, driven by global health initiatives and lifestyle changes, is expected to maintain a strong upward trajectory for the low-calorie sweeteners market.

Low-Calorie Sweeteners Market Company Market Share
Low-Calorie Sweeteners Market: Revolutionizing Sweetness for a Healthier Future
This comprehensive report delves into the dynamic low-calorie sweeteners market, offering unparalleled insights into its intricate structure, growth trajectory, and future potential. With a study period spanning 2019-2033, our analysis leverages the base year of 2025 to provide a robust forecast for the period 2025-2033, building upon historical data from 2019-2024. This report is meticulously crafted for industry professionals seeking a competitive edge in the burgeoning sugar substitute market. We dissect parent and child market dynamics, identifying key influencers and emerging trends to empower strategic decision-making. Discover the latest innovations, regulatory shifts, and competitive landscapes shaping this vital sector, all presented with key values in billions of USD.
Low-Calorie Sweeteners Market Dynamics & Structure
The low-calorie sweeteners market is characterized by a moderately concentrated landscape, driven by continuous technological innovation and evolving regulatory frameworks. Key drivers include the escalating global concern over obesity and diabetes, fueling demand for sugar-free alternatives. Competitive product substitutes range from naturally derived sweeteners like stevia and monk fruit to synthetic options such as aspartame and sucralose, each vying for market share based on taste profiles, cost-effectiveness, and perceived health benefits. End-user demographics are broad, encompassing health-conscious consumers, individuals managing chronic conditions, and the food and beverage industry seeking to reformulate products for reduced sugar content. Mergers and acquisitions (M&A) trends indicate strategic consolidation, with larger players acquiring innovative startups to enhance their product portfolios and expand geographical reach. For instance, the market has witnessed a XX% increase in M&A deal volumes over the historical period, reflecting a drive for vertical integration and enhanced R&D capabilities. Innovation barriers, such as the development of sweeteners with taste profiles closely mimicking sugar and ensuring stability across diverse food matrices, remain significant.
Low-Calorie Sweeteners Market Growth Trends & Insights
The low-calorie sweeteners market is poised for substantial growth, projected to reach $XX billion by 2033, exhibiting a Compound Annual Growth Rate (CAGR) of XX% during the forecast period. This expansion is propelled by a confluence of factors including rising health awareness and government initiatives promoting sugar reduction. The adoption rates of low-calorie sweeteners have significantly increased across major economies, driven by their incorporation into a wide array of products. Technological disruptions, particularly in the extraction and purification of natural sweeteners like stevia, are enhancing their appeal and cost-competitiveness. Consumer behavior is shifting demonstrably, with a growing preference for natural sweeteners and products labeled "sugar-free" or "reduced sugar." Market penetration of stevia sweeteners has surged by XX% over the past five years, outpacing synthetic alternatives in certain segments. The high-intensity sweeteners market is also witnessing robust demand, as manufacturers optimize product formulations for both taste and functionality. Innovations in taste modulation and solubility are further accelerating adoption, making these sweeteners viable replacements for sugar in challenging applications like baked goods and dairy products. The ongoing pursuit of healthier lifestyle choices globally serves as a foundational element for sustained market expansion.
Dominant Regions, Countries, or Segments in Low-Calorie Sweeteners Market
North America currently dominates the low-calorie sweeteners market, driven by a strong consumer preference for health and wellness products and robust regulatory support for sugar reduction. The United States, in particular, represents a significant market share of approximately XX% within the region, owing to a well-established food and beverage industry with a proactive approach to product reformulation. The natural sweeteners segment, primarily stevia, is a key growth driver in this region, accounting for an estimated XX% of the total market value. This dominance is further bolstered by substantial investments in research and development by leading companies like Cargill and Ingredion, focusing on enhancing the taste and application versatility of natural sweeteners.
Key drivers for North America's leadership include:
- Consumer Demand: A pervasive health-conscious consumer base actively seeks sugar substitutes to manage weight and prevent diet-related diseases.
- Regulatory Support: Favorable government policies and labeling guidelines encourage the use and marketing of low-calorie sweeteners.
- Industry Innovation: Continuous product development and launches from major players are expanding the application scope of these sweeteners.
Within the type segment, stevia stands out, projected to capture over XX% of the market by 2033 due to its zero-calorie profile and natural origin. The application segment of beverages represents the largest consumer of low-calorie sweeteners, accounting for an estimated XX% of the market, followed closely by foods, particularly confectionery and bakery items. The Asia-Pacific region is emerging as a high-growth area, propelled by increasing disposable incomes and a growing awareness of health issues.
Low-Calorie Sweeteners Market Product Landscape
The low-calorie sweeteners market is defined by a vibrant product landscape characterized by relentless innovation. Companies are actively developing next-generation sweeteners with improved taste profiles, enhanced solubility, and broader application compatibility. For example, the introduction of liquid stevia-based sweeteners by Sweegen, designed for a variety of food and beverage applications, signifies a move towards greater convenience and formulation flexibility. Furthermore, advancements in blending technologies, such as Cargill's EverSweet + ClearFlo, enable the creation of customized sweetening solutions that mimic sugar's taste and texture more closely, while offering superior functional benefits like improved solubility and stability. The focus remains on providing high-intensity sweeteners that deliver cost-effective sweetening solutions without compromising on sensory experience.
Key Drivers, Barriers & Challenges in Low-Calorie Sweeteners Market
The low-calorie sweeteners market is propelled by several key drivers. Growing global health consciousness, rising obesity rates, and increasing prevalence of lifestyle diseases like diabetes are major forces pushing consumers and manufacturers towards sugar reduction strategies. Technological advancements in the production of both natural and synthetic sweeteners, leading to improved taste, functionality, and cost-effectiveness, further fuel market expansion. Government initiatives promoting healthier food choices and stricter regulations on sugar content in food products also act as significant accelerators.
However, the market faces notable barriers and challenges. Consumer perception regarding the safety and naturalness of synthetic sweeteners remains a concern, influencing purchasing decisions. The development of off-tastes or aftertastes in some low-calorie sweeteners continues to be a formulation challenge. Supply chain disruptions, particularly for natural ingredients, and volatile raw material prices can impact production costs and availability. Intense competition among various sweetener types and established sugar producers also presents a constant challenge, demanding continuous innovation and aggressive marketing strategies.
Emerging Opportunities in Low-Calorie Sweeteners Market
Emerging opportunities in the low-calorie sweeteners market are abundant, driven by evolving consumer preferences and technological advancements. The demand for clean-label ingredients and plant-based alternatives is creating significant potential for natural sweeteners derived from sources like stevia and monk fruit. Innovations in synergistic blending of sweeteners to achieve a more sugar-like taste and mouthfeel represent a key growth avenue. Furthermore, the increasing adoption of low-calorie sweeteners in emerging markets in Asia and Latin America, fueled by rising disposable incomes and health awareness, offers untapped potential. The development of functional sweeteners that offer additional health benefits beyond sweetness, such as prebiotic properties, also presents an exciting frontier for market expansion.
Growth Accelerators in the Low-Calorie Sweeteners Market Industry
Several catalysts are accelerating long-term growth in the low-calorie sweeteners market. Technological breakthroughs in biotechnology and fermentation processes are enabling more efficient and sustainable production of high-purity sweeteners, reducing costs and enhancing availability. Strategic partnerships and collaborations between ingredient suppliers, food and beverage manufacturers, and research institutions are fostering innovation and market penetration. For instance, supply agreements for stevia production are ensuring a consistent and reliable supply chain. Furthermore, market expansion strategies targeting developing economies, where the burden of lifestyle diseases is increasing, are opening up new revenue streams. The continuous development of new applications for low-calorie sweeteners, moving beyond traditional beverages and into areas like savory foods and pharmaceutical formulations, will also significantly boost growth.
Key Players Shaping the Low-Calorie Sweeteners Market Market
- Cargill Incorporated
- Dupont
- Archer Daniels Midland Company
- PureCircle
- NutraSweet Co
- Ingredion Incorporated
- JK Sucralose Inc
- Roquette Freres
- Ajinomoto Health & Nutrition North America Inc
- Tate & Lyle
Notable Milestones in Low-Calorie Sweeteners Market Sector
- Jul 2022: Sweegen launched Bestevia LQ, a collection of liquid stevia-based sweeteners, at IFT FIRST, designed to lower sugar in concentrated fruit/flavored syrup, confectionary, liquid sweeteners, dessert toppings, and carbonated soft beverages.
- Mar 2022: Cargill announced the commercial availability of its flagship stevia sweetener technology, EverSweet + ClearFlo, enabling blending with other all-natural tastes for improved flavor alteration, solubility, formulation stability, and quicker dissolving.
- Sept 2021: Ingredion Incorporated and S&W Seed Company entered a United States exclusive stevia pilot production supply agreement, with S&W Seed Company leveraging its proprietary stevia plant portfolio and production techniques to supply Ingredion and its PureCircle by Ingredion group.
- Apr 2021: Manus Bio Inc. launched NutraSweet Natural™, a plant-based, zero-calorie sweetener with high sweetening power.
In-Depth Low-Calorie Sweeteners Market Market Outlook
The future outlook for the low-calorie sweeteners market is exceptionally bright, driven by persistent global trends towards healthier living and innovative product development. Growth accelerators, including advancements in natural sweetener extraction and purification, alongside sophisticated blending technologies, will continue to expand the application spectrum and consumer acceptance. Strategic partnerships and investments in emerging markets are poised to unlock substantial untapped potential. The market is expected to witness sustained innovation in creating sweeteners that not only reduce calories but also offer functional health benefits, further solidifying their position as indispensable ingredients in the global food and beverage industry. The increasing focus on sustainability and clean-label formulations will undoubtedly favor naturally derived sugar substitutes.
Low-Calorie Sweeteners Market Segmentation
-
1. Source
- 1.1. Natural
- 1.2. Synthetic
-
2. Type
- 2.1. Sucralose
- 2.2. Saccharin
- 2.3. Aspartame
- 2.4. Neotame
- 2.5. Advantam
- 2.6. Acesulfame Potassium
- 2.7. Stevia
- 2.8. Other Types
-
3. Application
-
3.1. Foods
- 3.1.1. Bakery
- 3.1.2. Frozen Food and Dairy
- 3.1.3. Confectionery
- 3.1.4. Other Applications
- 3.2. Beverages
- 3.3. Pharmaceuticals
- 3.4. Other Beverages
-
3.1. Foods
Low-Calorie Sweeteners Market Segmentation By Geography
-
1. North America
- 1.1. United States
- 1.2. Canada
- 1.3. Mexico
- 1.4. Rest of North America
-
2. Europe
- 2.1. United Kingdom
- 2.2. Germany
- 2.3. Spain
- 2.4. France
- 2.5. Italy
- 2.6. Russia
- 2.7. Rest of Europe
-
3. Asia Pacific
- 3.1. China
- 3.2. Japan
- 3.3. India
- 3.4. Australia
- 3.5. Rest of Asia Pacific
-
4. South America
- 4.1. Brazil
- 4.2. Argentina
- 4.3. Rest of South America
-
5. Middle East and Africa
- 5.1. Saudi Arabia
- 5.2. South Africa
- 5.3. Rest of Middle East and Africa
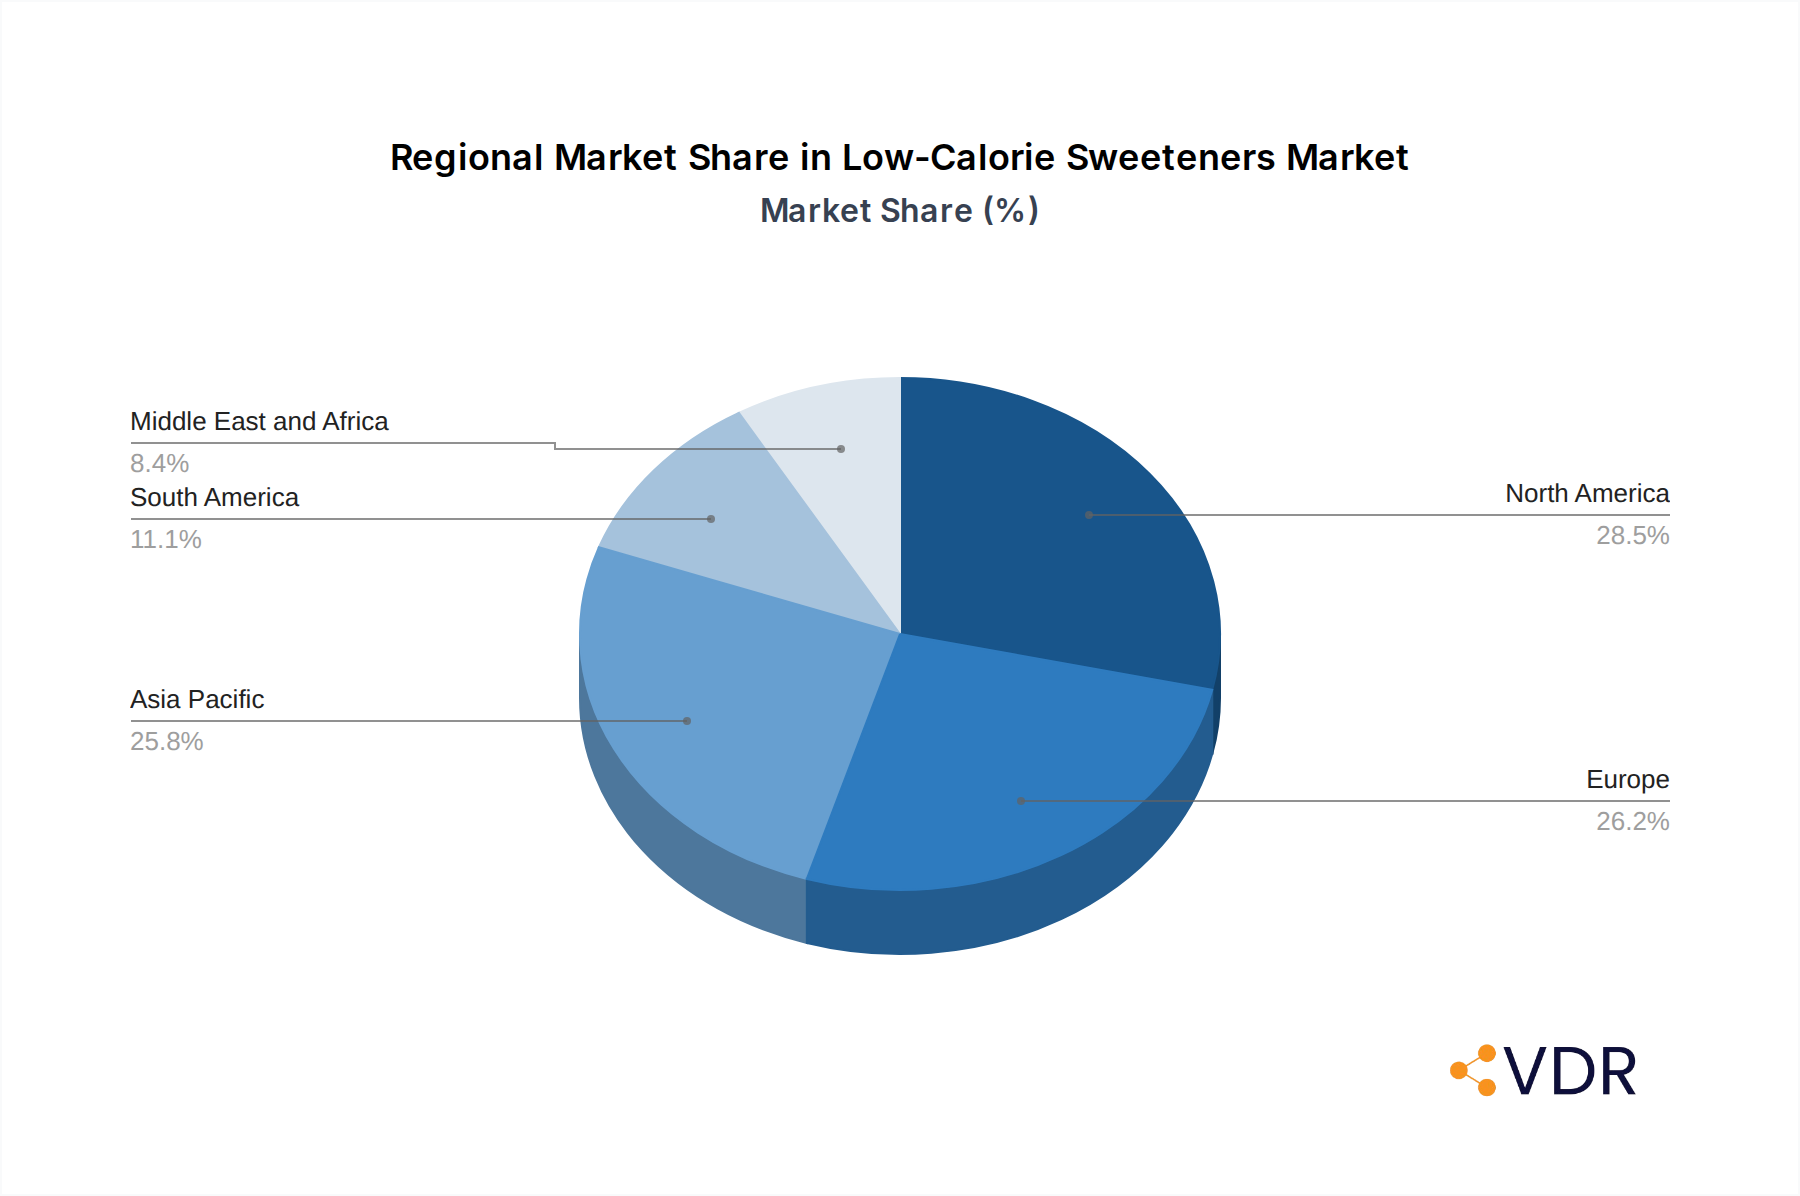
Low-Calorie Sweeteners Market Regional Market Share
Geographic Coverage of Low-Calorie Sweeteners Market
Low-Calorie Sweeteners Market REPORT HIGHLIGHTS
| Aspects | Details |
|---|---|
| Study Period | 2020-2034 |
| Base Year | 2025 |
| Estimated Year | 2026 |
| Forecast Period | 2026-2034 |
| Historical Period | 2020-2025 |
| Growth Rate | CAGR of 4.7% from 2020-2034 |
| Segmentation |
|
Table of Contents
- 1. Introduction
- 1.1. Research Scope
- 1.2. Market Segmentation
- 1.3. Research Objective
- 1.4. Definitions and Assumptions
- 2. Executive Summary
- 2.1. Market Snapshot
- 3. Market Dynamics
- 3.1. Market Drivers
- 3.2. Market Restrains
- 3.3. Market Trends
- 3.4. Market Opportunities
- 4. Market Factor Analysis
- 4.1. Porters Five Forces
- 4.1.1. Bargaining Power of Suppliers
- 4.1.2. Bargaining Power of Buyers
- 4.1.3. Threat of New Entrants
- 4.1.4. Threat of Substitutes
- 4.1.5. Competitive Rivalry
- 4.2. PESTEL analysis
- 4.3. BCG Analysis
- 4.3.1. Stars (High Growth, High Market Share)
- 4.3.2. Cash Cows (Low Growth, High Market Share)
- 4.3.3. Question Mark (High Growth, Low Market Share)
- 4.3.4. Dogs (Low Growth, Low Market Share)
- 4.4. Ansoff Matrix Analysis
- 4.5. Supply Chain Analysis
- 4.6. Regulatory Landscape
- 4.7. Current Market Potential and Opportunity Assessment (TAM–SAM–SOM Framework)
- 4.8. VDR Analyst Note
- 4.1. Porters Five Forces
- 5. Market Analysis, Insights and Forecast 2021-2033
- 5.1. Market Analysis, Insights and Forecast - by Source
- 5.1.1. Natural
- 5.1.2. Synthetic
- 5.2. Market Analysis, Insights and Forecast - by Type
- 5.2.1. Sucralose
- 5.2.2. Saccharin
- 5.2.3. Aspartame
- 5.2.4. Neotame
- 5.2.5. Advantam
- 5.2.6. Acesulfame Potassium
- 5.2.7. Stevia
- 5.2.8. Other Types
- 5.3. Market Analysis, Insights and Forecast - by Application
- 5.3.1. Foods
- 5.3.1.1. Bakery
- 5.3.1.2. Frozen Food and Dairy
- 5.3.1.3. Confectionery
- 5.3.1.4. Other Applications
- 5.3.2. Beverages
- 5.3.3. Pharmaceuticals
- 5.3.4. Other Beverages
- 5.3.1. Foods
- 5.4. Market Analysis, Insights and Forecast - by Region
- 5.4.1. North America
- 5.4.2. Europe
- 5.4.3. Asia Pacific
- 5.4.4. South America
- 5.4.5. Middle East and Africa
- 5.1. Market Analysis, Insights and Forecast - by Source
- 6. Global Low-Calorie Sweeteners Market Analysis, Insights and Forecast, 2021-2033
- 6.1. Market Analysis, Insights and Forecast - by Source
- 6.1.1. Natural
- 6.1.2. Synthetic
- 6.2. Market Analysis, Insights and Forecast - by Type
- 6.2.1. Sucralose
- 6.2.2. Saccharin
- 6.2.3. Aspartame
- 6.2.4. Neotame
- 6.2.5. Advantam
- 6.2.6. Acesulfame Potassium
- 6.2.7. Stevia
- 6.2.8. Other Types
- 6.3. Market Analysis, Insights and Forecast - by Application
- 6.3.1. Foods
- 6.3.1.1. Bakery
- 6.3.1.2. Frozen Food and Dairy
- 6.3.1.3. Confectionery
- 6.3.1.4. Other Applications
- 6.3.2. Beverages
- 6.3.3. Pharmaceuticals
- 6.3.4. Other Beverages
- 6.3.1. Foods
- 6.1. Market Analysis, Insights and Forecast - by Source
- 7. North America Low-Calorie Sweeteners Market Analysis, Insights and Forecast, 2021-2033
- 7.1. Market Analysis, Insights and Forecast - by Source
- 7.1.1. Natural
- 7.1.2. Synthetic
- 7.2. Market Analysis, Insights and Forecast - by Type
- 7.2.1. Sucralose
- 7.2.2. Saccharin
- 7.2.3. Aspartame
- 7.2.4. Neotame
- 7.2.5. Advantam
- 7.2.6. Acesulfame Potassium
- 7.2.7. Stevia
- 7.2.8. Other Types
- 7.3. Market Analysis, Insights and Forecast - by Application
- 7.3.1. Foods
- 7.3.1.1. Bakery
- 7.3.1.2. Frozen Food and Dairy
- 7.3.1.3. Confectionery
- 7.3.1.4. Other Applications
- 7.3.2. Beverages
- 7.3.3. Pharmaceuticals
- 7.3.4. Other Beverages
- 7.3.1. Foods
- 7.1. Market Analysis, Insights and Forecast - by Source
- 8. Europe Low-Calorie Sweeteners Market Analysis, Insights and Forecast, 2021-2033
- 8.1. Market Analysis, Insights and Forecast - by Source
- 8.1.1. Natural
- 8.1.2. Synthetic
- 8.2. Market Analysis, Insights and Forecast - by Type
- 8.2.1. Sucralose
- 8.2.2. Saccharin
- 8.2.3. Aspartame
- 8.2.4. Neotame
- 8.2.5. Advantam
- 8.2.6. Acesulfame Potassium
- 8.2.7. Stevia
- 8.2.8. Other Types
- 8.3. Market Analysis, Insights and Forecast - by Application
- 8.3.1. Foods
- 8.3.1.1. Bakery
- 8.3.1.2. Frozen Food and Dairy
- 8.3.1.3. Confectionery
- 8.3.1.4. Other Applications
- 8.3.2. Beverages
- 8.3.3. Pharmaceuticals
- 8.3.4. Other Beverages
- 8.3.1. Foods
- 8.1. Market Analysis, Insights and Forecast - by Source
- 9. Asia Pacific Low-Calorie Sweeteners Market Analysis, Insights and Forecast, 2021-2033
- 9.1. Market Analysis, Insights and Forecast - by Source
- 9.1.1. Natural
- 9.1.2. Synthetic
- 9.2. Market Analysis, Insights and Forecast - by Type
- 9.2.1. Sucralose
- 9.2.2. Saccharin
- 9.2.3. Aspartame
- 9.2.4. Neotame
- 9.2.5. Advantam
- 9.2.6. Acesulfame Potassium
- 9.2.7. Stevia
- 9.2.8. Other Types
- 9.3. Market Analysis, Insights and Forecast - by Application
- 9.3.1. Foods
- 9.3.1.1. Bakery
- 9.3.1.2. Frozen Food and Dairy
- 9.3.1.3. Confectionery
- 9.3.1.4. Other Applications
- 9.3.2. Beverages
- 9.3.3. Pharmaceuticals
- 9.3.4. Other Beverages
- 9.3.1. Foods
- 9.1. Market Analysis, Insights and Forecast - by Source
- 10. South America Low-Calorie Sweeteners Market Analysis, Insights and Forecast, 2021-2033
- 10.1. Market Analysis, Insights and Forecast - by Source
- 10.1.1. Natural
- 10.1.2. Synthetic
- 10.2. Market Analysis, Insights and Forecast - by Type
- 10.2.1. Sucralose
- 10.2.2. Saccharin
- 10.2.3. Aspartame
- 10.2.4. Neotame
- 10.2.5. Advantam
- 10.2.6. Acesulfame Potassium
- 10.2.7. Stevia
- 10.2.8. Other Types
- 10.3. Market Analysis, Insights and Forecast - by Application
- 10.3.1. Foods
- 10.3.1.1. Bakery
- 10.3.1.2. Frozen Food and Dairy
- 10.3.1.3. Confectionery
- 10.3.1.4. Other Applications
- 10.3.2. Beverages
- 10.3.3. Pharmaceuticals
- 10.3.4. Other Beverages
- 10.3.1. Foods
- 10.1. Market Analysis, Insights and Forecast - by Source
- 11. Middle East and Africa Low-Calorie Sweeteners Market Analysis, Insights and Forecast, 2021-2033
- 11.1. Market Analysis, Insights and Forecast - by Source
- 11.1.1. Natural
- 11.1.2. Synthetic
- 11.2. Market Analysis, Insights and Forecast - by Type
- 11.2.1. Sucralose
- 11.2.2. Saccharin
- 11.2.3. Aspartame
- 11.2.4. Neotame
- 11.2.5. Advantam
- 11.2.6. Acesulfame Potassium
- 11.2.7. Stevia
- 11.2.8. Other Types
- 11.3. Market Analysis, Insights and Forecast - by Application
- 11.3.1. Foods
- 11.3.1.1. Bakery
- 11.3.1.2. Frozen Food and Dairy
- 11.3.1.3. Confectionery
- 11.3.1.4. Other Applications
- 11.3.2. Beverages
- 11.3.3. Pharmaceuticals
- 11.3.4. Other Beverages
- 11.3.1. Foods
- 11.1. Market Analysis, Insights and Forecast - by Source
- 12. Competitive Analysis
- 12.1. Company Profiles
- 12.1.1 Cargill Incorporated
- 12.1.1.1. Company Overview
- 12.1.1.2. Products
- 12.1.1.3. Company Financials
- 12.1.1.4. SWOT Analysis
- 12.1.2 Dupont*List Not Exhaustive
- 12.1.2.1. Company Overview
- 12.1.2.2. Products
- 12.1.2.3. Company Financials
- 12.1.2.4. SWOT Analysis
- 12.1.3 Archer Daniels Midland Company
- 12.1.3.1. Company Overview
- 12.1.3.2. Products
- 12.1.3.3. Company Financials
- 12.1.3.4. SWOT Analysis
- 12.1.4 PureCircle
- 12.1.4.1. Company Overview
- 12.1.4.2. Products
- 12.1.4.3. Company Financials
- 12.1.4.4. SWOT Analysis
- 12.1.5 NutraSweet Co
- 12.1.5.1. Company Overview
- 12.1.5.2. Products
- 12.1.5.3. Company Financials
- 12.1.5.4. SWOT Analysis
- 12.1.6 Ingredion Incorporated
- 12.1.6.1. Company Overview
- 12.1.6.2. Products
- 12.1.6.3. Company Financials
- 12.1.6.4. SWOT Analysis
- 12.1.7 JK Sucralose Inc
- 12.1.7.1. Company Overview
- 12.1.7.2. Products
- 12.1.7.3. Company Financials
- 12.1.7.4. SWOT Analysis
- 12.1.8 Roquette Freres
- 12.1.8.1. Company Overview
- 12.1.8.2. Products
- 12.1.8.3. Company Financials
- 12.1.8.4. SWOT Analysis
- 12.1.9 Ajinomoto Health & Nutrition North America Inc
- 12.1.9.1. Company Overview
- 12.1.9.2. Products
- 12.1.9.3. Company Financials
- 12.1.9.4. SWOT Analysis
- 12.1.10 Tate & Lyle
- 12.1.10.1. Company Overview
- 12.1.10.2. Products
- 12.1.10.3. Company Financials
- 12.1.10.4. SWOT Analysis
- 12.1.1 Cargill Incorporated
- 12.2. Market Entropy
- 12.2.1 Company's Key Areas Served
- 12.2.2 Recent Developments
- 12.3. Company Market Share Analysis 2025
- 12.3.1 Top 5 Companies Market Share Analysis
- 12.3.2 Top 3 Companies Market Share Analysis
- 12.4. List of Potential Customers
- 13. Research Methodology
List of Figures
- Figure 1: Global Low-Calorie Sweeteners Market Revenue Breakdown (billion, %) by Region 2025 & 2033
- Figure 2: Global Low-Calorie Sweeteners Market Volume Breakdown (K Tons, %) by Region 2025 & 2033
- Figure 3: North America Low-Calorie Sweeteners Market Revenue (billion), by Source 2025 & 2033
- Figure 4: North America Low-Calorie Sweeteners Market Volume (K Tons), by Source 2025 & 2033
- Figure 5: North America Low-Calorie Sweeteners Market Revenue Share (%), by Source 2025 & 2033
- Figure 6: North America Low-Calorie Sweeteners Market Volume Share (%), by Source 2025 & 2033
- Figure 7: North America Low-Calorie Sweeteners Market Revenue (billion), by Type 2025 & 2033
- Figure 8: North America Low-Calorie Sweeteners Market Volume (K Tons), by Type 2025 & 2033
- Figure 9: North America Low-Calorie Sweeteners Market Revenue Share (%), by Type 2025 & 2033
- Figure 10: North America Low-Calorie Sweeteners Market Volume Share (%), by Type 2025 & 2033
- Figure 11: North America Low-Calorie Sweeteners Market Revenue (billion), by Application 2025 & 2033
- Figure 12: North America Low-Calorie Sweeteners Market Volume (K Tons), by Application 2025 & 2033
- Figure 13: North America Low-Calorie Sweeteners Market Revenue Share (%), by Application 2025 & 2033
- Figure 14: North America Low-Calorie Sweeteners Market Volume Share (%), by Application 2025 & 2033
- Figure 15: North America Low-Calorie Sweeteners Market Revenue (billion), by Country 2025 & 2033
- Figure 16: North America Low-Calorie Sweeteners Market Volume (K Tons), by Country 2025 & 2033
- Figure 17: North America Low-Calorie Sweeteners Market Revenue Share (%), by Country 2025 & 2033
- Figure 18: North America Low-Calorie Sweeteners Market Volume Share (%), by Country 2025 & 2033
- Figure 19: Europe Low-Calorie Sweeteners Market Revenue (billion), by Source 2025 & 2033
- Figure 20: Europe Low-Calorie Sweeteners Market Volume (K Tons), by Source 2025 & 2033
- Figure 21: Europe Low-Calorie Sweeteners Market Revenue Share (%), by Source 2025 & 2033
- Figure 22: Europe Low-Calorie Sweeteners Market Volume Share (%), by Source 2025 & 2033
- Figure 23: Europe Low-Calorie Sweeteners Market Revenue (billion), by Type 2025 & 2033
- Figure 24: Europe Low-Calorie Sweeteners Market Volume (K Tons), by Type 2025 & 2033
- Figure 25: Europe Low-Calorie Sweeteners Market Revenue Share (%), by Type 2025 & 2033
- Figure 26: Europe Low-Calorie Sweeteners Market Volume Share (%), by Type 2025 & 2033
- Figure 27: Europe Low-Calorie Sweeteners Market Revenue (billion), by Application 2025 & 2033
- Figure 28: Europe Low-Calorie Sweeteners Market Volume (K Tons), by Application 2025 & 2033
- Figure 29: Europe Low-Calorie Sweeteners Market Revenue Share (%), by Application 2025 & 2033
- Figure 30: Europe Low-Calorie Sweeteners Market Volume Share (%), by Application 2025 & 2033
- Figure 31: Europe Low-Calorie Sweeteners Market Revenue (billion), by Country 2025 & 2033
- Figure 32: Europe Low-Calorie Sweeteners Market Volume (K Tons), by Country 2025 & 2033
- Figure 33: Europe Low-Calorie Sweeteners Market Revenue Share (%), by Country 2025 & 2033
- Figure 34: Europe Low-Calorie Sweeteners Market Volume Share (%), by Country 2025 & 2033
- Figure 35: Asia Pacific Low-Calorie Sweeteners Market Revenue (billion), by Source 2025 & 2033
- Figure 36: Asia Pacific Low-Calorie Sweeteners Market Volume (K Tons), by Source 2025 & 2033
- Figure 37: Asia Pacific Low-Calorie Sweeteners Market Revenue Share (%), by Source 2025 & 2033
- Figure 38: Asia Pacific Low-Calorie Sweeteners Market Volume Share (%), by Source 2025 & 2033
- Figure 39: Asia Pacific Low-Calorie Sweeteners Market Revenue (billion), by Type 2025 & 2033
- Figure 40: Asia Pacific Low-Calorie Sweeteners Market Volume (K Tons), by Type 2025 & 2033
- Figure 41: Asia Pacific Low-Calorie Sweeteners Market Revenue Share (%), by Type 2025 & 2033
- Figure 42: Asia Pacific Low-Calorie Sweeteners Market Volume Share (%), by Type 2025 & 2033
- Figure 43: Asia Pacific Low-Calorie Sweeteners Market Revenue (billion), by Application 2025 & 2033
- Figure 44: Asia Pacific Low-Calorie Sweeteners Market Volume (K Tons), by Application 2025 & 2033
- Figure 45: Asia Pacific Low-Calorie Sweeteners Market Revenue Share (%), by Application 2025 & 2033
- Figure 46: Asia Pacific Low-Calorie Sweeteners Market Volume Share (%), by Application 2025 & 2033
- Figure 47: Asia Pacific Low-Calorie Sweeteners Market Revenue (billion), by Country 2025 & 2033
- Figure 48: Asia Pacific Low-Calorie Sweeteners Market Volume (K Tons), by Country 2025 & 2033
- Figure 49: Asia Pacific Low-Calorie Sweeteners Market Revenue Share (%), by Country 2025 & 2033
- Figure 50: Asia Pacific Low-Calorie Sweeteners Market Volume Share (%), by Country 2025 & 2033
- Figure 51: South America Low-Calorie Sweeteners Market Revenue (billion), by Source 2025 & 2033
- Figure 52: South America Low-Calorie Sweeteners Market Volume (K Tons), by Source 2025 & 2033
- Figure 53: South America Low-Calorie Sweeteners Market Revenue Share (%), by Source 2025 & 2033
- Figure 54: South America Low-Calorie Sweeteners Market Volume Share (%), by Source 2025 & 2033
- Figure 55: South America Low-Calorie Sweeteners Market Revenue (billion), by Type 2025 & 2033
- Figure 56: South America Low-Calorie Sweeteners Market Volume (K Tons), by Type 2025 & 2033
- Figure 57: South America Low-Calorie Sweeteners Market Revenue Share (%), by Type 2025 & 2033
- Figure 58: South America Low-Calorie Sweeteners Market Volume Share (%), by Type 2025 & 2033
- Figure 59: South America Low-Calorie Sweeteners Market Revenue (billion), by Application 2025 & 2033
- Figure 60: South America Low-Calorie Sweeteners Market Volume (K Tons), by Application 2025 & 2033
- Figure 61: South America Low-Calorie Sweeteners Market Revenue Share (%), by Application 2025 & 2033
- Figure 62: South America Low-Calorie Sweeteners Market Volume Share (%), by Application 2025 & 2033
- Figure 63: South America Low-Calorie Sweeteners Market Revenue (billion), by Country 2025 & 2033
- Figure 64: South America Low-Calorie Sweeteners Market Volume (K Tons), by Country 2025 & 2033
- Figure 65: South America Low-Calorie Sweeteners Market Revenue Share (%), by Country 2025 & 2033
- Figure 66: South America Low-Calorie Sweeteners Market Volume Share (%), by Country 2025 & 2033
- Figure 67: Middle East and Africa Low-Calorie Sweeteners Market Revenue (billion), by Source 2025 & 2033
- Figure 68: Middle East and Africa Low-Calorie Sweeteners Market Volume (K Tons), by Source 2025 & 2033
- Figure 69: Middle East and Africa Low-Calorie Sweeteners Market Revenue Share (%), by Source 2025 & 2033
- Figure 70: Middle East and Africa Low-Calorie Sweeteners Market Volume Share (%), by Source 2025 & 2033
- Figure 71: Middle East and Africa Low-Calorie Sweeteners Market Revenue (billion), by Type 2025 & 2033
- Figure 72: Middle East and Africa Low-Calorie Sweeteners Market Volume (K Tons), by Type 2025 & 2033
- Figure 73: Middle East and Africa Low-Calorie Sweeteners Market Revenue Share (%), by Type 2025 & 2033
- Figure 74: Middle East and Africa Low-Calorie Sweeteners Market Volume Share (%), by Type 2025 & 2033
- Figure 75: Middle East and Africa Low-Calorie Sweeteners Market Revenue (billion), by Application 2025 & 2033
- Figure 76: Middle East and Africa Low-Calorie Sweeteners Market Volume (K Tons), by Application 2025 & 2033
- Figure 77: Middle East and Africa Low-Calorie Sweeteners Market Revenue Share (%), by Application 2025 & 2033
- Figure 78: Middle East and Africa Low-Calorie Sweeteners Market Volume Share (%), by Application 2025 & 2033
- Figure 79: Middle East and Africa Low-Calorie Sweeteners Market Revenue (billion), by Country 2025 & 2033
- Figure 80: Middle East and Africa Low-Calorie Sweeteners Market Volume (K Tons), by Country 2025 & 2033
- Figure 81: Middle East and Africa Low-Calorie Sweeteners Market Revenue Share (%), by Country 2025 & 2033
- Figure 82: Middle East and Africa Low-Calorie Sweeteners Market Volume Share (%), by Country 2025 & 2033
List of Tables
- Table 1: Global Low-Calorie Sweeteners Market Revenue billion Forecast, by Source 2020 & 2033
- Table 2: Global Low-Calorie Sweeteners Market Volume K Tons Forecast, by Source 2020 & 2033
- Table 3: Global Low-Calorie Sweeteners Market Revenue billion Forecast, by Type 2020 & 2033
- Table 4: Global Low-Calorie Sweeteners Market Volume K Tons Forecast, by Type 2020 & 2033
- Table 5: Global Low-Calorie Sweeteners Market Revenue billion Forecast, by Application 2020 & 2033
- Table 6: Global Low-Calorie Sweeteners Market Volume K Tons Forecast, by Application 2020 & 2033
- Table 7: Global Low-Calorie Sweeteners Market Revenue billion Forecast, by Region 2020 & 2033
- Table 8: Global Low-Calorie Sweeteners Market Volume K Tons Forecast, by Region 2020 & 2033
- Table 9: Global Low-Calorie Sweeteners Market Revenue billion Forecast, by Source 2020 & 2033
- Table 10: Global Low-Calorie Sweeteners Market Volume K Tons Forecast, by Source 2020 & 2033
- Table 11: Global Low-Calorie Sweeteners Market Revenue billion Forecast, by Type 2020 & 2033
- Table 12: Global Low-Calorie Sweeteners Market Volume K Tons Forecast, by Type 2020 & 2033
- Table 13: Global Low-Calorie Sweeteners Market Revenue billion Forecast, by Application 2020 & 2033
- Table 14: Global Low-Calorie Sweeteners Market Volume K Tons Forecast, by Application 2020 & 2033
- Table 15: Global Low-Calorie Sweeteners Market Revenue billion Forecast, by Country 2020 & 2033
- Table 16: Global Low-Calorie Sweeteners Market Volume K Tons Forecast, by Country 2020 & 2033
- Table 17: United States Low-Calorie Sweeteners Market Revenue (billion) Forecast, by Application 2020 & 2033
- Table 18: United States Low-Calorie Sweeteners Market Volume (K Tons) Forecast, by Application 2020 & 2033
- Table 19: Canada Low-Calorie Sweeteners Market Revenue (billion) Forecast, by Application 2020 & 2033
- Table 20: Canada Low-Calorie Sweeteners Market Volume (K Tons) Forecast, by Application 2020 & 2033
- Table 21: Mexico Low-Calorie Sweeteners Market Revenue (billion) Forecast, by Application 2020 & 2033
- Table 22: Mexico Low-Calorie Sweeteners Market Volume (K Tons) Forecast, by Application 2020 & 2033
- Table 23: Rest of North America Low-Calorie Sweeteners Market Revenue (billion) Forecast, by Application 2020 & 2033
- Table 24: Rest of North America Low-Calorie Sweeteners Market Volume (K Tons) Forecast, by Application 2020 & 2033
- Table 25: Global Low-Calorie Sweeteners Market Revenue billion Forecast, by Source 2020 & 2033
- Table 26: Global Low-Calorie Sweeteners Market Volume K Tons Forecast, by Source 2020 & 2033
- Table 27: Global Low-Calorie Sweeteners Market Revenue billion Forecast, by Type 2020 & 2033
- Table 28: Global Low-Calorie Sweeteners Market Volume K Tons Forecast, by Type 2020 & 2033
- Table 29: Global Low-Calorie Sweeteners Market Revenue billion Forecast, by Application 2020 & 2033
- Table 30: Global Low-Calorie Sweeteners Market Volume K Tons Forecast, by Application 2020 & 2033
- Table 31: Global Low-Calorie Sweeteners Market Revenue billion Forecast, by Country 2020 & 2033
- Table 32: Global Low-Calorie Sweeteners Market Volume K Tons Forecast, by Country 2020 & 2033
- Table 33: United Kingdom Low-Calorie Sweeteners Market Revenue (billion) Forecast, by Application 2020 & 2033
- Table 34: United Kingdom Low-Calorie Sweeteners Market Volume (K Tons) Forecast, by Application 2020 & 2033
- Table 35: Germany Low-Calorie Sweeteners Market Revenue (billion) Forecast, by Application 2020 & 2033
- Table 36: Germany Low-Calorie Sweeteners Market Volume (K Tons) Forecast, by Application 2020 & 2033
- Table 37: Spain Low-Calorie Sweeteners Market Revenue (billion) Forecast, by Application 2020 & 2033
- Table 38: Spain Low-Calorie Sweeteners Market Volume (K Tons) Forecast, by Application 2020 & 2033
- Table 39: France Low-Calorie Sweeteners Market Revenue (billion) Forecast, by Application 2020 & 2033
- Table 40: France Low-Calorie Sweeteners Market Volume (K Tons) Forecast, by Application 2020 & 2033
- Table 41: Italy Low-Calorie Sweeteners Market Revenue (billion) Forecast, by Application 2020 & 2033
- Table 42: Italy Low-Calorie Sweeteners Market Volume (K Tons) Forecast, by Application 2020 & 2033
- Table 43: Russia Low-Calorie Sweeteners Market Revenue (billion) Forecast, by Application 2020 & 2033
- Table 44: Russia Low-Calorie Sweeteners Market Volume (K Tons) Forecast, by Application 2020 & 2033
- Table 45: Rest of Europe Low-Calorie Sweeteners Market Revenue (billion) Forecast, by Application 2020 & 2033
- Table 46: Rest of Europe Low-Calorie Sweeteners Market Volume (K Tons) Forecast, by Application 2020 & 2033
- Table 47: Global Low-Calorie Sweeteners Market Revenue billion Forecast, by Source 2020 & 2033
- Table 48: Global Low-Calorie Sweeteners Market Volume K Tons Forecast, by Source 2020 & 2033
- Table 49: Global Low-Calorie Sweeteners Market Revenue billion Forecast, by Type 2020 & 2033
- Table 50: Global Low-Calorie Sweeteners Market Volume K Tons Forecast, by Type 2020 & 2033
- Table 51: Global Low-Calorie Sweeteners Market Revenue billion Forecast, by Application 2020 & 2033
- Table 52: Global Low-Calorie Sweeteners Market Volume K Tons Forecast, by Application 2020 & 2033
- Table 53: Global Low-Calorie Sweeteners Market Revenue billion Forecast, by Country 2020 & 2033
- Table 54: Global Low-Calorie Sweeteners Market Volume K Tons Forecast, by Country 2020 & 2033
- Table 55: China Low-Calorie Sweeteners Market Revenue (billion) Forecast, by Application 2020 & 2033
- Table 56: China Low-Calorie Sweeteners Market Volume (K Tons) Forecast, by Application 2020 & 2033
- Table 57: Japan Low-Calorie Sweeteners Market Revenue (billion) Forecast, by Application 2020 & 2033
- Table 58: Japan Low-Calorie Sweeteners Market Volume (K Tons) Forecast, by Application 2020 & 2033
- Table 59: India Low-Calorie Sweeteners Market Revenue (billion) Forecast, by Application 2020 & 2033
- Table 60: India Low-Calorie Sweeteners Market Volume (K Tons) Forecast, by Application 2020 & 2033
- Table 61: Australia Low-Calorie Sweeteners Market Revenue (billion) Forecast, by Application 2020 & 2033
- Table 62: Australia Low-Calorie Sweeteners Market Volume (K Tons) Forecast, by Application 2020 & 2033
- Table 63: Rest of Asia Pacific Low-Calorie Sweeteners Market Revenue (billion) Forecast, by Application 2020 & 2033
- Table 64: Rest of Asia Pacific Low-Calorie Sweeteners Market Volume (K Tons) Forecast, by Application 2020 & 2033
- Table 65: Global Low-Calorie Sweeteners Market Revenue billion Forecast, by Source 2020 & 2033
- Table 66: Global Low-Calorie Sweeteners Market Volume K Tons Forecast, by Source 2020 & 2033
- Table 67: Global Low-Calorie Sweeteners Market Revenue billion Forecast, by Type 2020 & 2033
- Table 68: Global Low-Calorie Sweeteners Market Volume K Tons Forecast, by Type 2020 & 2033
- Table 69: Global Low-Calorie Sweeteners Market Revenue billion Forecast, by Application 2020 & 2033
- Table 70: Global Low-Calorie Sweeteners Market Volume K Tons Forecast, by Application 2020 & 2033
- Table 71: Global Low-Calorie Sweeteners Market Revenue billion Forecast, by Country 2020 & 2033
- Table 72: Global Low-Calorie Sweeteners Market Volume K Tons Forecast, by Country 2020 & 2033
- Table 73: Brazil Low-Calorie Sweeteners Market Revenue (billion) Forecast, by Application 2020 & 2033
- Table 74: Brazil Low-Calorie Sweeteners Market Volume (K Tons) Forecast, by Application 2020 & 2033
- Table 75: Argentina Low-Calorie Sweeteners Market Revenue (billion) Forecast, by Application 2020 & 2033
- Table 76: Argentina Low-Calorie Sweeteners Market Volume (K Tons) Forecast, by Application 2020 & 2033
- Table 77: Rest of South America Low-Calorie Sweeteners Market Revenue (billion) Forecast, by Application 2020 & 2033
- Table 78: Rest of South America Low-Calorie Sweeteners Market Volume (K Tons) Forecast, by Application 2020 & 2033
- Table 79: Global Low-Calorie Sweeteners Market Revenue billion Forecast, by Source 2020 & 2033
- Table 80: Global Low-Calorie Sweeteners Market Volume K Tons Forecast, by Source 2020 & 2033
- Table 81: Global Low-Calorie Sweeteners Market Revenue billion Forecast, by Type 2020 & 2033
- Table 82: Global Low-Calorie Sweeteners Market Volume K Tons Forecast, by Type 2020 & 2033
- Table 83: Global Low-Calorie Sweeteners Market Revenue billion Forecast, by Application 2020 & 2033
- Table 84: Global Low-Calorie Sweeteners Market Volume K Tons Forecast, by Application 2020 & 2033
- Table 85: Global Low-Calorie Sweeteners Market Revenue billion Forecast, by Country 2020 & 2033
- Table 86: Global Low-Calorie Sweeteners Market Volume K Tons Forecast, by Country 2020 & 2033
- Table 87: Saudi Arabia Low-Calorie Sweeteners Market Revenue (billion) Forecast, by Application 2020 & 2033
- Table 88: Saudi Arabia Low-Calorie Sweeteners Market Volume (K Tons) Forecast, by Application 2020 & 2033
- Table 89: South Africa Low-Calorie Sweeteners Market Revenue (billion) Forecast, by Application 2020 & 2033
- Table 90: South Africa Low-Calorie Sweeteners Market Volume (K Tons) Forecast, by Application 2020 & 2033
- Table 91: Rest of Middle East and Africa Low-Calorie Sweeteners Market Revenue (billion) Forecast, by Application 2020 & 2033
- Table 92: Rest of Middle East and Africa Low-Calorie Sweeteners Market Volume (K Tons) Forecast, by Application 2020 & 2033
Frequently Asked Questions
1. What is the projected Compound Annual Growth Rate (CAGR) of the Low-Calorie Sweeteners Market?
The projected CAGR is approximately 4.7%.
2. Which companies are prominent players in the Low-Calorie Sweeteners Market?
Key companies in the market include Cargill Incorporated, Dupont*List Not Exhaustive, Archer Daniels Midland Company, PureCircle, NutraSweet Co, Ingredion Incorporated, JK Sucralose Inc, Roquette Freres, Ajinomoto Health & Nutrition North America Inc, Tate & Lyle.
3. What are the main segments of the Low-Calorie Sweeteners Market?
The market segments include Source, Type, Application.
4. Can you provide details about the market size?
The market size is estimated to be USD 32.9 billion as of 2022.
5. What are some drivers contributing to market growth?
Shift towards Natural Sweeteners.
6. What are the notable trends driving market growth?
Health-conscious Consumers Reducing Sugar Content in their Food.
7. Are there any restraints impacting market growth?
Health Concerns Related to Sweetener Consumption.
8. Can you provide examples of recent developments in the market?
Jul 2022: Sweegen launched Bestevia LQ, a collection of liquid stevia-based sweeteners, at IFT FIRST, the Institute of Food Technologists' convention and exposition that took place during July 10-13 in Chicago. The sweeteners are intended to lower the amount of sugar in products, including concentrated fruit/flavored syrup, confectionary, liquid sweeteners, dessert toppings, and carbonated soft beverages.
9. What pricing options are available for accessing the report?
Pricing options include single-user, multi-user, and enterprise licenses priced at USD 4750, USD 5250, and USD 8750 respectively.
10. Is the market size provided in terms of value or volume?
The market size is provided in terms of value, measured in billion and volume, measured in K Tons.
11. Are there any specific market keywords associated with the report?
Yes, the market keyword associated with the report is "Low-Calorie Sweeteners Market," which aids in identifying and referencing the specific market segment covered.
12. How do I determine which pricing option suits my needs best?
The pricing options vary based on user requirements and access needs. Individual users may opt for single-user licenses, while businesses requiring broader access may choose multi-user or enterprise licenses for cost-effective access to the report.
13. Are there any additional resources or data provided in the Low-Calorie Sweeteners Market report?
While the report offers comprehensive insights, it's advisable to review the specific contents or supplementary materials provided to ascertain if additional resources or data are available.
14. How can I stay updated on further developments or reports in the Low-Calorie Sweeteners Market?
To stay informed about further developments, trends, and reports in the Low-Calorie Sweeteners Market, consider subscribing to industry newsletters, following relevant companies and organizations, or regularly checking reputable industry news sources and publications.
Methodology
Step 1 - Identification of Relevant Samples Size from Population Database


Step 2 - Approaches for Defining Global Market Size (Value, Volume* & Price*)

Note*: In applicable scenarios
Step 3 - Data Sources
Primary Research
- Web Analytics
- Survey Reports
- Research Institute
- Latest Research Reports
- Opinion Leaders
Secondary Research
- Annual Reports
- White Paper
- Latest Press Release
- Industry Association
- Paid Database
- Investor Presentations

Step 4 - Data Triangulation
Involves using different sources of information in order to increase the validity of a study
These sources are likely to be stakeholders in a program - participants, other researchers, program staff, other community members, and so on.
Then we put all data in single framework & apply various statistical tools to find out the dynamic on the market.
During the analysis stage, feedback from the stakeholder groups would be compared to determine areas of agreement as well as areas of divergence