

Key Insights
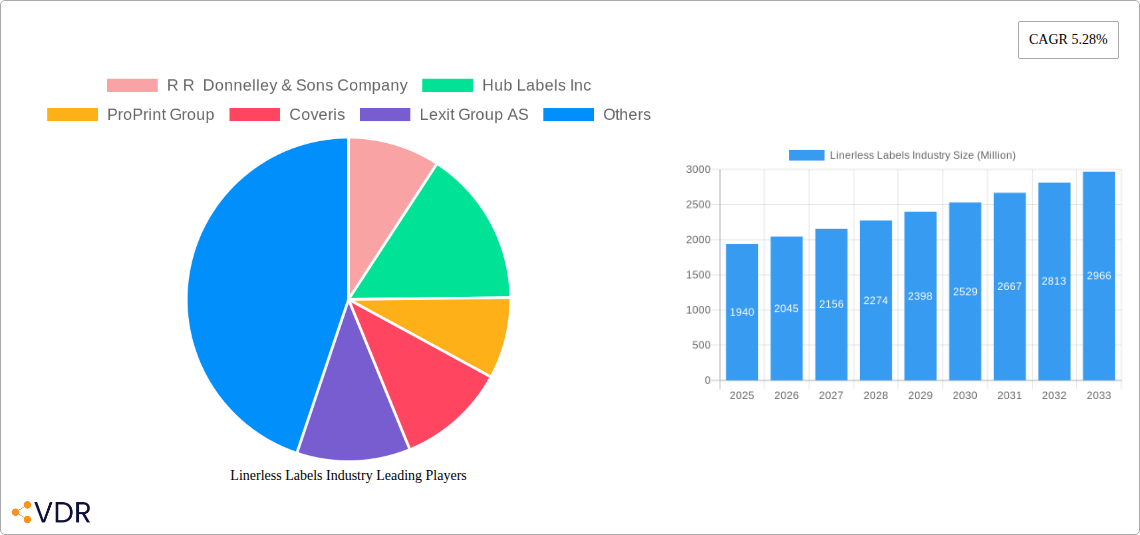
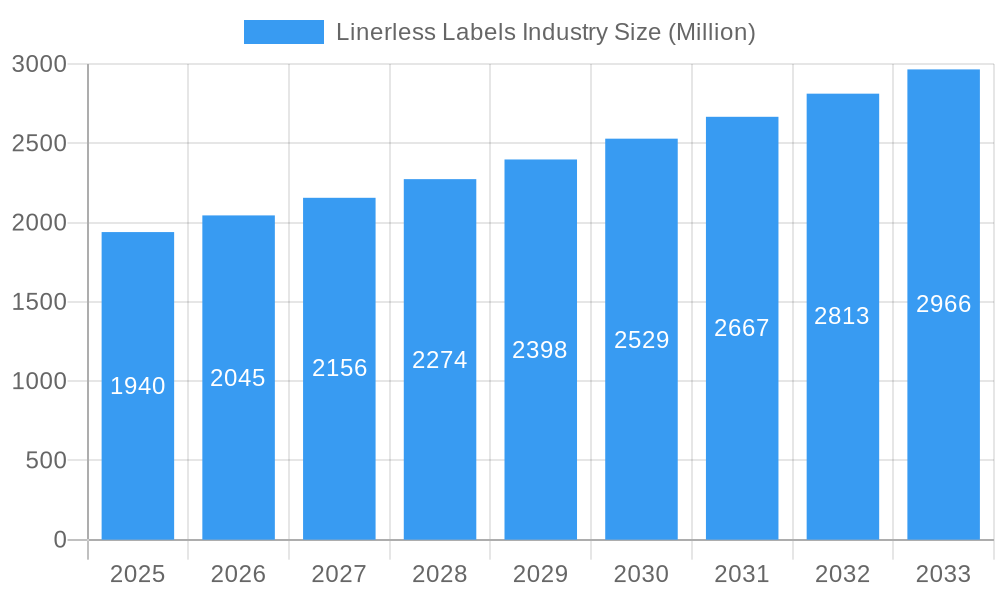
The linerless label industry, currently valued at $1.94 billion in 2025, is projected to experience robust growth, driven by increasing demand across diverse sectors. A Compound Annual Growth Rate (CAGR) of 5.28% from 2025 to 2033 indicates a significant expansion of the market. Key drivers include the growing preference for sustainable packaging solutions, as linerless labels reduce waste and enhance environmental friendliness. The food and beverage industry, along with the burgeoning healthcare and cosmetics sectors, are major contributors to this growth. Furthermore, advancements in printing technologies, especially digital printing, are enabling greater customization and efficiency in linerless label production, further fueling market expansion. The shift towards e-commerce and the rise of personalized products also play a significant role, as linerless labels are well-suited for small-batch printing and individual product identification. While challenges exist, such as the higher initial investment required for linerless label printing equipment, the long-term cost savings and environmental benefits are overcoming these hurdles. Market segmentation by end-user industry and printing technology allows for a nuanced understanding of the various growth trajectories within the sector. Competitive analysis reveals key players such as R R Donnelley & Sons Company and Hub Labels Inc are leading the innovation and market penetration in this dynamic space.
Linerless Labels Industry Market Size (In Billion)
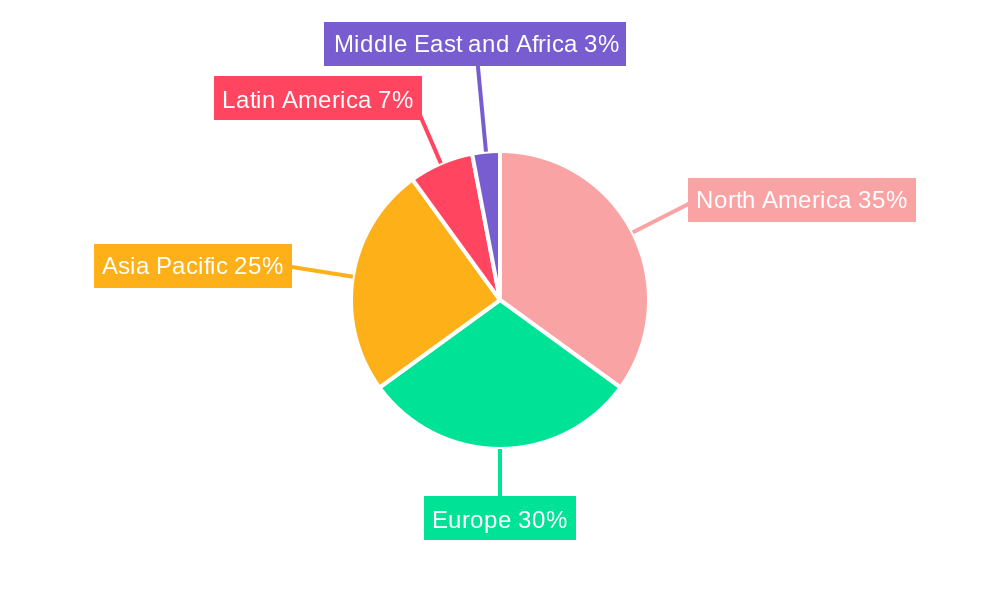
The geographical distribution of the linerless label market is expected to be diverse. While North America and Europe currently hold significant market shares, the Asia-Pacific region is poised for substantial growth due to rapid economic development and rising consumer demand. The Middle East and Africa, while currently smaller contributors, are also anticipated to exhibit growth, aligned with their developing economies and increasing adoption of sustainable practices. The forecast period (2025-2033) will witness substantial market expansion across all regions, fueled by factors such as rising environmental awareness and advancements in printing technology. This presents a lucrative opportunity for companies operating within the linerless label market to capitalize on these trends and invest in further innovation and market penetration. Continuous research and development in sustainable materials and printing techniques will be critical for maintaining the strong growth trajectory.
Linerless Labels Industry Company Market Share
Linerless Labels Industry Market Report: 2019-2033
This comprehensive report provides a detailed analysis of the Linerless Labels industry, encompassing market dynamics, growth trends, regional dominance, product landscape, key players, and future outlook. The study period spans 2019-2033, with 2025 serving as the base and estimated year. The report utilizes data from the historical period (2019-2024) and forecasts market trends up to 2033. This in-depth analysis is invaluable for industry professionals, investors, and strategic decision-makers seeking a clear understanding of this rapidly evolving market. The report is measured in Million units.
Linerless Labels Industry Market Dynamics & Structure
The linerless labels market is experiencing significant growth driven by sustainability concerns and technological advancements. Market concentration is moderate, with several key players holding significant shares but also allowing for smaller niche players to thrive. Technological innovation, particularly in printing technologies and adhesive formulations, is a major driver. Regulatory frameworks concerning sustainability and waste reduction are further propelling adoption. Competitive substitutes exist, primarily traditional pressure-sensitive labels, but linerless options offer compelling advantages in terms of cost-effectiveness and environmental impact. End-user demographics are shifting towards businesses prioritizing sustainability, impacting demand across various sectors. M&A activity remains relatively active, with strategic partnerships focusing on expanding distribution networks and technological capabilities.
- Market Concentration: Moderate, with top 5 players holding approximately xx% market share in 2025.
- Technological Innovation: Focus on improved adhesive technologies, high-speed printing solutions, and enhanced material properties.
- Regulatory Frameworks: Growing emphasis on reducing waste and promoting sustainable packaging solutions.
- Competitive Substitutes: Pressure-sensitive labels are the main competitor, facing challenges in terms of environmental impact and cost.
- M&A Trends: xx deals recorded between 2019-2024, indicating a consolidation trend within the industry. Focus on expansion in new geographic markets and technology integration.
- Innovation Barriers: High initial investment in specialized equipment and material research and development.
Linerless Labels Industry Growth Trends & Insights
The linerless labels market exhibits a robust growth trajectory, fueled by increasing environmental consciousness and the inherent cost advantages of the technology. The market size is expected to reach xx Million units by 2025, exhibiting a Compound Annual Growth Rate (CAGR) of xx% during the forecast period (2025-2033). Adoption rates are accelerating, driven by consumer demand for sustainable packaging and cost-optimization initiatives within various industries. Technological disruptions, such as advancements in digital printing and adhesive formulations, are contributing to greater efficiency and versatility. Consumer behavior shifts towards environmentally friendly products are further driving demand. Market penetration within key end-use segments continues to increase steadily.
Dominant Regions, Countries, or Segments in Linerless Labels Industry
The linerless labels market demonstrates strong regional variations in growth and adoption. North America and Europe currently hold the largest market shares, driven by established regulatory frameworks promoting sustainable packaging and a high concentration of key players. However, regions like Asia-Pacific are experiencing rapid growth, fueled by rising consumer awareness and expanding industrial activity. Within end-user industries, the food and beverage sector, along with healthcare and logistics, are leading adopters due to their significant packaging needs and increasing focus on sustainability. Flexography remains the dominant printing technology, offering a balance between cost-effectiveness and print quality.
- Leading Region: North America (xx% market share in 2025)
- Leading Segment (End-user): Food and Beverage (xx% market share in 2025)
- Leading Segment (Printing Technology): Flexography (xx% market share in 2025)
- Key Drivers (North America): Stringent environmental regulations, established supply chains, and high consumer awareness.
- Key Drivers (Asia-Pacific): Rapid industrialization, growing consumer base, and increasing focus on cost-effective packaging.
Linerless Labels Industry Product Landscape
Linerless labels offer a diverse range of products catering to specific end-user needs. Innovations focus on improving adhesive performance, expanding material options (e.g., recycled content), and enhancing printability for higher-quality graphics. Applications span various industries, from food and beverage to healthcare and logistics, showcasing versatility in design and functionality. Key performance indicators include adhesive strength, printability, and environmental impact. Unique selling propositions revolve around sustainability, cost-effectiveness, and improved efficiency in labeling processes.
Key Drivers, Barriers & Challenges in Linerless Labels Industry
Key Drivers:
- Growing demand for sustainable packaging solutions.
- Increasing focus on reducing waste and optimizing logistics.
- Advancements in printing and adhesive technologies.
- Cost-effectiveness compared to traditional labels.
Challenges:
- High initial investment costs for specialized equipment.
- Potential limitations in adhesive performance depending on substrate and application.
- Ensuring consistent quality and reliability in high-speed printing processes.
- Competition from established pressure-sensitive label manufacturers.
Emerging Opportunities in Linerless Labels Industry
- Expanding into new and untapped markets, particularly in developing economies.
- Development of new adhesive technologies for enhanced performance on diverse substrates.
- Integration with smart packaging technologies and digital printing for personalized labels.
- Growth in niche applications, such as temperature-sensitive labels and security labels.
Growth Accelerators in the Linerless Labels Industry
Technological breakthroughs in printing and adhesive technologies are key drivers of long-term growth. Strategic partnerships between label manufacturers, adhesive suppliers, and printing equipment providers are enhancing innovation and market reach. Expansion into new geographic markets and diversification into high-growth end-user segments are creating additional opportunities. A strong focus on sustainability and environmentally friendly solutions strengthens the market position for linerless labels.
Key Players Shaping the Linerless Labels Industry Market
- R R Donnelley & Sons Company
- Hub Labels Inc
- ProPrint Group
- Coveris
- Lexit Group AS
- Gipako UAB
- Optimum Group
- Skanem AS
- NAStar Inc
- Reflex Labels Ltd
- Innovia Films (CCL Industries)
- SATO Europe GmbH
Notable Milestones in Linerless Labels Industry Sector
- February 2022: ProPrint Group invested nearly EUR 1 million in new equipment (Ravenwood Com500 Coater and Edale FL3 flexo press), significantly increasing its linerless label production capacity and solidifying its position as a leading provider.
- February 2022: Lexit Group partnered with Markem-Imaje (MI), expanding its distribution network in Norway, Sweden, and Denmark, thereby increasing market access and sales potential.
In-Depth Linerless Labels Industry Market Outlook
The linerless labels market presents a compelling investment opportunity, with strong growth potential driven by sustainability trends, technological advancements, and expanding applications across various sectors. Strategic partnerships and continuous innovation are crucial to maintaining a competitive edge. Further penetration into high-growth markets, particularly in developing economies, will significantly contribute to future market expansion. The focus on eco-friendly solutions positions linerless labels as a preferred packaging option, ensuring long-term market stability and growth.
Linerless Labels Industry Segmentation
-
1. Printing Technology
- 1.1. Gravure
- 1.2. Flexography
- 1.3. Digital
- 1.4. Other Processes of Printing
-
2. End-user Industry
- 2.1. Food
- 2.2. Beverage
- 2.3. Healthcare
- 2.4. Cosmetics
- 2.5. Household
- 2.6. Industrial
- 2.7. Logistics
- 2.8. Other End-user Industries
Linerless Labels Industry Segmentation By Geography
- 1. North America
- 2. Europe
- 3. Asia Pacific
- 4. Latin America
- 5. Middle East and Africa
Linerless Labels Industry Regional Market Share
Geographic Coverage of Linerless Labels Industry
Linerless Labels Industry REPORT HIGHLIGHTS
| Aspects | Details |
|---|---|
| Study Period | 2020-2034 |
| Base Year | 2025 |
| Estimated Year | 2026 |
| Forecast Period | 2026-2034 |
| Historical Period | 2020-2025 |
| Growth Rate | CAGR of 5.28% from 2020-2034 |
| Segmentation |
|
Table of Contents
- 1. Introduction
- 1.1. Research Scope
- 1.2. Market Segmentation
- 1.3. Research Objective
- 1.4. Definitions and Assumptions
- 2. Executive Summary
- 2.1. Market Snapshot
- 3. Market Dynamics
- 3.1. Market Drivers
- 3.2. Market Restrains
- 3.3. Market Trends
- 3.4. Market Opportunities
- 4. Market Factor Analysis
- 4.1. Porters Five Forces
- 4.1.1. Bargaining Power of Suppliers
- 4.1.2. Bargaining Power of Buyers
- 4.1.3. Threat of New Entrants
- 4.1.4. Threat of Substitutes
- 4.1.5. Competitive Rivalry
- 4.2. PESTEL analysis
- 4.3. BCG Analysis
- 4.3.1. Stars (High Growth, High Market Share)
- 4.3.2. Cash Cows (Low Growth, High Market Share)
- 4.3.3. Question Mark (High Growth, Low Market Share)
- 4.3.4. Dogs (Low Growth, Low Market Share)
- 4.4. Ansoff Matrix Analysis
- 4.5. Supply Chain Analysis
- 4.6. Regulatory Landscape
- 4.7. Current Market Potential and Opportunity Assessment (TAM–SAM–SOM Framework)
- 4.8. VDR Analyst Note
- 4.1. Porters Five Forces
- 5. Market Analysis, Insights and Forecast 2021-2033
- 5.1. Market Analysis, Insights and Forecast - by Printing Technology
- 5.1.1. Gravure
- 5.1.2. Flexography
- 5.1.3. Digital
- 5.1.4. Other Processes of Printing
- 5.2. Market Analysis, Insights and Forecast - by End-user Industry
- 5.2.1. Food
- 5.2.2. Beverage
- 5.2.3. Healthcare
- 5.2.4. Cosmetics
- 5.2.5. Household
- 5.2.6. Industrial
- 5.2.7. Logistics
- 5.2.8. Other End-user Industries
- 5.3. Market Analysis, Insights and Forecast - by Region
- 5.3.1. North America
- 5.3.2. Europe
- 5.3.3. Asia Pacific
- 5.3.4. Latin America
- 5.3.5. Middle East and Africa
- 5.1. Market Analysis, Insights and Forecast - by Printing Technology
- 6. Global Linerless Labels Industry Analysis, Insights and Forecast, 2021-2033
- 6.1. Market Analysis, Insights and Forecast - by Printing Technology
- 6.1.1. Gravure
- 6.1.2. Flexography
- 6.1.3. Digital
- 6.1.4. Other Processes of Printing
- 6.2. Market Analysis, Insights and Forecast - by End-user Industry
- 6.2.1. Food
- 6.2.2. Beverage
- 6.2.3. Healthcare
- 6.2.4. Cosmetics
- 6.2.5. Household
- 6.2.6. Industrial
- 6.2.7. Logistics
- 6.2.8. Other End-user Industries
- 6.1. Market Analysis, Insights and Forecast - by Printing Technology
- 7. North America Linerless Labels Industry Analysis, Insights and Forecast, 2021-2033
- 7.1. Market Analysis, Insights and Forecast - by Printing Technology
- 7.1.1. Gravure
- 7.1.2. Flexography
- 7.1.3. Digital
- 7.1.4. Other Processes of Printing
- 7.2. Market Analysis, Insights and Forecast - by End-user Industry
- 7.2.1. Food
- 7.2.2. Beverage
- 7.2.3. Healthcare
- 7.2.4. Cosmetics
- 7.2.5. Household
- 7.2.6. Industrial
- 7.2.7. Logistics
- 7.2.8. Other End-user Industries
- 7.1. Market Analysis, Insights and Forecast - by Printing Technology
- 8. Europe Linerless Labels Industry Analysis, Insights and Forecast, 2021-2033
- 8.1. Market Analysis, Insights and Forecast - by Printing Technology
- 8.1.1. Gravure
- 8.1.2. Flexography
- 8.1.3. Digital
- 8.1.4. Other Processes of Printing
- 8.2. Market Analysis, Insights and Forecast - by End-user Industry
- 8.2.1. Food
- 8.2.2. Beverage
- 8.2.3. Healthcare
- 8.2.4. Cosmetics
- 8.2.5. Household
- 8.2.6. Industrial
- 8.2.7. Logistics
- 8.2.8. Other End-user Industries
- 8.1. Market Analysis, Insights and Forecast - by Printing Technology
- 9. Asia Pacific Linerless Labels Industry Analysis, Insights and Forecast, 2021-2033
- 9.1. Market Analysis, Insights and Forecast - by Printing Technology
- 9.1.1. Gravure
- 9.1.2. Flexography
- 9.1.3. Digital
- 9.1.4. Other Processes of Printing
- 9.2. Market Analysis, Insights and Forecast - by End-user Industry
- 9.2.1. Food
- 9.2.2. Beverage
- 9.2.3. Healthcare
- 9.2.4. Cosmetics
- 9.2.5. Household
- 9.2.6. Industrial
- 9.2.7. Logistics
- 9.2.8. Other End-user Industries
- 9.1. Market Analysis, Insights and Forecast - by Printing Technology
- 10. Latin America Linerless Labels Industry Analysis, Insights and Forecast, 2021-2033
- 10.1. Market Analysis, Insights and Forecast - by Printing Technology
- 10.1.1. Gravure
- 10.1.2. Flexography
- 10.1.3. Digital
- 10.1.4. Other Processes of Printing
- 10.2. Market Analysis, Insights and Forecast - by End-user Industry
- 10.2.1. Food
- 10.2.2. Beverage
- 10.2.3. Healthcare
- 10.2.4. Cosmetics
- 10.2.5. Household
- 10.2.6. Industrial
- 10.2.7. Logistics
- 10.2.8. Other End-user Industries
- 10.1. Market Analysis, Insights and Forecast - by Printing Technology
- 11. Middle East and Africa Linerless Labels Industry Analysis, Insights and Forecast, 2021-2033
- 11.1. Market Analysis, Insights and Forecast - by Printing Technology
- 11.1.1. Gravure
- 11.1.2. Flexography
- 11.1.3. Digital
- 11.1.4. Other Processes of Printing
- 11.2. Market Analysis, Insights and Forecast - by End-user Industry
- 11.2.1. Food
- 11.2.2. Beverage
- 11.2.3. Healthcare
- 11.2.4. Cosmetics
- 11.2.5. Household
- 11.2.6. Industrial
- 11.2.7. Logistics
- 11.2.8. Other End-user Industries
- 11.1. Market Analysis, Insights and Forecast - by Printing Technology
- 12. Competitive Analysis
- 12.1. Company Profiles
- 12.1.1 R R Donnelley & Sons Company
- 12.1.1.1. Company Overview
- 12.1.1.2. Products
- 12.1.1.3. Company Financials
- 12.1.1.4. SWOT Analysis
- 12.1.2 Hub Labels Inc
- 12.1.2.1. Company Overview
- 12.1.2.2. Products
- 12.1.2.3. Company Financials
- 12.1.2.4. SWOT Analysis
- 12.1.3 ProPrint Group
- 12.1.3.1. Company Overview
- 12.1.3.2. Products
- 12.1.3.3. Company Financials
- 12.1.3.4. SWOT Analysis
- 12.1.4 Coveris
- 12.1.4.1. Company Overview
- 12.1.4.2. Products
- 12.1.4.3. Company Financials
- 12.1.4.4. SWOT Analysis
- 12.1.5 Lexit Group AS
- 12.1.5.1. Company Overview
- 12.1.5.2. Products
- 12.1.5.3. Company Financials
- 12.1.5.4. SWOT Analysis
- 12.1.6 Gipako UAB*List Not Exhaustive
- 12.1.6.1. Company Overview
- 12.1.6.2. Products
- 12.1.6.3. Company Financials
- 12.1.6.4. SWOT Analysis
- 12.1.7 Optimum Group
- 12.1.7.1. Company Overview
- 12.1.7.2. Products
- 12.1.7.3. Company Financials
- 12.1.7.4. SWOT Analysis
- 12.1.8 Skanem AS
- 12.1.8.1. Company Overview
- 12.1.8.2. Products
- 12.1.8.3. Company Financials
- 12.1.8.4. SWOT Analysis
- 12.1.9 NAStar Inc
- 12.1.9.1. Company Overview
- 12.1.9.2. Products
- 12.1.9.3. Company Financials
- 12.1.9.4. SWOT Analysis
- 12.1.10 Reflex Labels Ltd
- 12.1.10.1. Company Overview
- 12.1.10.2. Products
- 12.1.10.3. Company Financials
- 12.1.10.4. SWOT Analysis
- 12.1.11 Innovia Films (CCL Industries)
- 12.1.11.1. Company Overview
- 12.1.11.2. Products
- 12.1.11.3. Company Financials
- 12.1.11.4. SWOT Analysis
- 12.1.12 SATO Europe GmbH
- 12.1.12.1. Company Overview
- 12.1.12.2. Products
- 12.1.12.3. Company Financials
- 12.1.12.4. SWOT Analysis
- 12.1.1 R R Donnelley & Sons Company
- 12.2. Market Entropy
- 12.2.1 Company's Key Areas Served
- 12.2.2 Recent Developments
- 12.3. Company Market Share Analysis 2025
- 12.3.1 Top 5 Companies Market Share Analysis
- 12.3.2 Top 3 Companies Market Share Analysis
- 12.4. List of Potential Customers
- 13. Research Methodology
List of Figures
- Figure 1: Global Linerless Labels Industry Revenue Breakdown (Million, %) by Region 2025 & 2033
- Figure 2: North America Linerless Labels Industry Revenue (Million), by Printing Technology 2025 & 2033
- Figure 3: North America Linerless Labels Industry Revenue Share (%), by Printing Technology 2025 & 2033
- Figure 4: North America Linerless Labels Industry Revenue (Million), by End-user Industry 2025 & 2033
- Figure 5: North America Linerless Labels Industry Revenue Share (%), by End-user Industry 2025 & 2033
- Figure 6: North America Linerless Labels Industry Revenue (Million), by Country 2025 & 2033
- Figure 7: North America Linerless Labels Industry Revenue Share (%), by Country 2025 & 2033
- Figure 8: Europe Linerless Labels Industry Revenue (Million), by Printing Technology 2025 & 2033
- Figure 9: Europe Linerless Labels Industry Revenue Share (%), by Printing Technology 2025 & 2033
- Figure 10: Europe Linerless Labels Industry Revenue (Million), by End-user Industry 2025 & 2033
- Figure 11: Europe Linerless Labels Industry Revenue Share (%), by End-user Industry 2025 & 2033
- Figure 12: Europe Linerless Labels Industry Revenue (Million), by Country 2025 & 2033
- Figure 13: Europe Linerless Labels Industry Revenue Share (%), by Country 2025 & 2033
- Figure 14: Asia Pacific Linerless Labels Industry Revenue (Million), by Printing Technology 2025 & 2033
- Figure 15: Asia Pacific Linerless Labels Industry Revenue Share (%), by Printing Technology 2025 & 2033
- Figure 16: Asia Pacific Linerless Labels Industry Revenue (Million), by End-user Industry 2025 & 2033
- Figure 17: Asia Pacific Linerless Labels Industry Revenue Share (%), by End-user Industry 2025 & 2033
- Figure 18: Asia Pacific Linerless Labels Industry Revenue (Million), by Country 2025 & 2033
- Figure 19: Asia Pacific Linerless Labels Industry Revenue Share (%), by Country 2025 & 2033
- Figure 20: Latin America Linerless Labels Industry Revenue (Million), by Printing Technology 2025 & 2033
- Figure 21: Latin America Linerless Labels Industry Revenue Share (%), by Printing Technology 2025 & 2033
- Figure 22: Latin America Linerless Labels Industry Revenue (Million), by End-user Industry 2025 & 2033
- Figure 23: Latin America Linerless Labels Industry Revenue Share (%), by End-user Industry 2025 & 2033
- Figure 24: Latin America Linerless Labels Industry Revenue (Million), by Country 2025 & 2033
- Figure 25: Latin America Linerless Labels Industry Revenue Share (%), by Country 2025 & 2033
- Figure 26: Middle East and Africa Linerless Labels Industry Revenue (Million), by Printing Technology 2025 & 2033
- Figure 27: Middle East and Africa Linerless Labels Industry Revenue Share (%), by Printing Technology 2025 & 2033
- Figure 28: Middle East and Africa Linerless Labels Industry Revenue (Million), by End-user Industry 2025 & 2033
- Figure 29: Middle East and Africa Linerless Labels Industry Revenue Share (%), by End-user Industry 2025 & 2033
- Figure 30: Middle East and Africa Linerless Labels Industry Revenue (Million), by Country 2025 & 2033
- Figure 31: Middle East and Africa Linerless Labels Industry Revenue Share (%), by Country 2025 & 2033
List of Tables
- Table 1: Global Linerless Labels Industry Revenue Million Forecast, by Printing Technology 2020 & 2033
- Table 2: Global Linerless Labels Industry Revenue Million Forecast, by End-user Industry 2020 & 2033
- Table 3: Global Linerless Labels Industry Revenue Million Forecast, by Region 2020 & 2033
- Table 4: Global Linerless Labels Industry Revenue Million Forecast, by Printing Technology 2020 & 2033
- Table 5: Global Linerless Labels Industry Revenue Million Forecast, by End-user Industry 2020 & 2033
- Table 6: Global Linerless Labels Industry Revenue Million Forecast, by Country 2020 & 2033
- Table 7: Global Linerless Labels Industry Revenue Million Forecast, by Printing Technology 2020 & 2033
- Table 8: Global Linerless Labels Industry Revenue Million Forecast, by End-user Industry 2020 & 2033
- Table 9: Global Linerless Labels Industry Revenue Million Forecast, by Country 2020 & 2033
- Table 10: Global Linerless Labels Industry Revenue Million Forecast, by Printing Technology 2020 & 2033
- Table 11: Global Linerless Labels Industry Revenue Million Forecast, by End-user Industry 2020 & 2033
- Table 12: Global Linerless Labels Industry Revenue Million Forecast, by Country 2020 & 2033
- Table 13: Global Linerless Labels Industry Revenue Million Forecast, by Printing Technology 2020 & 2033
- Table 14: Global Linerless Labels Industry Revenue Million Forecast, by End-user Industry 2020 & 2033
- Table 15: Global Linerless Labels Industry Revenue Million Forecast, by Country 2020 & 2033
- Table 16: Global Linerless Labels Industry Revenue Million Forecast, by Printing Technology 2020 & 2033
- Table 17: Global Linerless Labels Industry Revenue Million Forecast, by End-user Industry 2020 & 2033
- Table 18: Global Linerless Labels Industry Revenue Million Forecast, by Country 2020 & 2033
Frequently Asked Questions
1. What is the projected Compound Annual Growth Rate (CAGR) of the Linerless Labels Industry?
The projected CAGR is approximately 5.28%.
2. Which companies are prominent players in the Linerless Labels Industry?
Key companies in the market include R R Donnelley & Sons Company, Hub Labels Inc, ProPrint Group, Coveris, Lexit Group AS, Gipako UAB*List Not Exhaustive, Optimum Group, Skanem AS, NAStar Inc, Reflex Labels Ltd, Innovia Films (CCL Industries), SATO Europe GmbH.
3. What are the main segments of the Linerless Labels Industry?
The market segments include Printing Technology, End-user Industry.
4. Can you provide details about the market size?
The market size is estimated to be USD 1.94 Million as of 2022.
5. What are some drivers contributing to market growth?
Increasing Demand for Packaged Foods and Beverages; Increasing Demand for Pharmaceutical Supplies.
6. What are the notable trends driving market growth?
Food and Beverage Expected to Hold the Largest Market Share.
7. Are there any restraints impacting market growth?
Fluctuation in the Prices of Raw Materials.
8. Can you provide examples of recent developments in the market?
Feb 2022 - ProPrintGroup installed a new Ravenwood Com500 Coater. There will also be a new advanced 10-colour EdaleFL3 flexo press. As a result, ProPrint'sLinerless Labels segment now has a total investment of almost EUR 1 million. ProPrintwill becomes a first-class Linerless Labels provider as a result of the transfer, which will greatly increase Linerless Labeling capacity.
9. What pricing options are available for accessing the report?
Pricing options include single-user, multi-user, and enterprise licenses priced at USD 4750, USD 5250, and USD 8750 respectively.
10. Is the market size provided in terms of value or volume?
The market size is provided in terms of value, measured in Million.
11. Are there any specific market keywords associated with the report?
Yes, the market keyword associated with the report is "Linerless Labels Industry," which aids in identifying and referencing the specific market segment covered.
12. How do I determine which pricing option suits my needs best?
The pricing options vary based on user requirements and access needs. Individual users may opt for single-user licenses, while businesses requiring broader access may choose multi-user or enterprise licenses for cost-effective access to the report.
13. Are there any additional resources or data provided in the Linerless Labels Industry report?
While the report offers comprehensive insights, it's advisable to review the specific contents or supplementary materials provided to ascertain if additional resources or data are available.
14. How can I stay updated on further developments or reports in the Linerless Labels Industry?
To stay informed about further developments, trends, and reports in the Linerless Labels Industry, consider subscribing to industry newsletters, following relevant companies and organizations, or regularly checking reputable industry news sources and publications.
Methodology
Step 1 - Identification of Relevant Samples Size from Population Database


Step 2 - Approaches for Defining Global Market Size (Value, Volume* & Price*)

Note*: In applicable scenarios
Step 3 - Data Sources
Primary Research
- Web Analytics
- Survey Reports
- Research Institute
- Latest Research Reports
- Opinion Leaders
Secondary Research
- Annual Reports
- White Paper
- Latest Press Release
- Industry Association
- Paid Database
- Investor Presentations

Step 4 - Data Triangulation
Involves using different sources of information in order to increase the validity of a study
These sources are likely to be stakeholders in a program - participants, other researchers, program staff, other community members, and so on.
Then we put all data in single framework & apply various statistical tools to find out the dynamic on the market.
During the analysis stage, feedback from the stakeholder groups would be compared to determine areas of agreement as well as areas of divergence