

Key Insights
The Lighting as a Service (LaaS) market is experiencing significant expansion, propelled by the widespread adoption of energy-efficient lighting technologies, the economic advantage of reduced upfront capital expenditure, and the escalating demand for advanced lighting management systems across commercial, industrial, and outdoor applications. Projections indicate a robust growth trajectory, with an anticipated market size of 3.5 billion by 2025, growing at a Compound Annual Growth Rate (CAGR) of 34.8%. Technological advancements in LED lighting, IoT integration, and sophisticated data analytics are key drivers, offering businesses substantial insights into energy consumption and operational efficiency. Major industry players, including Signify and GE, are actively enhancing their LaaS portfolios, fostering market growth and intense competition.
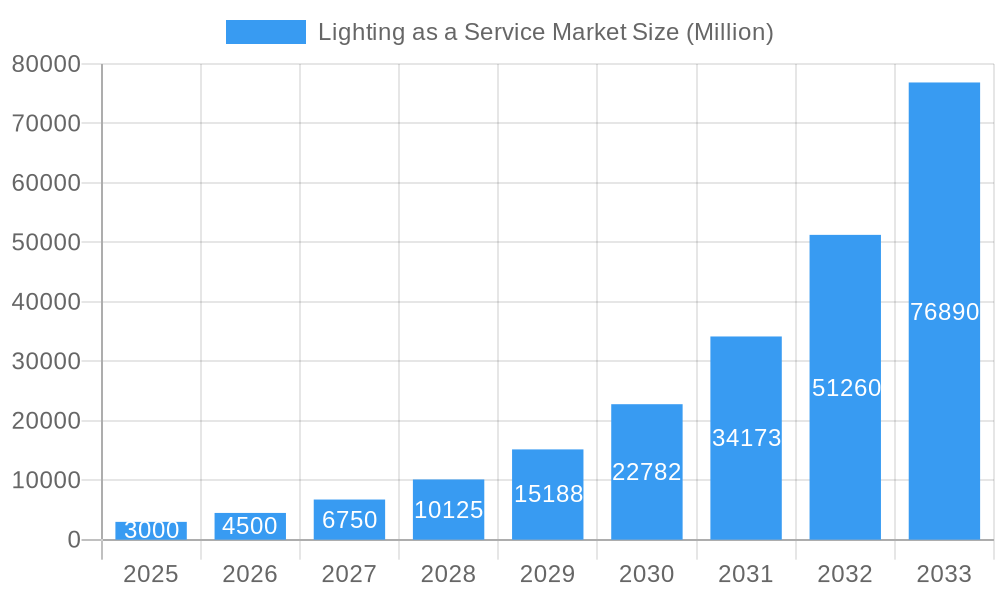
Lighting as a Service Market Market Size (In Billion)
Market segmentation reveals diverse opportunities across all end-user sectors. Commercial applications lead, driven by the imperative for energy savings and improved building management. Industrial applications are also growing rapidly, influenced by the focus on optimizing factory operations and reducing energy expenditures. Outdoor lighting adoption is accelerating with the rise of smart city initiatives, increasing the demand for connected and controllable lighting solutions. Geographically, North America and Europe demonstrate strong market presence, while Asia Pacific is emerging as a key growth region, primarily due to large-scale infrastructure development and rapid urbanization in nations like China and India. Potential restraints, such as initial infrastructure upgrade costs and data security concerns, may influence growth rates but the overall market outlook remains highly positive.
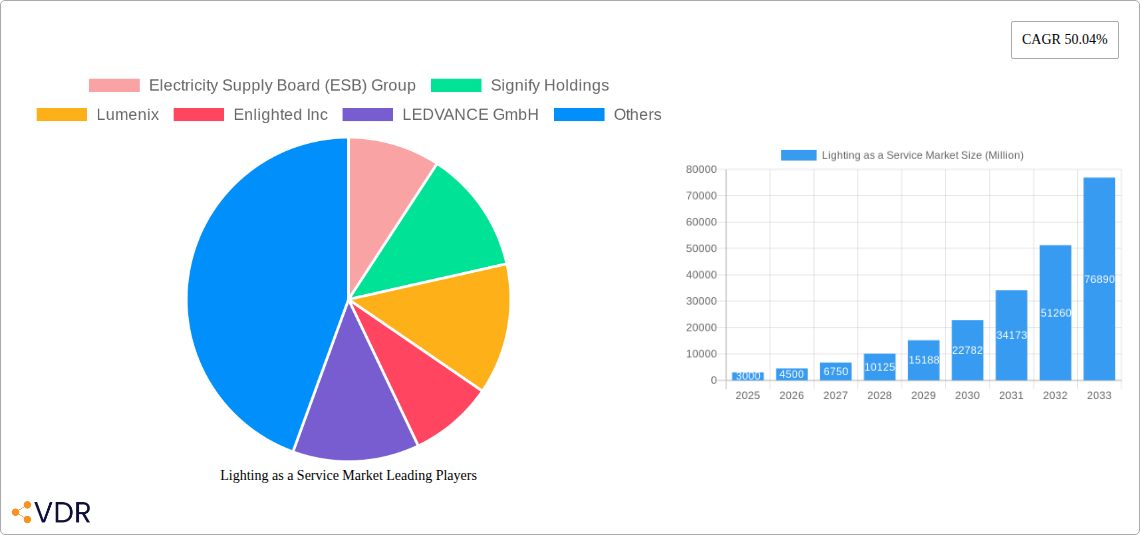
Lighting as a Service Market Company Market Share
Lighting as a Service (LaaS) Market Analysis: 2025-2033
This comprehensive report offers an in-depth analysis of the Lighting as a Service (LaaS) market, covering market dynamics, growth trends, regional segmentation, competitive landscape, and future projections. The base year for this analysis is 2025, with a forecast period extending to 2033. The market is segmented by end-user: Commercial, Outdoor, and Industrial. This report provides critical insights for industry professionals, investors, and strategic decision-makers. The market is projected to reach significant value by 2033.
Lighting as a Service Market Market Dynamics & Structure
The Lighting as a Service market is characterized by a moderately fragmented landscape, with several key players vying for market share. Technological advancements, particularly in LED lighting and IoT integration, are key drivers of innovation. Stringent energy efficiency regulations are pushing adoption, while the availability of alternative lighting solutions presents competitive pressure. The market witnesses significant M&A activity, with larger players acquiring smaller firms to expand their product portfolio and geographic reach. Consumer preferences for sustainable and energy-efficient solutions are also shaping market growth.
- Market Concentration: Moderately Fragmented (xx% market share held by top 5 players in 2024).
- Technological Innovation: Focus on IoT integration, smart lighting controls, and energy harvesting.
- Regulatory Framework: Increasing emphasis on energy efficiency standards globally.
- Competitive Substitutes: Traditional lighting systems, energy-efficient alternatives.
- M&A Trends: High volume of acquisitions in the past 5 years (xx deals in 2019-2024). Estimated xx deals by 2033.
- Innovation Barriers: High initial investment costs, integration complexities, lack of standardization.
Lighting as a Service Market Growth Trends & Insights
The LaaS market has experienced significant growth over the past few years, driven by increasing awareness of energy efficiency and cost savings. The adoption rate is accelerating, particularly in the commercial sector, fueled by favorable government policies and incentives. Technological disruptions, such as the emergence of smart lighting solutions and IoT integration, are further propelling market expansion. Consumer behavior is shifting towards sustainable and energy-efficient alternatives, impacting market demand. The Commercial segment is expected to maintain its dominance owing to greater awareness and higher adoption rates. The market is projected to witness a CAGR of xx% during the forecast period (2025-2033). Market penetration is estimated at xx% in 2025 and is expected to reach xx% by 2033.
Dominant Regions, Countries, or Segments in Lighting as a Service Market
The Commercial segment is currently the dominant end-user segment in the LaaS market, driving substantial revenue generation. This dominance is attributed to the high concentration of commercial buildings and businesses actively seeking energy-efficient solutions. North America and Europe currently represent the largest regional markets, driven by robust economic growth, favorable regulatory frameworks, and high adoption rates.
- Key Drivers (Commercial Segment): High energy costs, government incentives, focus on sustainability.
- Key Drivers (North America/Europe): Strong economic growth, favorable regulations, advanced infrastructure.
- Market Share: Commercial (xx%), Outdoor (xx%), Industrial (xx%) in 2025. Projected Market Share in 2033: Commercial (xx%), Outdoor (xx%), Industrial (xx%).
- Growth Potential: High growth potential in emerging economies driven by infrastructure development.
Lighting as a Service Market Product Landscape
The LaaS market offers a range of products encompassing various lighting fixtures, control systems, and data analytics platforms. Innovations are focused on enhancing energy efficiency, improving lighting quality, and integrating advanced features such as remote monitoring and control. Unique selling propositions include reduced operating costs, improved energy efficiency, and enhanced data-driven insights. Technological advancements are driven by the integration of LED technology, sensor technology, and IoT connectivity.
Key Drivers, Barriers & Challenges in Lighting as a Service Market
Key Drivers: The increasing demand for energy-efficient lighting solutions, coupled with government regulations and incentives, is a significant driver of market growth. Technological advancements, particularly in LED technology and IoT integration, are further accelerating market expansion. The cost savings associated with LaaS solutions are also attracting significant market interest.
Challenges: High initial investment costs, complex integration processes, and a lack of standardization can hinder market adoption. Supply chain disruptions and the presence of established players in the traditional lighting market pose significant competitive pressures. Regulatory hurdles and cybersecurity concerns can also present challenges to market growth. A quantifiable impact of supply chain issues is estimated at xx Million in revenue loss annually.
Emerging Opportunities in Lighting as a Service Market
Emerging opportunities lie in the expansion into untapped markets, such as developing economies with growing infrastructure development. Innovative applications, such as smart street lighting and integrated building management systems, are opening new avenues for growth. The evolving consumer preferences for energy-efficient and sustainable solutions will continue to propel market expansion.
Growth Accelerators in the Lighting as a Service Market Industry
Technological breakthroughs, strategic partnerships, and expansion into new geographic markets are key growth accelerators. The continuous improvement of LED technology and the integration of AI-powered functionalities are driving innovation and adoption rates. Strategic alliances between lighting providers and technology companies are creating synergistic opportunities. Market expansion strategies, focusing on emerging economies, will be essential for sustained market growth.
Key Players Shaping the Lighting as a Service Market Market
- Electricity Supply Board (ESB) Group
- Signify Holdings
- Lumenix
- Enlighted Inc
- LEDVANCE GmbH
- Lighthouse*List Not Exhaustive
- Stouch Lighting
- Every Watt Matters
- General Electric Company
- LumenServe Inc
Notable Milestones in Lighting as a Service Market Sector
- 2020: Signify launches a new range of IoT-enabled lighting solutions for commercial buildings.
- 2022: Several major mergers and acquisitions reshape the market landscape.
- 2023: New energy efficiency standards are implemented in several countries.
- 2024: Significant investments in R&D drive innovation in smart lighting technology.
In-Depth Lighting as a Service Market Market Outlook
The LaaS market is poised for substantial growth in the coming years, driven by a confluence of factors. Continued technological advancements, strategic partnerships, and expansion into new markets will fuel market expansion. The focus on sustainability and energy efficiency will further increase market demand. Strategic opportunities lie in developing innovative solutions tailored to specific end-user needs, expanding into new geographic markets, and forming strategic partnerships to leverage technological capabilities and expand market reach. The market shows strong potential to reach xx Million by 2033.
Lighting as a Service Market Segmentation
-
1. End User
- 1.1. Commercial
- 1.2. Outdoor
- 1.3. Industrial
Lighting as a Service Market Segmentation By Geography
- 1. North America
- 2. Europe
- 3. Asia Pacific
- 4. Latin America
- 5. Middle East
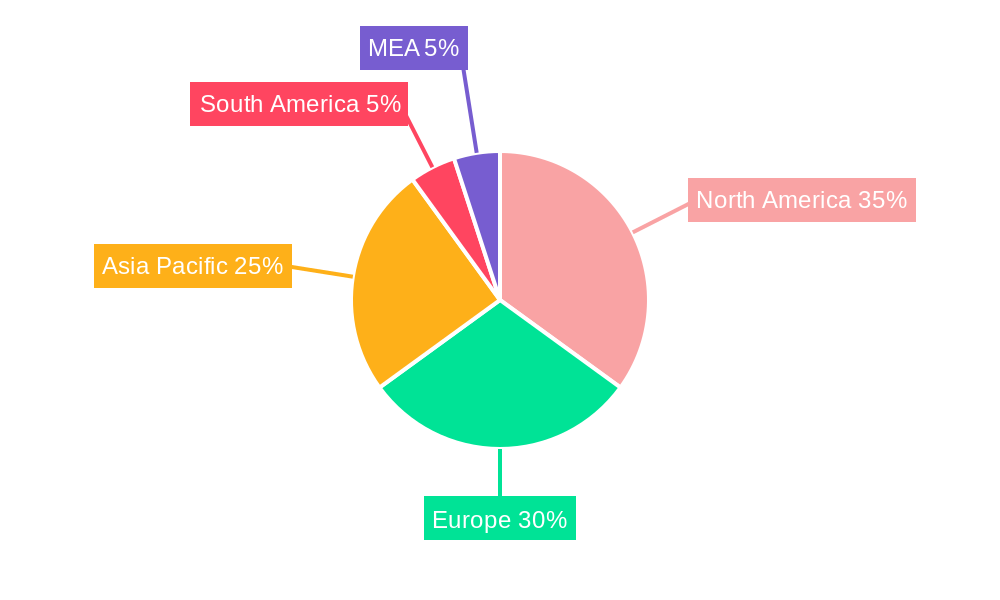
Lighting as a Service Market Regional Market Share
Geographic Coverage of Lighting as a Service Market
Lighting as a Service Market REPORT HIGHLIGHTS
| Aspects | Details |
|---|---|
| Study Period | 2020-2034 |
| Base Year | 2025 |
| Estimated Year | 2026 |
| Forecast Period | 2026-2034 |
| Historical Period | 2020-2025 |
| Growth Rate | CAGR of 34.8% from 2020-2034 |
| Segmentation |
|
Table of Contents
- 1. Introduction
- 1.1. Research Scope
- 1.2. Market Segmentation
- 1.3. Research Objective
- 1.4. Definitions and Assumptions
- 2. Executive Summary
- 2.1. Market Snapshot
- 3. Market Dynamics
- 3.1. Market Drivers
- 3.2. Market Restrains
- 3.3. Market Trends
- 3.4. Market Opportunities
- 4. Market Factor Analysis
- 4.1. Porters Five Forces
- 4.1.1. Bargaining Power of Suppliers
- 4.1.2. Bargaining Power of Buyers
- 4.1.3. Threat of New Entrants
- 4.1.4. Threat of Substitutes
- 4.1.5. Competitive Rivalry
- 4.2. PESTEL analysis
- 4.3. BCG Analysis
- 4.3.1. Stars (High Growth, High Market Share)
- 4.3.2. Cash Cows (Low Growth, High Market Share)
- 4.3.3. Question Mark (High Growth, Low Market Share)
- 4.3.4. Dogs (Low Growth, Low Market Share)
- 4.4. Ansoff Matrix Analysis
- 4.5. Supply Chain Analysis
- 4.6. Regulatory Landscape
- 4.7. Current Market Potential and Opportunity Assessment (TAM–SAM–SOM Framework)
- 4.8. VDR Analyst Note
- 4.1. Porters Five Forces
- 5. Market Analysis, Insights and Forecast 2021-2033
- 5.1. Market Analysis, Insights and Forecast - by End User
- 5.1.1. Commercial
- 5.1.2. Outdoor
- 5.1.3. Industrial
- 5.2. Market Analysis, Insights and Forecast - by Region
- 5.2.1. North America
- 5.2.2. Europe
- 5.2.3. Asia Pacific
- 5.2.4. Latin America
- 5.2.5. Middle East
- 5.1. Market Analysis, Insights and Forecast - by End User
- 6. Global Lighting as a Service Market Analysis, Insights and Forecast, 2021-2033
- 6.1. Market Analysis, Insights and Forecast - by End User
- 6.1.1. Commercial
- 6.1.2. Outdoor
- 6.1.3. Industrial
- 6.1. Market Analysis, Insights and Forecast - by End User
- 7. North America Lighting as a Service Market Analysis, Insights and Forecast, 2021-2033
- 7.1. Market Analysis, Insights and Forecast - by End User
- 7.1.1. Commercial
- 7.1.2. Outdoor
- 7.1.3. Industrial
- 7.1. Market Analysis, Insights and Forecast - by End User
- 8. Europe Lighting as a Service Market Analysis, Insights and Forecast, 2021-2033
- 8.1. Market Analysis, Insights and Forecast - by End User
- 8.1.1. Commercial
- 8.1.2. Outdoor
- 8.1.3. Industrial
- 8.1. Market Analysis, Insights and Forecast - by End User
- 9. Asia Pacific Lighting as a Service Market Analysis, Insights and Forecast, 2021-2033
- 9.1. Market Analysis, Insights and Forecast - by End User
- 9.1.1. Commercial
- 9.1.2. Outdoor
- 9.1.3. Industrial
- 9.1. Market Analysis, Insights and Forecast - by End User
- 10. Latin America Lighting as a Service Market Analysis, Insights and Forecast, 2021-2033
- 10.1. Market Analysis, Insights and Forecast - by End User
- 10.1.1. Commercial
- 10.1.2. Outdoor
- 10.1.3. Industrial
- 10.1. Market Analysis, Insights and Forecast - by End User
- 11. Middle East Lighting as a Service Market Analysis, Insights and Forecast, 2021-2033
- 11.1. Market Analysis, Insights and Forecast - by End User
- 11.1.1. Commercial
- 11.1.2. Outdoor
- 11.1.3. Industrial
- 11.1. Market Analysis, Insights and Forecast - by End User
- 12. Competitive Analysis
- 12.1. Company Profiles
- 12.1.1 Electricity Supply Board (ESB) Group
- 12.1.1.1. Company Overview
- 12.1.1.2. Products
- 12.1.1.3. Company Financials
- 12.1.1.4. SWOT Analysis
- 12.1.2 Signify Holdings
- 12.1.2.1. Company Overview
- 12.1.2.2. Products
- 12.1.2.3. Company Financials
- 12.1.2.4. SWOT Analysis
- 12.1.3 Lumenix
- 12.1.3.1. Company Overview
- 12.1.3.2. Products
- 12.1.3.3. Company Financials
- 12.1.3.4. SWOT Analysis
- 12.1.4 Enlighted Inc
- 12.1.4.1. Company Overview
- 12.1.4.2. Products
- 12.1.4.3. Company Financials
- 12.1.4.4. SWOT Analysis
- 12.1.5 LEDVANCE GmbH
- 12.1.5.1. Company Overview
- 12.1.5.2. Products
- 12.1.5.3. Company Financials
- 12.1.5.4. SWOT Analysis
- 12.1.6 Lighthouse*List Not Exhaustive
- 12.1.6.1. Company Overview
- 12.1.6.2. Products
- 12.1.6.3. Company Financials
- 12.1.6.4. SWOT Analysis
- 12.1.7 Stouch Lighting
- 12.1.7.1. Company Overview
- 12.1.7.2. Products
- 12.1.7.3. Company Financials
- 12.1.7.4. SWOT Analysis
- 12.1.8 Every Watt Matters
- 12.1.8.1. Company Overview
- 12.1.8.2. Products
- 12.1.8.3. Company Financials
- 12.1.8.4. SWOT Analysis
- 12.1.9 General Electric Company
- 12.1.9.1. Company Overview
- 12.1.9.2. Products
- 12.1.9.3. Company Financials
- 12.1.9.4. SWOT Analysis
- 12.1.10 LumenServe Inc
- 12.1.10.1. Company Overview
- 12.1.10.2. Products
- 12.1.10.3. Company Financials
- 12.1.10.4. SWOT Analysis
- 12.1.1 Electricity Supply Board (ESB) Group
- 12.2. Market Entropy
- 12.2.1 Company's Key Areas Served
- 12.2.2 Recent Developments
- 12.3. Company Market Share Analysis 2025
- 12.3.1 Top 5 Companies Market Share Analysis
- 12.3.2 Top 3 Companies Market Share Analysis
- 12.4. List of Potential Customers
- 13. Research Methodology
List of Figures
- Figure 1: Global Lighting as a Service Market Revenue Breakdown (billion, %) by Region 2025 & 2033
- Figure 2: North America Lighting as a Service Market Revenue (billion), by End User 2025 & 2033
- Figure 3: North America Lighting as a Service Market Revenue Share (%), by End User 2025 & 2033
- Figure 4: North America Lighting as a Service Market Revenue (billion), by Country 2025 & 2033
- Figure 5: North America Lighting as a Service Market Revenue Share (%), by Country 2025 & 2033
- Figure 6: Europe Lighting as a Service Market Revenue (billion), by End User 2025 & 2033
- Figure 7: Europe Lighting as a Service Market Revenue Share (%), by End User 2025 & 2033
- Figure 8: Europe Lighting as a Service Market Revenue (billion), by Country 2025 & 2033
- Figure 9: Europe Lighting as a Service Market Revenue Share (%), by Country 2025 & 2033
- Figure 10: Asia Pacific Lighting as a Service Market Revenue (billion), by End User 2025 & 2033
- Figure 11: Asia Pacific Lighting as a Service Market Revenue Share (%), by End User 2025 & 2033
- Figure 12: Asia Pacific Lighting as a Service Market Revenue (billion), by Country 2025 & 2033
- Figure 13: Asia Pacific Lighting as a Service Market Revenue Share (%), by Country 2025 & 2033
- Figure 14: Latin America Lighting as a Service Market Revenue (billion), by End User 2025 & 2033
- Figure 15: Latin America Lighting as a Service Market Revenue Share (%), by End User 2025 & 2033
- Figure 16: Latin America Lighting as a Service Market Revenue (billion), by Country 2025 & 2033
- Figure 17: Latin America Lighting as a Service Market Revenue Share (%), by Country 2025 & 2033
- Figure 18: Middle East Lighting as a Service Market Revenue (billion), by End User 2025 & 2033
- Figure 19: Middle East Lighting as a Service Market Revenue Share (%), by End User 2025 & 2033
- Figure 20: Middle East Lighting as a Service Market Revenue (billion), by Country 2025 & 2033
- Figure 21: Middle East Lighting as a Service Market Revenue Share (%), by Country 2025 & 2033
List of Tables
- Table 1: Global Lighting as a Service Market Revenue billion Forecast, by End User 2020 & 2033
- Table 2: Global Lighting as a Service Market Revenue billion Forecast, by Region 2020 & 2033
- Table 3: Global Lighting as a Service Market Revenue billion Forecast, by End User 2020 & 2033
- Table 4: Global Lighting as a Service Market Revenue billion Forecast, by Country 2020 & 2033
- Table 5: Global Lighting as a Service Market Revenue billion Forecast, by End User 2020 & 2033
- Table 6: Global Lighting as a Service Market Revenue billion Forecast, by Country 2020 & 2033
- Table 7: Global Lighting as a Service Market Revenue billion Forecast, by End User 2020 & 2033
- Table 8: Global Lighting as a Service Market Revenue billion Forecast, by Country 2020 & 2033
- Table 9: Global Lighting as a Service Market Revenue billion Forecast, by End User 2020 & 2033
- Table 10: Global Lighting as a Service Market Revenue billion Forecast, by Country 2020 & 2033
- Table 11: Global Lighting as a Service Market Revenue billion Forecast, by End User 2020 & 2033
- Table 12: Global Lighting as a Service Market Revenue billion Forecast, by Country 2020 & 2033
Frequently Asked Questions
1. What is the projected Compound Annual Growth Rate (CAGR) of the Lighting as a Service Market?
The projected CAGR is approximately 34.8%.
2. Which companies are prominent players in the Lighting as a Service Market?
Key companies in the market include Electricity Supply Board (ESB) Group, Signify Holdings, Lumenix, Enlighted Inc, LEDVANCE GmbH, Lighthouse*List Not Exhaustive, Stouch Lighting, Every Watt Matters, General Electric Company, LumenServe Inc.
3. What are the main segments of the Lighting as a Service Market?
The market segments include End User.
4. Can you provide details about the market size?
The market size is estimated to be USD 3.5 billion as of 2022.
5. What are some drivers contributing to market growth?
; Government Policies for the Adoption of Energy-efficient Lighting Systems; Adoption of IoT with Lighting Systems.
6. What are the notable trends driving market growth?
Commercial Segment to Dominate the Market.
7. Are there any restraints impacting market growth?
4.; The global shift toward renewable sources for electricity generation.
8. Can you provide examples of recent developments in the market?
N/A
9. What pricing options are available for accessing the report?
Pricing options include single-user, multi-user, and enterprise licenses priced at USD 4750, USD 5250, and USD 8750 respectively.
10. Is the market size provided in terms of value or volume?
The market size is provided in terms of value, measured in billion.
11. Are there any specific market keywords associated with the report?
Yes, the market keyword associated with the report is "Lighting as a Service Market," which aids in identifying and referencing the specific market segment covered.
12. How do I determine which pricing option suits my needs best?
The pricing options vary based on user requirements and access needs. Individual users may opt for single-user licenses, while businesses requiring broader access may choose multi-user or enterprise licenses for cost-effective access to the report.
13. Are there any additional resources or data provided in the Lighting as a Service Market report?
While the report offers comprehensive insights, it's advisable to review the specific contents or supplementary materials provided to ascertain if additional resources or data are available.
14. How can I stay updated on further developments or reports in the Lighting as a Service Market?
To stay informed about further developments, trends, and reports in the Lighting as a Service Market, consider subscribing to industry newsletters, following relevant companies and organizations, or regularly checking reputable industry news sources and publications.
Methodology
Step 1 - Identification of Relevant Samples Size from Population Database


Step 2 - Approaches for Defining Global Market Size (Value, Volume* & Price*)

Note*: In applicable scenarios
Step 3 - Data Sources
Primary Research
- Web Analytics
- Survey Reports
- Research Institute
- Latest Research Reports
- Opinion Leaders
Secondary Research
- Annual Reports
- White Paper
- Latest Press Release
- Industry Association
- Paid Database
- Investor Presentations

Step 4 - Data Triangulation
Involves using different sources of information in order to increase the validity of a study
These sources are likely to be stakeholders in a program - participants, other researchers, program staff, other community members, and so on.
Then we put all data in single framework & apply various statistical tools to find out the dynamic on the market.
During the analysis stage, feedback from the stakeholder groups would be compared to determine areas of agreement as well as areas of divergence