

Key Insights
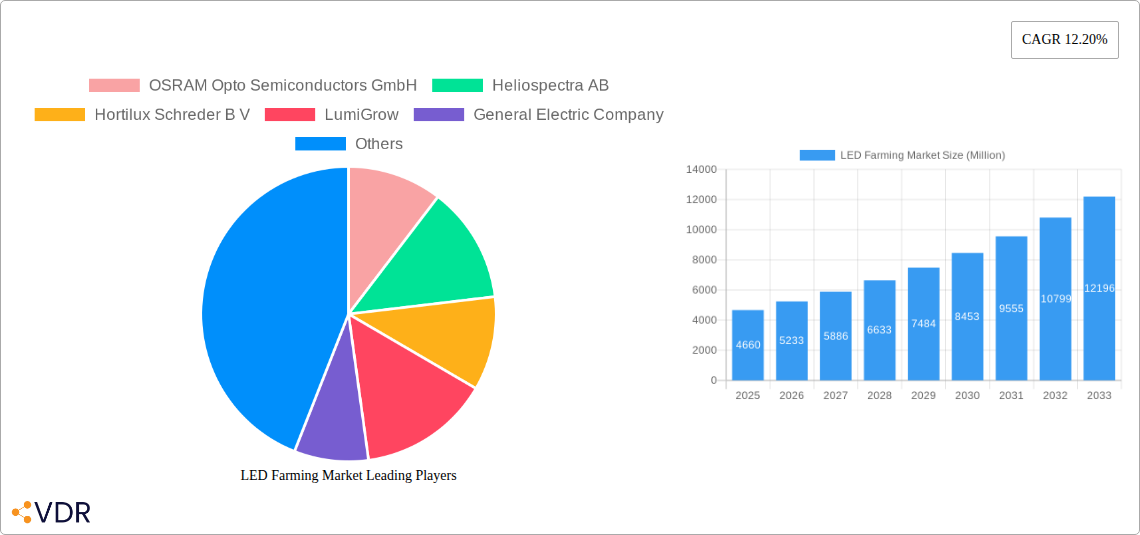
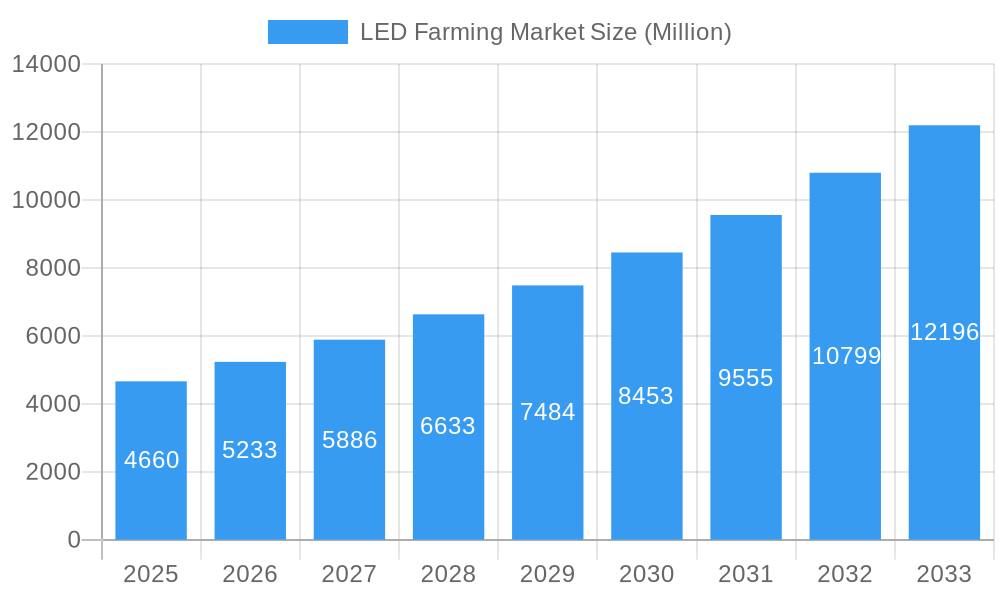
The global LED farming market, valued at $4.66 billion in 2025, is poised for substantial growth, exhibiting a Compound Annual Growth Rate (CAGR) of 12.20% from 2025 to 2033. This expansion is driven by several key factors. Firstly, the increasing demand for sustainable and high-yield agriculture is fueling the adoption of LED lighting solutions in controlled environment agriculture (CEA) settings like vertical farms, indoor farms, and commercial greenhouses. LED technology offers precise light spectrum control, optimizing plant growth and reducing energy consumption compared to traditional lighting methods. Secondly, advancements in LED technology, such as the development of customized wavelengths (blue, red, far-red) for specific crop types (fruits & vegetables, herbs & microgreens, flowers & ornamentals), are enhancing crop quality and yield. This precision allows farmers to tailor lighting to specific plant needs, maximizing productivity and profitability. Finally, growing consumer awareness of sustainable food production practices is further boosting market demand. Major players like OSRAM Opto Semiconductors GmbH, Heliospectra AB, and others are contributing to market growth through continuous innovation and the expansion of their product portfolios.
LED Farming Market Market Size (In Billion)
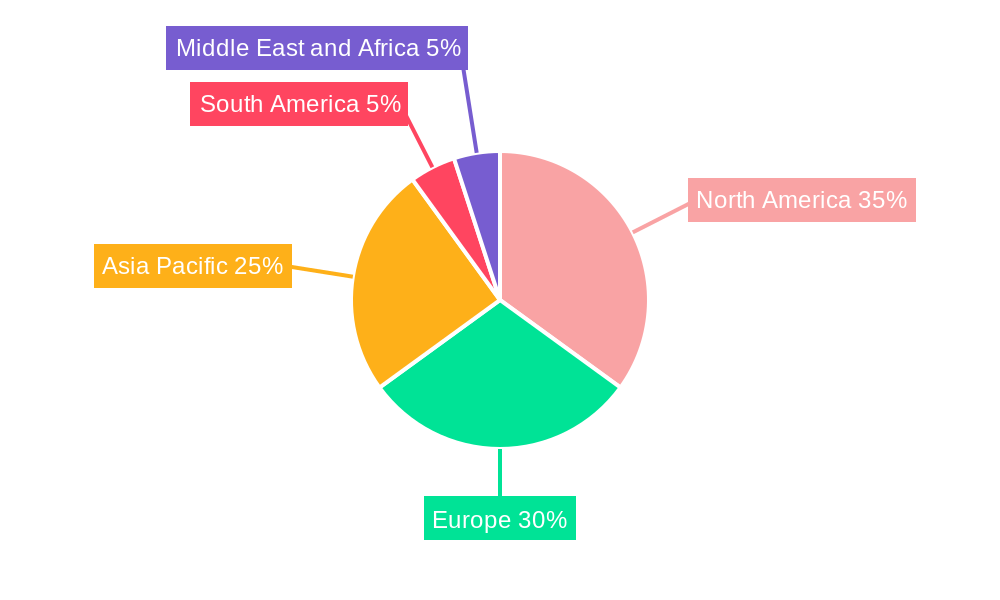
The market segmentation reveals significant opportunities across various applications and regions. Vertical farming and indoor farming are experiencing rapid growth due to their ability to overcome land limitations and environmental constraints. North America and Europe currently hold significant market shares, driven by early adoption and advanced agricultural technologies. However, the Asia-Pacific region is anticipated to witness significant growth in the coming years due to increasing urbanization, rising disposable incomes, and government support for agricultural modernization. While challenges exist, such as the relatively high initial investment costs of LED systems and the need for specialized technical expertise, the long-term benefits of improved yield, reduced energy consumption, and enhanced sustainability are expected to outweigh these limitations, ensuring consistent market expansion throughout the forecast period.
LED Farming Market Company Market Share
LED Farming Market: A Comprehensive Report (2019-2033)
This comprehensive report provides an in-depth analysis of the LED Farming market, encompassing its current state, future trajectory, and key players. The study period spans from 2019 to 2033, with 2025 serving as the base and estimated year. This report is crucial for industry professionals, investors, and stakeholders seeking a clear understanding of this rapidly evolving sector. The parent market is the broader agricultural technology sector, while the child markets include vertical farming, indoor farming, and greenhouse technologies. The global LED Farming market is projected to reach xx Million units by 2033.
LED Farming Market Dynamics & Structure
The LED Farming market exhibits a moderately concentrated structure, with several key players holding significant market share. Technological innovation, primarily in LED light spectrum control and energy efficiency, acts as a major driver. Stringent regulatory frameworks regarding energy consumption and environmental impact influence market dynamics. Competitive substitutes include traditional lighting solutions (HPS, MH), but LED’s superior energy efficiency and light spectrum control are increasingly favoring its adoption. End-user demographics are diversifying, with large-scale commercial operations alongside smaller-scale urban farms adopting LED technology. Mergers and acquisitions (M&A) activity has been moderate, with strategic partnerships and collaborations also playing a role in market consolidation.
- Market Concentration: Moderately concentrated, with top 5 players holding approximately xx% market share in 2025.
- Technological Innovation: Focus on spectral tuning, energy efficiency, and smart control systems.
- Regulatory Framework: Growing emphasis on sustainable agriculture and energy efficiency standards.
- M&A Activity: xx deals recorded between 2019-2024, with a projected xx deals for 2025-2033.
- Innovation Barriers: High initial investment costs, specialized knowledge requirements, and complexity of implementation.
LED Farming Market Growth Trends & Insights
The LED Farming market experienced substantial growth during the historical period (2019-2024), fueled by rising consumer demand for locally sourced produce, increasing awareness of sustainable agriculture practices, and technological advancements. The market size expanded from xx Million units in 2019 to xx Million units in 2024, exhibiting a CAGR of xx%. This upward trajectory is expected to continue, with the market projected to reach xx Million units by 2033, driven by factors such as increased adoption of vertical farming and the rising preference for year-round crop production. Technological disruptions, such as the development of advanced LED lighting systems with enhanced spectral control and improved energy efficiency, further accelerate market expansion. Consumer behavior shifts towards healthier and more sustainably produced food products reinforce this growth trend.
- Market Size (2019): xx Million units
- Market Size (2024): xx Million units
- Projected Market Size (2033): xx Million units
- CAGR (2019-2024): xx%
- Projected CAGR (2025-2033): xx%
- Market Penetration: xx% in 2024, projected to reach xx% by 2033.
Dominant Regions, Countries, or Segments in LED Farming Market
North America currently dominates the LED Farming market, driven by strong technological advancements, a supportive regulatory environment, and substantial investments in agricultural technology. Within North America, the United States holds the largest market share. Europe follows closely, showing significant growth potential owing to the rising adoption of vertical farming and increasing focus on sustainable agriculture. Asia-Pacific is also emerging as a significant market, particularly in countries such as China and Japan, driven by rising urbanization and increasing demand for fresh produce.
Dominant Segments:
- Application: Indoor farming currently holds the largest market share, followed by vertical farming and commercial greenhouses. The Turf and Landscaping segment is experiencing slower growth.
- Wavelength: Red and Blue wavelengths are most widely used, with Far-red wavelengths seeing increasing adoption for enhanced plant growth.
- Crop Type: Fruits & Vegetables constitute the largest segment, followed by Herbs & Microgreens.
Key Drivers:
- Strong government support and incentives for sustainable agriculture: Significant investments in research & development and tax benefits for LED farming technology adoption.
- Technological advancements leading to increased energy efficiency and crop yields: Improved lighting systems with precise spectral control.
- Rising consumer demand for locally sourced and sustainably produced food: Increased preference for fresh produce, year-round availability.
LED Farming Market Product Landscape
The LED Farming market offers a diverse range of products, from basic LED grow lights to sophisticated, spectrally-tuned systems with integrated sensors and control software. These systems vary significantly in terms of power consumption, light intensity, spectral composition, and price. Technological advancements focus on energy efficiency, spectral customization, smart control systems, and modular designs to cater to diverse applications and needs. Unique selling propositions include improved light quality and consistency leading to higher yields, energy savings, and automated control for optimized plant growth.
Key Drivers, Barriers & Challenges in LED Farming Market
Key Drivers:
- Rising demand for high-quality, locally sourced produce.
- Growing awareness of sustainable and environmentally friendly agriculture.
- Technological advancements leading to improved energy efficiency and crop yields.
- Government incentives and support for agricultural technology adoption.
Key Barriers and Challenges:
- High initial investment costs for LED lighting systems.
- Complexity of system implementation and maintenance.
- Lack of skilled workforce for system operation and management.
- Competition from traditional lighting technologies. This results in a xx% reduction in market adoption rate.
Emerging Opportunities in LED Farming Market
- Expansion into developing markets: Significant untapped potential in regions with growing populations and limited arable land.
- Development of specialized LED lighting systems for specific crop types: Tailored solutions to optimize growth for different plants.
- Integration of IoT and AI technologies: Smart farming solutions for real-time monitoring and control.
- Focus on energy-efficient and sustainable lighting solutions: Meeting growing demand for environmentally friendly agricultural practices.
Growth Accelerators in the LED Farming Market Industry
Technological breakthroughs in LED technology, including the development of more energy-efficient and spectrally tailored lighting systems, are significantly driving growth. Strategic partnerships between LED manufacturers, agricultural technology companies, and research institutions facilitate innovation and market expansion. Market expansion strategies focusing on untapped markets and emerging applications further accelerate the industry's growth trajectory.
Key Players Shaping the LED Farming Market Market
- OSRAM Opto Semiconductors GmbH
- Heliospectra AB
- Hortilux Schreder B V
- LumiGrow
- General Electric Company
- Gavita International B V
- Illumitex
- Koninklijke Philips N V
- Hubbell*List Not Exhaustive
- Smart Grow Systems Inc
Notable Milestones in LED Farming Market Sector
- 2020: LumiGrow launched a new line of energy-efficient LED grow lights.
- 2021: Heliospectra partnered with a major agricultural company to develop a customized LED lighting system for greenhouse operations.
- 2022: Significant investments were made in research & development to improve LED light efficacy and spectral control.
- 2023: Several mergers and acquisitions occurred within the LED farming sector, leading to market consolidation.
- 2024: New regulations regarding energy efficiency in agricultural lighting came into effect in several countries.
In-Depth LED Farming Market Market Outlook
The LED Farming market is poised for continued robust growth, driven by technological advancements, increased adoption rates, and strong demand for sustainable agriculture practices. Strategic opportunities exist in developing specialized lighting solutions for niche crop types, expanding into emerging markets, and integrating innovative technologies to create smart farming solutions. The long-term potential is significant, with the market expected to witness substantial expansion throughout the forecast period (2025-2033).
LED Farming Market Segmentation
- 1. Production Analysis
- 2. Consumption Analysis
- 3. Import Market Analysis (Value & Volume)
- 4. Export Market Analysis (Value & Volume)
- 5. Price Trend Analysis
LED Farming Market Segmentation By Geography
-
1. North America
- 1.1. United States
- 1.2. Canada
- 1.3. Mexico
-
2. South America
- 2.1. Brazil
- 2.2. Argentina
- 2.3. Rest of South America
-
3. Europe
- 3.1. United Kingdom
- 3.2. Germany
- 3.3. France
- 3.4. Italy
- 3.5. Spain
- 3.6. Russia
- 3.7. Benelux
- 3.8. Nordics
- 3.9. Rest of Europe
-
4. Middle East & Africa
- 4.1. Turkey
- 4.2. Israel
- 4.3. GCC
- 4.4. North Africa
- 4.5. South Africa
- 4.6. Rest of Middle East & Africa
-
5. Asia Pacific
- 5.1. China
- 5.2. India
- 5.3. Japan
- 5.4. South Korea
- 5.5. ASEAN
- 5.6. Oceania
- 5.7. Rest of Asia Pacific
LED Farming Market Regional Market Share
Geographic Coverage of LED Farming Market
LED Farming Market REPORT HIGHLIGHTS
| Aspects | Details |
|---|---|
| Study Period | 2020-2034 |
| Base Year | 2025 |
| Estimated Year | 2026 |
| Forecast Period | 2026-2034 |
| Historical Period | 2020-2025 |
| Growth Rate | CAGR of 12.20% from 2020-2034 |
| Segmentation |
|
Table of Contents
- 1. Introduction
- 1.1. Research Scope
- 1.2. Market Segmentation
- 1.3. Research Objective
- 1.4. Definitions and Assumptions
- 2. Executive Summary
- 2.1. Market Snapshot
- 3. Market Dynamics
- 3.1. Market Drivers
- 3.2. Market Restrains
- 3.3. Market Trends
- 3.4. Market Opportunities
- 4. Market Factor Analysis
- 4.1. Porters Five Forces
- 4.1.1. Bargaining Power of Suppliers
- 4.1.2. Bargaining Power of Buyers
- 4.1.3. Threat of New Entrants
- 4.1.4. Threat of Substitutes
- 4.1.5. Competitive Rivalry
- 4.2. PESTEL analysis
- 4.3. BCG Analysis
- 4.3.1. Stars (High Growth, High Market Share)
- 4.3.2. Cash Cows (Low Growth, High Market Share)
- 4.3.3. Question Mark (High Growth, Low Market Share)
- 4.3.4. Dogs (Low Growth, Low Market Share)
- 4.4. Ansoff Matrix Analysis
- 4.5. Supply Chain Analysis
- 4.6. Regulatory Landscape
- 4.7. Current Market Potential and Opportunity Assessment (TAM–SAM–SOM Framework)
- 4.8. VDR Analyst Note
- 4.1. Porters Five Forces
- 5. Market Analysis, Insights and Forecast 2021-2033
- 5.1. Market Analysis, Insights and Forecast - by Production Analysis
- 5.2. Market Analysis, Insights and Forecast - by Consumption Analysis
- 5.3. Market Analysis, Insights and Forecast - by Import Market Analysis (Value & Volume)
- 5.4. Market Analysis, Insights and Forecast - by Export Market Analysis (Value & Volume)
- 5.5. Market Analysis, Insights and Forecast - by Price Trend Analysis
- 5.6. Market Analysis, Insights and Forecast - by Region
- 5.6.1. North America
- 5.6.2. South America
- 5.6.3. Europe
- 5.6.4. Middle East & Africa
- 5.6.5. Asia Pacific
- 6. Global LED Farming Market Analysis, Insights and Forecast, 2021-2033
- 6.1. Market Analysis, Insights and Forecast - by Production Analysis
- 6.2. Market Analysis, Insights and Forecast - by Consumption Analysis
- 6.3. Market Analysis, Insights and Forecast - by Import Market Analysis (Value & Volume)
- 6.4. Market Analysis, Insights and Forecast - by Export Market Analysis (Value & Volume)
- 6.5. Market Analysis, Insights and Forecast - by Price Trend Analysis
- 7. North America LED Farming Market Analysis, Insights and Forecast, 2021-2033
- 7.1. Market Analysis, Insights and Forecast - by Production Analysis
- 7.2. Market Analysis, Insights and Forecast - by Consumption Analysis
- 7.3. Market Analysis, Insights and Forecast - by Import Market Analysis (Value & Volume)
- 7.4. Market Analysis, Insights and Forecast - by Export Market Analysis (Value & Volume)
- 7.5. Market Analysis, Insights and Forecast - by Price Trend Analysis
- 8. South America LED Farming Market Analysis, Insights and Forecast, 2021-2033
- 8.1. Market Analysis, Insights and Forecast - by Production Analysis
- 8.2. Market Analysis, Insights and Forecast - by Consumption Analysis
- 8.3. Market Analysis, Insights and Forecast - by Import Market Analysis (Value & Volume)
- 8.4. Market Analysis, Insights and Forecast - by Export Market Analysis (Value & Volume)
- 8.5. Market Analysis, Insights and Forecast - by Price Trend Analysis
- 9. Europe LED Farming Market Analysis, Insights and Forecast, 2021-2033
- 9.1. Market Analysis, Insights and Forecast - by Production Analysis
- 9.2. Market Analysis, Insights and Forecast - by Consumption Analysis
- 9.3. Market Analysis, Insights and Forecast - by Import Market Analysis (Value & Volume)
- 9.4. Market Analysis, Insights and Forecast - by Export Market Analysis (Value & Volume)
- 9.5. Market Analysis, Insights and Forecast - by Price Trend Analysis
- 10. Middle East & Africa LED Farming Market Analysis, Insights and Forecast, 2021-2033
- 10.1. Market Analysis, Insights and Forecast - by Production Analysis
- 10.2. Market Analysis, Insights and Forecast - by Consumption Analysis
- 10.3. Market Analysis, Insights and Forecast - by Import Market Analysis (Value & Volume)
- 10.4. Market Analysis, Insights and Forecast - by Export Market Analysis (Value & Volume)
- 10.5. Market Analysis, Insights and Forecast - by Price Trend Analysis
- 11. Asia Pacific LED Farming Market Analysis, Insights and Forecast, 2021-2033
- 11.1. Market Analysis, Insights and Forecast - by Production Analysis
- 11.2. Market Analysis, Insights and Forecast - by Consumption Analysis
- 11.3. Market Analysis, Insights and Forecast - by Import Market Analysis (Value & Volume)
- 11.4. Market Analysis, Insights and Forecast - by Export Market Analysis (Value & Volume)
- 11.5. Market Analysis, Insights and Forecast - by Price Trend Analysis
- 12. Competitive Analysis
- 12.1. Company Profiles
- 12.1.1 OSRAM Opto Semiconductors GmbH
- 12.1.1.1. Company Overview
- 12.1.1.2. Products
- 12.1.1.3. Company Financials
- 12.1.1.4. SWOT Analysis
- 12.1.2 Heliospectra AB
- 12.1.2.1. Company Overview
- 12.1.2.2. Products
- 12.1.2.3. Company Financials
- 12.1.2.4. SWOT Analysis
- 12.1.3 Hortilux Schreder B V
- 12.1.3.1. Company Overview
- 12.1.3.2. Products
- 12.1.3.3. Company Financials
- 12.1.3.4. SWOT Analysis
- 12.1.4 LumiGrow
- 12.1.4.1. Company Overview
- 12.1.4.2. Products
- 12.1.4.3. Company Financials
- 12.1.4.4. SWOT Analysis
- 12.1.5 General Electric Company
- 12.1.5.1. Company Overview
- 12.1.5.2. Products
- 12.1.5.3. Company Financials
- 12.1.5.4. SWOT Analysis
- 12.1.6 Gavita International B V
- 12.1.6.1. Company Overview
- 12.1.6.2. Products
- 12.1.6.3. Company Financials
- 12.1.6.4. SWOT Analysis
- 12.1.7 Illumitex
- 12.1.7.1. Company Overview
- 12.1.7.2. Products
- 12.1.7.3. Company Financials
- 12.1.7.4. SWOT Analysis
- 12.1.8 Koninklijke Philips N V
- 12.1.8.1. Company Overview
- 12.1.8.2. Products
- 12.1.8.3. Company Financials
- 12.1.8.4. SWOT Analysis
- 12.1.9 Hubbell*List Not Exhaustive
- 12.1.9.1. Company Overview
- 12.1.9.2. Products
- 12.1.9.3. Company Financials
- 12.1.9.4. SWOT Analysis
- 12.1.10 Smart Grow Systems Inc
- 12.1.10.1. Company Overview
- 12.1.10.2. Products
- 12.1.10.3. Company Financials
- 12.1.10.4. SWOT Analysis
- 12.1.1 OSRAM Opto Semiconductors GmbH
- 12.2. Market Entropy
- 12.2.1 Company's Key Areas Served
- 12.2.2 Recent Developments
- 12.3. Company Market Share Analysis 2025
- 12.3.1 Top 5 Companies Market Share Analysis
- 12.3.2 Top 3 Companies Market Share Analysis
- 12.4. List of Potential Customers
- 13. Research Methodology
List of Figures
- Figure 1: Global LED Farming Market Revenue Breakdown (Million, %) by Region 2025 & 2033
- Figure 2: North America LED Farming Market Revenue (Million), by Production Analysis 2025 & 2033
- Figure 3: North America LED Farming Market Revenue Share (%), by Production Analysis 2025 & 2033
- Figure 4: North America LED Farming Market Revenue (Million), by Consumption Analysis 2025 & 2033
- Figure 5: North America LED Farming Market Revenue Share (%), by Consumption Analysis 2025 & 2033
- Figure 6: North America LED Farming Market Revenue (Million), by Import Market Analysis (Value & Volume) 2025 & 2033
- Figure 7: North America LED Farming Market Revenue Share (%), by Import Market Analysis (Value & Volume) 2025 & 2033
- Figure 8: North America LED Farming Market Revenue (Million), by Export Market Analysis (Value & Volume) 2025 & 2033
- Figure 9: North America LED Farming Market Revenue Share (%), by Export Market Analysis (Value & Volume) 2025 & 2033
- Figure 10: North America LED Farming Market Revenue (Million), by Price Trend Analysis 2025 & 2033
- Figure 11: North America LED Farming Market Revenue Share (%), by Price Trend Analysis 2025 & 2033
- Figure 12: North America LED Farming Market Revenue (Million), by Country 2025 & 2033
- Figure 13: North America LED Farming Market Revenue Share (%), by Country 2025 & 2033
- Figure 14: South America LED Farming Market Revenue (Million), by Production Analysis 2025 & 2033
- Figure 15: South America LED Farming Market Revenue Share (%), by Production Analysis 2025 & 2033
- Figure 16: South America LED Farming Market Revenue (Million), by Consumption Analysis 2025 & 2033
- Figure 17: South America LED Farming Market Revenue Share (%), by Consumption Analysis 2025 & 2033
- Figure 18: South America LED Farming Market Revenue (Million), by Import Market Analysis (Value & Volume) 2025 & 2033
- Figure 19: South America LED Farming Market Revenue Share (%), by Import Market Analysis (Value & Volume) 2025 & 2033
- Figure 20: South America LED Farming Market Revenue (Million), by Export Market Analysis (Value & Volume) 2025 & 2033
- Figure 21: South America LED Farming Market Revenue Share (%), by Export Market Analysis (Value & Volume) 2025 & 2033
- Figure 22: South America LED Farming Market Revenue (Million), by Price Trend Analysis 2025 & 2033
- Figure 23: South America LED Farming Market Revenue Share (%), by Price Trend Analysis 2025 & 2033
- Figure 24: South America LED Farming Market Revenue (Million), by Country 2025 & 2033
- Figure 25: South America LED Farming Market Revenue Share (%), by Country 2025 & 2033
- Figure 26: Europe LED Farming Market Revenue (Million), by Production Analysis 2025 & 2033
- Figure 27: Europe LED Farming Market Revenue Share (%), by Production Analysis 2025 & 2033
- Figure 28: Europe LED Farming Market Revenue (Million), by Consumption Analysis 2025 & 2033
- Figure 29: Europe LED Farming Market Revenue Share (%), by Consumption Analysis 2025 & 2033
- Figure 30: Europe LED Farming Market Revenue (Million), by Import Market Analysis (Value & Volume) 2025 & 2033
- Figure 31: Europe LED Farming Market Revenue Share (%), by Import Market Analysis (Value & Volume) 2025 & 2033
- Figure 32: Europe LED Farming Market Revenue (Million), by Export Market Analysis (Value & Volume) 2025 & 2033
- Figure 33: Europe LED Farming Market Revenue Share (%), by Export Market Analysis (Value & Volume) 2025 & 2033
- Figure 34: Europe LED Farming Market Revenue (Million), by Price Trend Analysis 2025 & 2033
- Figure 35: Europe LED Farming Market Revenue Share (%), by Price Trend Analysis 2025 & 2033
- Figure 36: Europe LED Farming Market Revenue (Million), by Country 2025 & 2033
- Figure 37: Europe LED Farming Market Revenue Share (%), by Country 2025 & 2033
- Figure 38: Middle East & Africa LED Farming Market Revenue (Million), by Production Analysis 2025 & 2033
- Figure 39: Middle East & Africa LED Farming Market Revenue Share (%), by Production Analysis 2025 & 2033
- Figure 40: Middle East & Africa LED Farming Market Revenue (Million), by Consumption Analysis 2025 & 2033
- Figure 41: Middle East & Africa LED Farming Market Revenue Share (%), by Consumption Analysis 2025 & 2033
- Figure 42: Middle East & Africa LED Farming Market Revenue (Million), by Import Market Analysis (Value & Volume) 2025 & 2033
- Figure 43: Middle East & Africa LED Farming Market Revenue Share (%), by Import Market Analysis (Value & Volume) 2025 & 2033
- Figure 44: Middle East & Africa LED Farming Market Revenue (Million), by Export Market Analysis (Value & Volume) 2025 & 2033
- Figure 45: Middle East & Africa LED Farming Market Revenue Share (%), by Export Market Analysis (Value & Volume) 2025 & 2033
- Figure 46: Middle East & Africa LED Farming Market Revenue (Million), by Price Trend Analysis 2025 & 2033
- Figure 47: Middle East & Africa LED Farming Market Revenue Share (%), by Price Trend Analysis 2025 & 2033
- Figure 48: Middle East & Africa LED Farming Market Revenue (Million), by Country 2025 & 2033
- Figure 49: Middle East & Africa LED Farming Market Revenue Share (%), by Country 2025 & 2033
- Figure 50: Asia Pacific LED Farming Market Revenue (Million), by Production Analysis 2025 & 2033
- Figure 51: Asia Pacific LED Farming Market Revenue Share (%), by Production Analysis 2025 & 2033
- Figure 52: Asia Pacific LED Farming Market Revenue (Million), by Consumption Analysis 2025 & 2033
- Figure 53: Asia Pacific LED Farming Market Revenue Share (%), by Consumption Analysis 2025 & 2033
- Figure 54: Asia Pacific LED Farming Market Revenue (Million), by Import Market Analysis (Value & Volume) 2025 & 2033
- Figure 55: Asia Pacific LED Farming Market Revenue Share (%), by Import Market Analysis (Value & Volume) 2025 & 2033
- Figure 56: Asia Pacific LED Farming Market Revenue (Million), by Export Market Analysis (Value & Volume) 2025 & 2033
- Figure 57: Asia Pacific LED Farming Market Revenue Share (%), by Export Market Analysis (Value & Volume) 2025 & 2033
- Figure 58: Asia Pacific LED Farming Market Revenue (Million), by Price Trend Analysis 2025 & 2033
- Figure 59: Asia Pacific LED Farming Market Revenue Share (%), by Price Trend Analysis 2025 & 2033
- Figure 60: Asia Pacific LED Farming Market Revenue (Million), by Country 2025 & 2033
- Figure 61: Asia Pacific LED Farming Market Revenue Share (%), by Country 2025 & 2033
List of Tables
- Table 1: Global LED Farming Market Revenue Million Forecast, by Production Analysis 2020 & 2033
- Table 2: Global LED Farming Market Revenue Million Forecast, by Consumption Analysis 2020 & 2033
- Table 3: Global LED Farming Market Revenue Million Forecast, by Import Market Analysis (Value & Volume) 2020 & 2033
- Table 4: Global LED Farming Market Revenue Million Forecast, by Export Market Analysis (Value & Volume) 2020 & 2033
- Table 5: Global LED Farming Market Revenue Million Forecast, by Price Trend Analysis 2020 & 2033
- Table 6: Global LED Farming Market Revenue Million Forecast, by Region 2020 & 2033
- Table 7: Global LED Farming Market Revenue Million Forecast, by Production Analysis 2020 & 2033
- Table 8: Global LED Farming Market Revenue Million Forecast, by Consumption Analysis 2020 & 2033
- Table 9: Global LED Farming Market Revenue Million Forecast, by Import Market Analysis (Value & Volume) 2020 & 2033
- Table 10: Global LED Farming Market Revenue Million Forecast, by Export Market Analysis (Value & Volume) 2020 & 2033
- Table 11: Global LED Farming Market Revenue Million Forecast, by Price Trend Analysis 2020 & 2033
- Table 12: Global LED Farming Market Revenue Million Forecast, by Country 2020 & 2033
- Table 13: United States LED Farming Market Revenue (Million) Forecast, by Application 2020 & 2033
- Table 14: Canada LED Farming Market Revenue (Million) Forecast, by Application 2020 & 2033
- Table 15: Mexico LED Farming Market Revenue (Million) Forecast, by Application 2020 & 2033
- Table 16: Global LED Farming Market Revenue Million Forecast, by Production Analysis 2020 & 2033
- Table 17: Global LED Farming Market Revenue Million Forecast, by Consumption Analysis 2020 & 2033
- Table 18: Global LED Farming Market Revenue Million Forecast, by Import Market Analysis (Value & Volume) 2020 & 2033
- Table 19: Global LED Farming Market Revenue Million Forecast, by Export Market Analysis (Value & Volume) 2020 & 2033
- Table 20: Global LED Farming Market Revenue Million Forecast, by Price Trend Analysis 2020 & 2033
- Table 21: Global LED Farming Market Revenue Million Forecast, by Country 2020 & 2033
- Table 22: Brazil LED Farming Market Revenue (Million) Forecast, by Application 2020 & 2033
- Table 23: Argentina LED Farming Market Revenue (Million) Forecast, by Application 2020 & 2033
- Table 24: Rest of South America LED Farming Market Revenue (Million) Forecast, by Application 2020 & 2033
- Table 25: Global LED Farming Market Revenue Million Forecast, by Production Analysis 2020 & 2033
- Table 26: Global LED Farming Market Revenue Million Forecast, by Consumption Analysis 2020 & 2033
- Table 27: Global LED Farming Market Revenue Million Forecast, by Import Market Analysis (Value & Volume) 2020 & 2033
- Table 28: Global LED Farming Market Revenue Million Forecast, by Export Market Analysis (Value & Volume) 2020 & 2033
- Table 29: Global LED Farming Market Revenue Million Forecast, by Price Trend Analysis 2020 & 2033
- Table 30: Global LED Farming Market Revenue Million Forecast, by Country 2020 & 2033
- Table 31: United Kingdom LED Farming Market Revenue (Million) Forecast, by Application 2020 & 2033
- Table 32: Germany LED Farming Market Revenue (Million) Forecast, by Application 2020 & 2033
- Table 33: France LED Farming Market Revenue (Million) Forecast, by Application 2020 & 2033
- Table 34: Italy LED Farming Market Revenue (Million) Forecast, by Application 2020 & 2033
- Table 35: Spain LED Farming Market Revenue (Million) Forecast, by Application 2020 & 2033
- Table 36: Russia LED Farming Market Revenue (Million) Forecast, by Application 2020 & 2033
- Table 37: Benelux LED Farming Market Revenue (Million) Forecast, by Application 2020 & 2033
- Table 38: Nordics LED Farming Market Revenue (Million) Forecast, by Application 2020 & 2033
- Table 39: Rest of Europe LED Farming Market Revenue (Million) Forecast, by Application 2020 & 2033
- Table 40: Global LED Farming Market Revenue Million Forecast, by Production Analysis 2020 & 2033
- Table 41: Global LED Farming Market Revenue Million Forecast, by Consumption Analysis 2020 & 2033
- Table 42: Global LED Farming Market Revenue Million Forecast, by Import Market Analysis (Value & Volume) 2020 & 2033
- Table 43: Global LED Farming Market Revenue Million Forecast, by Export Market Analysis (Value & Volume) 2020 & 2033
- Table 44: Global LED Farming Market Revenue Million Forecast, by Price Trend Analysis 2020 & 2033
- Table 45: Global LED Farming Market Revenue Million Forecast, by Country 2020 & 2033
- Table 46: Turkey LED Farming Market Revenue (Million) Forecast, by Application 2020 & 2033
- Table 47: Israel LED Farming Market Revenue (Million) Forecast, by Application 2020 & 2033
- Table 48: GCC LED Farming Market Revenue (Million) Forecast, by Application 2020 & 2033
- Table 49: North Africa LED Farming Market Revenue (Million) Forecast, by Application 2020 & 2033
- Table 50: South Africa LED Farming Market Revenue (Million) Forecast, by Application 2020 & 2033
- Table 51: Rest of Middle East & Africa LED Farming Market Revenue (Million) Forecast, by Application 2020 & 2033
- Table 52: Global LED Farming Market Revenue Million Forecast, by Production Analysis 2020 & 2033
- Table 53: Global LED Farming Market Revenue Million Forecast, by Consumption Analysis 2020 & 2033
- Table 54: Global LED Farming Market Revenue Million Forecast, by Import Market Analysis (Value & Volume) 2020 & 2033
- Table 55: Global LED Farming Market Revenue Million Forecast, by Export Market Analysis (Value & Volume) 2020 & 2033
- Table 56: Global LED Farming Market Revenue Million Forecast, by Price Trend Analysis 2020 & 2033
- Table 57: Global LED Farming Market Revenue Million Forecast, by Country 2020 & 2033
- Table 58: China LED Farming Market Revenue (Million) Forecast, by Application 2020 & 2033
- Table 59: India LED Farming Market Revenue (Million) Forecast, by Application 2020 & 2033
- Table 60: Japan LED Farming Market Revenue (Million) Forecast, by Application 2020 & 2033
- Table 61: South Korea LED Farming Market Revenue (Million) Forecast, by Application 2020 & 2033
- Table 62: ASEAN LED Farming Market Revenue (Million) Forecast, by Application 2020 & 2033
- Table 63: Oceania LED Farming Market Revenue (Million) Forecast, by Application 2020 & 2033
- Table 64: Rest of Asia Pacific LED Farming Market Revenue (Million) Forecast, by Application 2020 & 2033
Frequently Asked Questions
1. What is the projected Compound Annual Growth Rate (CAGR) of the LED Farming Market?
The projected CAGR is approximately 12.20%.
2. Which companies are prominent players in the LED Farming Market?
Key companies in the market include OSRAM Opto Semiconductors GmbH, Heliospectra AB, Hortilux Schreder B V, LumiGrow, General Electric Company, Gavita International B V, Illumitex, Koninklijke Philips N V, Hubbell*List Not Exhaustive, Smart Grow Systems Inc.
3. What are the main segments of the LED Farming Market?
The market segments include Production Analysis, Consumption Analysis, Import Market Analysis (Value & Volume), Export Market Analysis (Value & Volume), Price Trend Analysis.
4. Can you provide details about the market size?
The market size is estimated to be USD 4.66 Million as of 2022.
5. What are some drivers contributing to market growth?
Skilled Labor Shortage; Favorable Government Policies.
6. What are the notable trends driving market growth?
Vertical Farming to Lead the LED Farming Market.
7. Are there any restraints impacting market growth?
Fragmentation of Land Holdings; Increasing Interest of Farmers Toward Custom Hiring Center.
8. Can you provide examples of recent developments in the market?
N/A
9. What pricing options are available for accessing the report?
Pricing options include single-user, multi-user, and enterprise licenses priced at USD 3800, USD 4500, and USD 5800 respectively.
10. Is the market size provided in terms of value or volume?
The market size is provided in terms of value, measured in Million.
11. Are there any specific market keywords associated with the report?
Yes, the market keyword associated with the report is "LED Farming Market," which aids in identifying and referencing the specific market segment covered.
12. How do I determine which pricing option suits my needs best?
The pricing options vary based on user requirements and access needs. Individual users may opt for single-user licenses, while businesses requiring broader access may choose multi-user or enterprise licenses for cost-effective access to the report.
13. Are there any additional resources or data provided in the LED Farming Market report?
While the report offers comprehensive insights, it's advisable to review the specific contents or supplementary materials provided to ascertain if additional resources or data are available.
14. How can I stay updated on further developments or reports in the LED Farming Market?
To stay informed about further developments, trends, and reports in the LED Farming Market, consider subscribing to industry newsletters, following relevant companies and organizations, or regularly checking reputable industry news sources and publications.
Methodology
Step 1 - Identification of Relevant Samples Size from Population Database


Step 2 - Approaches for Defining Global Market Size (Value, Volume* & Price*)

Note*: In applicable scenarios
Step 3 - Data Sources
Primary Research
- Web Analytics
- Survey Reports
- Research Institute
- Latest Research Reports
- Opinion Leaders
Secondary Research
- Annual Reports
- White Paper
- Latest Press Release
- Industry Association
- Paid Database
- Investor Presentations

Step 4 - Data Triangulation
Involves using different sources of information in order to increase the validity of a study
These sources are likely to be stakeholders in a program - participants, other researchers, program staff, other community members, and so on.
Then we put all data in single framework & apply various statistical tools to find out the dynamic on the market.
During the analysis stage, feedback from the stakeholder groups would be compared to determine areas of agreement as well as areas of divergence