

Key Insights
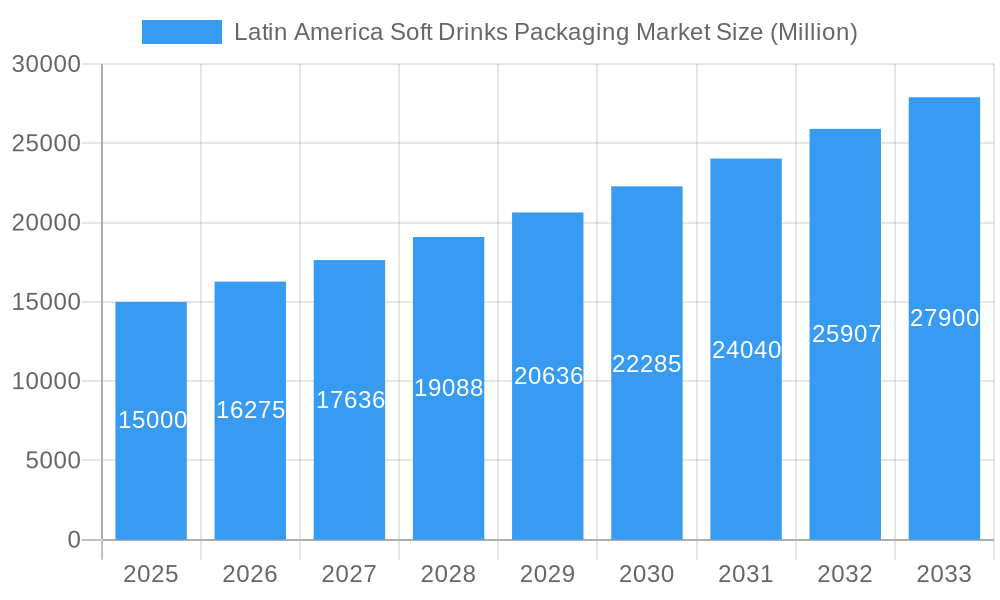
The Latin America soft drinks packaging market is poised for significant expansion, driven by rising soft drink consumption and a growing preference for convenient, appealing packaging solutions. With a current market size of $6791 million in the base year 2024, the market is projected to achieve a Compound Annual Growth Rate (CAGR) of 6.8%. This robust growth is attributed to increasing disposable incomes, enabling greater consumer spending on packaged beverages, and the rising trend of on-the-go consumption, which fuels demand for lightweight, portable options such as bottles and cans. The market is segmented by material, with plastic and metal packaging leading due to their cost-effectiveness and versatility for various beverage types including bottled water, carbonated drinks, juices, ready-to-drink (RTD) beverages, and sports drinks. Key contributors to market value include Brazil, Mexico, and Argentina, owing to their substantial populations and established beverage industries. Emerging markets like Peru and Chile also present considerable growth potential as consumer preferences and purchasing power evolve.
Latin America Soft Drinks Packaging Market Market Size (In Billion)
Despite positive market trajectories, challenges such as environmental concerns surrounding plastic waste are driving a gradual adoption of sustainable alternatives, though often at a higher cost. Volatile raw material prices and economic uncertainties in certain Latin American economies may also impact growth. Leading companies, including CAN-PACK SA, Ball Corporation, and Amcor PLC, are strategically responding by innovating packaging designs and materials to address sustainability while preserving product appeal and shelf life. The competitive environment, characterized by both global and regional players, fosters innovation and price dynamics. The forecast period anticipates sustained market growth, contingent upon stable economic conditions and ongoing consumer demand for convenient packaged beverages throughout the region.
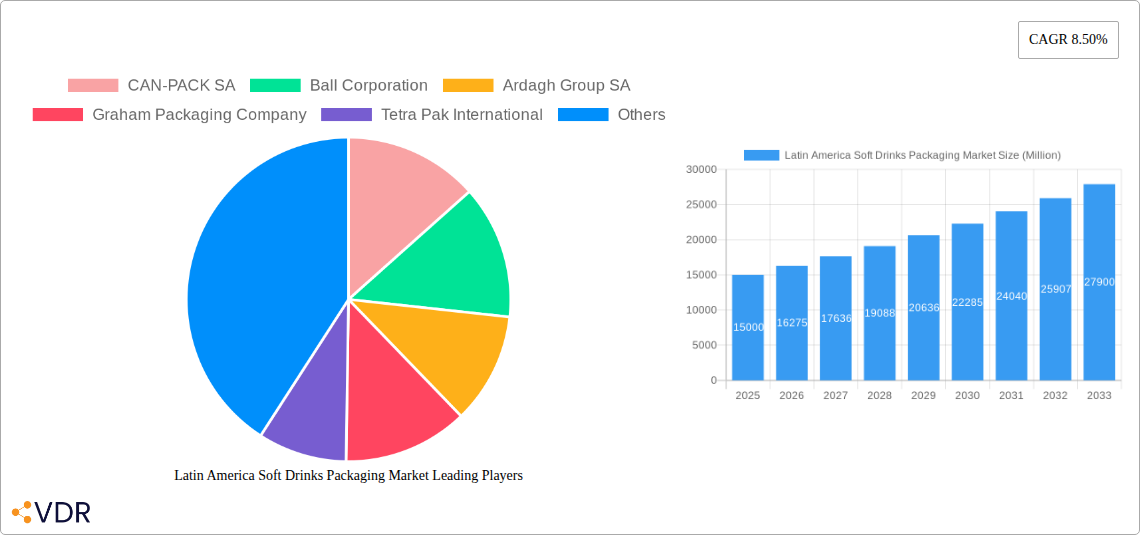
Latin America Soft Drinks Packaging Market Company Market Share
Latin America Soft Drinks Packaging Market: A Comprehensive Report (2019-2033)
This in-depth report provides a comprehensive analysis of the Latin America soft drinks packaging market, encompassing market dynamics, growth trends, dominant segments, key players, and future outlook. The study period covers 2019-2033, with 2025 as the base year and a forecast period of 2025-2033. The report is segmented by material (plastic, metal, glass, paper and paperboard), product type (bottles, cans, boxes, cartons), beverage type (bottled water, carbonated drinks, juices, RTD beverages, sports drinks), and country (Brazil, Mexico, Argentina, Rest of Latin America). The market size is presented in million units.
Latin America Soft Drinks Packaging Market Dynamics & Structure
This section analyzes the competitive landscape, technological advancements, regulatory influences, and market trends within the Latin American soft drinks packaging industry. The market is characterized by a moderately concentrated structure with several multinational players and regional players. Technological innovation, driven by sustainability concerns and consumer demand for convenience, is a key driver. Regulatory frameworks concerning material recyclability and environmental impact are continuously evolving, shaping packaging choices. The presence of substitute packaging materials and the influence of end-user demographics significantly impact market dynamics.
- Market Concentration: xx% market share held by the top 5 players (2024).
- Technological Innovation: Focus on lightweighting, sustainable materials (PEF, recycled content), and improved barrier properties.
- Regulatory Framework: Increasing emphasis on recyclability and reduced environmental footprint.
- Competitive Substitutes: Growth of alternative packaging solutions (e.g., biodegradable materials).
- End-User Demographics: Shifting consumer preferences towards healthier drinks and eco-friendly packaging.
- M&A Trends: xx M&A deals in the past 5 years (estimated), driven by expansion and consolidation. Innovation barriers include high R&D costs and regulatory approvals.
Latin America Soft Drinks Packaging Market Growth Trends & Insights
The Latin America soft drinks packaging market has witnessed significant growth during the historical period (2019-2024), driven by increasing consumption of soft drinks and evolving packaging preferences. This section details market size evolution, adoption rates of new technologies, disruptive innovations, and the impact of changing consumer behavior. The market exhibits a projected Compound Annual Growth Rate (CAGR) of xx% during the forecast period (2025-2033), primarily fueled by rising disposable incomes, population growth, and urbanization across the region. Technological disruptions, such as the introduction of plant-based materials and advancements in printing and labeling technologies, further contribute to market expansion. Consumer preferences toward sustainability are influencing packaging choices, leading to an increased demand for eco-friendly options.
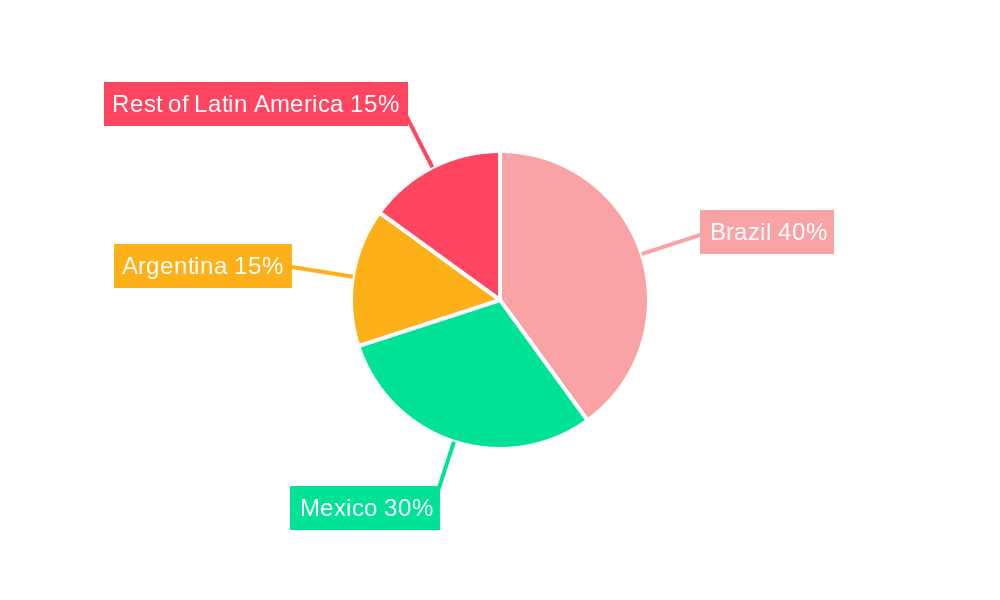
Dominant Regions, Countries, or Segments in Latin America Soft Drinks Packaging Market
Brazil and Mexico represent the largest segments in the Latin America soft drinks packaging market, driven by high soft drink consumption and established manufacturing infrastructure. The plastic segment dominates by material type due to its cost-effectiveness and versatility. Bottles are the most popular product type, followed by cans. Carbonated drinks and bottled water account for the largest share of beverage types packaged.
- Brazil: High soft drink consumption, robust manufacturing base, and favorable economic conditions.
- Mexico: Large population, significant foreign investment, and proximity to the US market.
- Argentina: Growing middle class and increasing demand for convenience packaging.
- Rest of Latin America: Moderate growth potential, influenced by varying economic and regulatory landscapes.
- By Material: Plastic's dominance due to cost-effectiveness; growth in sustainable alternatives like PEF.
- By Product Type: Bottles and cans lead, reflecting consumer preferences and beverage types.
- By Type: Carbonated soft drinks and bottled water dominate, followed by juices and RTD beverages.
Latin America Soft Drinks Packaging Market Product Landscape
The Latin America soft drinks packaging market features a diverse range of products, encompassing various materials, designs, and functionalities. Innovations focus on lightweighting, improved barrier properties, sustainable materials (e.g., recycled PET, PEF), and enhanced aesthetics. Key performance metrics include recyclability rates, barrier properties against oxygen and moisture, and cost-effectiveness. Unique selling propositions often involve sustainable attributes, convenience features, and brand differentiation through custom designs.
Key Drivers, Barriers & Challenges in Latin America Soft Drinks Packaging Market
Key Drivers: Rising disposable incomes, growing population, urbanization, increasing demand for convenience packaging, and the emergence of sustainable packaging materials.
Challenges: Fluctuations in raw material prices, stringent environmental regulations, increasing competition, and the need to adapt to changing consumer preferences. Supply chain disruptions due to geopolitical events have impacted raw material availability and transportation costs, leading to increased production costs (estimated impact: xx% increase in production costs in 2022). Regulatory hurdles related to material recyclability and labeling requirements pose challenges for manufacturers.
Emerging Opportunities in Latin America Soft Drinks Packaging Market
Growing demand for sustainable packaging solutions presents significant opportunities, with a focus on biodegradable and compostable materials, as well as increased use of recycled content. Evolving consumer preferences towards healthier beverages and functional drinks create demand for innovative packaging formats and designs. Untapped markets in smaller Latin American countries offer substantial growth potential.
Growth Accelerators in the Latin America Soft Drinks Packaging Market Industry
Technological advancements, strategic partnerships, and focused investments in sustainable packaging solutions are key growth accelerators. The adoption of innovative materials, such as PEF, and the development of advanced recycling technologies are driving market expansion. Collaboration between packaging manufacturers and beverage companies to enhance supply chains is crucial for fostering growth.
Key Players Shaping the Latin America Soft Drinks Packaging Market
- CAN-PACK SA
- Ball Corporation
- Ardagh Group SA
- Graham Packaging Company
- Tetra Pak International
- Amcor PLC
- Victory Packaging
- Crown Holdings Incorporated
- Trivium Packaging
- Refresco Group NV
- List Not Exhaustive
Notable Milestones in Latin America Soft Drinks Packaging Market Sector
- August 2022: Avantium N.V. and AmBev sign an agreement for PEF bottles.
- February 2022: Coca-Cola announces a goal to increase reusable packaging by 25% by 2030.
In-Depth Latin America Soft Drinks Packaging Market Outlook
The Latin America soft drinks packaging market is poised for sustained growth, driven by increasing demand, technological innovation, and a focus on sustainability. Strategic partnerships and investments in sustainable solutions will be crucial for long-term success. Opportunities exist in exploring new materials, enhancing recyclability, and catering to evolving consumer preferences. The market is expected to experience robust growth, particularly in the segments focusing on eco-friendly packaging solutions.
Latin America Soft Drinks Packaging Market Segmentation
-
1. Material
- 1.1. Plastic
- 1.2. Metal
- 1.3. Glass
- 1.4. Paper and Paperboard
-
2. Product Type
- 2.1. Bottles
- 2.2. Cans
- 2.3. Boxes
- 2.4. Cartons
-
3. Type
- 3.1. Bottled Water
- 3.2. Carbonated Drinks
- 3.3. Juices
- 3.4. RTD Beverages
- 3.5. Sport Drinks
Latin America Soft Drinks Packaging Market Segmentation By Geography
-
1. Latin America
- 1.1. Brazil
- 1.2. Argentina
- 1.3. Chile
- 1.4. Colombia
- 1.5. Mexico
- 1.6. Peru
- 1.7. Venezuela
- 1.8. Ecuador
- 1.9. Bolivia
- 1.10. Paraguay
Latin America Soft Drinks Packaging Market Regional Market Share
Geographic Coverage of Latin America Soft Drinks Packaging Market
Latin America Soft Drinks Packaging Market REPORT HIGHLIGHTS
| Aspects | Details |
|---|---|
| Study Period | 2020-2034 |
| Base Year | 2025 |
| Estimated Year | 2026 |
| Forecast Period | 2026-2034 |
| Historical Period | 2020-2025 |
| Growth Rate | CAGR of 6.8% from 2020-2034 |
| Segmentation |
|
Table of Contents
- 1. Introduction
- 1.1. Research Scope
- 1.2. Market Segmentation
- 1.3. Research Objective
- 1.4. Definitions and Assumptions
- 2. Executive Summary
- 2.1. Market Snapshot
- 3. Market Dynamics
- 3.1. Market Drivers
- 3.2. Market Restrains
- 3.3. Market Trends
- 3.4. Market Opportunities
- 4. Market Factor Analysis
- 4.1. Porters Five Forces
- 4.1.1. Bargaining Power of Suppliers
- 4.1.2. Bargaining Power of Buyers
- 4.1.3. Threat of New Entrants
- 4.1.4. Threat of Substitutes
- 4.1.5. Competitive Rivalry
- 4.2. PESTEL analysis
- 4.3. BCG Analysis
- 4.3.1. Stars (High Growth, High Market Share)
- 4.3.2. Cash Cows (Low Growth, High Market Share)
- 4.3.3. Question Mark (High Growth, Low Market Share)
- 4.3.4. Dogs (Low Growth, Low Market Share)
- 4.4. Ansoff Matrix Analysis
- 4.5. Supply Chain Analysis
- 4.6. Regulatory Landscape
- 4.7. Current Market Potential and Opportunity Assessment (TAM–SAM–SOM Framework)
- 4.8. VDR Analyst Note
- 4.1. Porters Five Forces
- 5. Market Analysis, Insights and Forecast 2021-2033
- 5.1. Market Analysis, Insights and Forecast - by Material
- 5.1.1. Plastic
- 5.1.2. Metal
- 5.1.3. Glass
- 5.1.4. Paper and Paperboard
- 5.2. Market Analysis, Insights and Forecast - by Product Type
- 5.2.1. Bottles
- 5.2.2. Cans
- 5.2.3. Boxes
- 5.2.4. Cartons
- 5.3. Market Analysis, Insights and Forecast - by Type
- 5.3.1. Bottled Water
- 5.3.2. Carbonated Drinks
- 5.3.3. Juices
- 5.3.4. RTD Beverages
- 5.3.5. Sport Drinks
- 5.4. Market Analysis, Insights and Forecast - by Region
- 5.4.1. Latin America
- 5.1. Market Analysis, Insights and Forecast - by Material
- 6. Latin America Soft Drinks Packaging Market Analysis, Insights and Forecast, 2021-2033
- 6.1. Market Analysis, Insights and Forecast - by Material
- 6.1.1. Plastic
- 6.1.2. Metal
- 6.1.3. Glass
- 6.1.4. Paper and Paperboard
- 6.2. Market Analysis, Insights and Forecast - by Product Type
- 6.2.1. Bottles
- 6.2.2. Cans
- 6.2.3. Boxes
- 6.2.4. Cartons
- 6.3. Market Analysis, Insights and Forecast - by Type
- 6.3.1. Bottled Water
- 6.3.2. Carbonated Drinks
- 6.3.3. Juices
- 6.3.4. RTD Beverages
- 6.3.5. Sport Drinks
- 6.1. Market Analysis, Insights and Forecast - by Material
- 7. Competitive Analysis
- 7.1. Company Profiles
- 7.1.1 CAN-PACK SA
- 7.1.1.1. Company Overview
- 7.1.1.2. Products
- 7.1.1.3. Company Financials
- 7.1.1.4. SWOT Analysis
- 7.1.2 Ball Corporation
- 7.1.2.1. Company Overview
- 7.1.2.2. Products
- 7.1.2.3. Company Financials
- 7.1.2.4. SWOT Analysis
- 7.1.3 Ardagh Group SA
- 7.1.3.1. Company Overview
- 7.1.3.2. Products
- 7.1.3.3. Company Financials
- 7.1.3.4. SWOT Analysis
- 7.1.4 Graham Packaging Company
- 7.1.4.1. Company Overview
- 7.1.4.2. Products
- 7.1.4.3. Company Financials
- 7.1.4.4. SWOT Analysis
- 7.1.5 Tetra Pak International
- 7.1.5.1. Company Overview
- 7.1.5.2. Products
- 7.1.5.3. Company Financials
- 7.1.5.4. SWOT Analysis
- 7.1.6 Amcor PLC
- 7.1.6.1. Company Overview
- 7.1.6.2. Products
- 7.1.6.3. Company Financials
- 7.1.6.4. SWOT Analysis
- 7.1.7 Victory Packaging
- 7.1.7.1. Company Overview
- 7.1.7.2. Products
- 7.1.7.3. Company Financials
- 7.1.7.4. SWOT Analysis
- 7.1.8 Crown Holdings Incorporated
- 7.1.8.1. Company Overview
- 7.1.8.2. Products
- 7.1.8.3. Company Financials
- 7.1.8.4. SWOT Analysis
- 7.1.9 Trivium Packaging*List Not Exhaustive
- 7.1.9.1. Company Overview
- 7.1.9.2. Products
- 7.1.9.3. Company Financials
- 7.1.9.4. SWOT Analysis
- 7.1.10 Refresco Group NV
- 7.1.10.1. Company Overview
- 7.1.10.2. Products
- 7.1.10.3. Company Financials
- 7.1.10.4. SWOT Analysis
- 7.1.1 CAN-PACK SA
- 7.2. Market Entropy
- 7.2.1 Company's Key Areas Served
- 7.2.2 Recent Developments
- 7.3. Company Market Share Analysis 2025
- 7.3.1 Top 5 Companies Market Share Analysis
- 7.3.2 Top 3 Companies Market Share Analysis
- 7.4. List of Potential Customers
- 8. Research Methodology
List of Figures
- Figure 1: Latin America Soft Drinks Packaging Market Revenue Breakdown (million, %) by Product 2025 & 2033
- Figure 2: Latin America Soft Drinks Packaging Market Share (%) by Company 2025
List of Tables
- Table 1: Latin America Soft Drinks Packaging Market Revenue million Forecast, by Material 2020 & 2033
- Table 2: Latin America Soft Drinks Packaging Market Revenue million Forecast, by Product Type 2020 & 2033
- Table 3: Latin America Soft Drinks Packaging Market Revenue million Forecast, by Type 2020 & 2033
- Table 4: Latin America Soft Drinks Packaging Market Revenue million Forecast, by Region 2020 & 2033
- Table 5: Latin America Soft Drinks Packaging Market Revenue million Forecast, by Material 2020 & 2033
- Table 6: Latin America Soft Drinks Packaging Market Revenue million Forecast, by Product Type 2020 & 2033
- Table 7: Latin America Soft Drinks Packaging Market Revenue million Forecast, by Type 2020 & 2033
- Table 8: Latin America Soft Drinks Packaging Market Revenue million Forecast, by Country 2020 & 2033
- Table 9: Brazil Latin America Soft Drinks Packaging Market Revenue (million) Forecast, by Application 2020 & 2033
- Table 10: Argentina Latin America Soft Drinks Packaging Market Revenue (million) Forecast, by Application 2020 & 2033
- Table 11: Chile Latin America Soft Drinks Packaging Market Revenue (million) Forecast, by Application 2020 & 2033
- Table 12: Colombia Latin America Soft Drinks Packaging Market Revenue (million) Forecast, by Application 2020 & 2033
- Table 13: Mexico Latin America Soft Drinks Packaging Market Revenue (million) Forecast, by Application 2020 & 2033
- Table 14: Peru Latin America Soft Drinks Packaging Market Revenue (million) Forecast, by Application 2020 & 2033
- Table 15: Venezuela Latin America Soft Drinks Packaging Market Revenue (million) Forecast, by Application 2020 & 2033
- Table 16: Ecuador Latin America Soft Drinks Packaging Market Revenue (million) Forecast, by Application 2020 & 2033
- Table 17: Bolivia Latin America Soft Drinks Packaging Market Revenue (million) Forecast, by Application 2020 & 2033
- Table 18: Paraguay Latin America Soft Drinks Packaging Market Revenue (million) Forecast, by Application 2020 & 2033
Frequently Asked Questions
1. What is the projected Compound Annual Growth Rate (CAGR) of the Latin America Soft Drinks Packaging Market?
The projected CAGR is approximately 6.8%.
2. Which companies are prominent players in the Latin America Soft Drinks Packaging Market?
Key companies in the market include CAN-PACK SA, Ball Corporation, Ardagh Group SA, Graham Packaging Company, Tetra Pak International, Amcor PLC, Victory Packaging, Crown Holdings Incorporated, Trivium Packaging*List Not Exhaustive, Refresco Group NV.
3. What are the main segments of the Latin America Soft Drinks Packaging Market?
The market segments include Material, Product Type, Type.
4. Can you provide details about the market size?
The market size is estimated to be USD 6791 million as of 2022.
5. What are some drivers contributing to market growth?
Increasing Disposable Income and Growing Economies; Growing Demand for Ready-to-use Drinks.
6. What are the notable trends driving market growth?
Plastic is Expected to Hold the Significant Share.
7. Are there any restraints impacting market growth?
Stringent Government Regulations Against Non-biodegradable Products.
8. Can you provide examples of recent developments in the market?
August 2022 : Avantium N.V., one of the leading technology companies in renewable chemistry, signed an offtake agreement with the Brazilian brewing company AmBev. Through this agreement, AmBev will purchase PEF (polyethylene furanoate), a 100% plant-based and recyclable alternative to plastic from Avantium's Flagship Plant, and will use it to make bottles for its soft drinks portfolio.
9. What pricing options are available for accessing the report?
Pricing options include single-user, multi-user, and enterprise licenses priced at USD 4750, USD 4950, and USD 6800 respectively.
10. Is the market size provided in terms of value or volume?
The market size is provided in terms of value, measured in million.
11. Are there any specific market keywords associated with the report?
Yes, the market keyword associated with the report is "Latin America Soft Drinks Packaging Market," which aids in identifying and referencing the specific market segment covered.
12. How do I determine which pricing option suits my needs best?
The pricing options vary based on user requirements and access needs. Individual users may opt for single-user licenses, while businesses requiring broader access may choose multi-user or enterprise licenses for cost-effective access to the report.
13. Are there any additional resources or data provided in the Latin America Soft Drinks Packaging Market report?
While the report offers comprehensive insights, it's advisable to review the specific contents or supplementary materials provided to ascertain if additional resources or data are available.
14. How can I stay updated on further developments or reports in the Latin America Soft Drinks Packaging Market?
To stay informed about further developments, trends, and reports in the Latin America Soft Drinks Packaging Market, consider subscribing to industry newsletters, following relevant companies and organizations, or regularly checking reputable industry news sources and publications.
Methodology
Step 1 - Identification of Relevant Samples Size from Population Database


Step 2 - Approaches for Defining Global Market Size (Value, Volume* & Price*)

Note*: In applicable scenarios
Step 3 - Data Sources
Primary Research
- Web Analytics
- Survey Reports
- Research Institute
- Latest Research Reports
- Opinion Leaders
Secondary Research
- Annual Reports
- White Paper
- Latest Press Release
- Industry Association
- Paid Database
- Investor Presentations

Step 4 - Data Triangulation
Involves using different sources of information in order to increase the validity of a study
These sources are likely to be stakeholders in a program - participants, other researchers, program staff, other community members, and so on.
Then we put all data in single framework & apply various statistical tools to find out the dynamic on the market.
During the analysis stage, feedback from the stakeholder groups would be compared to determine areas of agreement as well as areas of divergence