

Key Insights
The Latin American oilfield chemicals market is poised for steady expansion, driven by robust oil and gas exploration and production (E&P) activities across key South American nations. With a projected CAGR of 2.8%, the market is set to reach $2758.4 million by 2025. This growth is underpinned by the increasing demand for enhanced oil recovery (EOR) techniques in mature fields, the development of deepwater and unconventional resources, and government-led initiatives to bolster energy security. Major chemical segments, including biocides, corrosion and scale inhibitors, and demulsifiers, are experiencing significant traction due to their essential role in optimizing operational efficiency and safety.
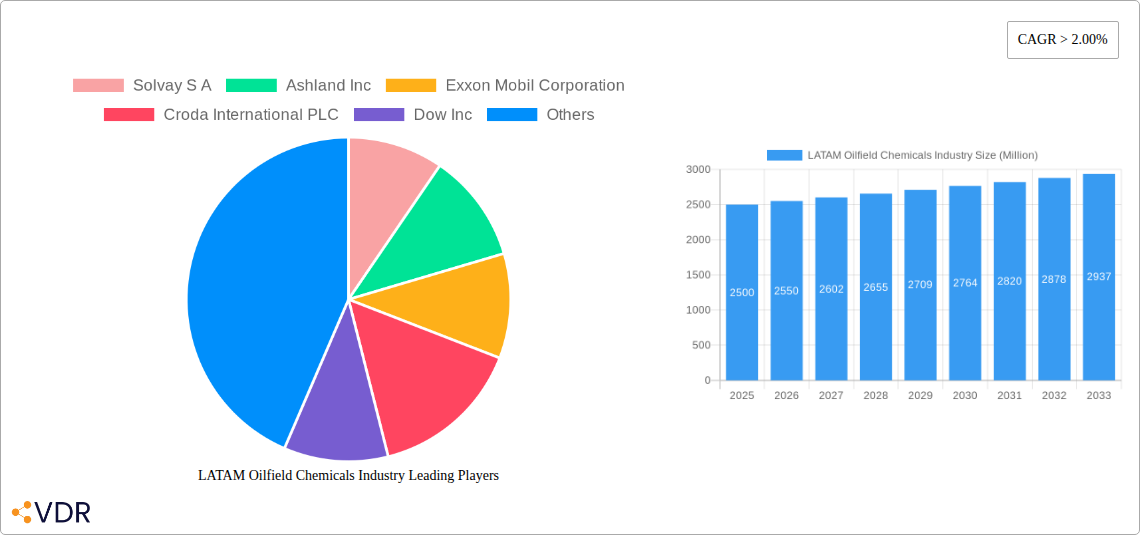
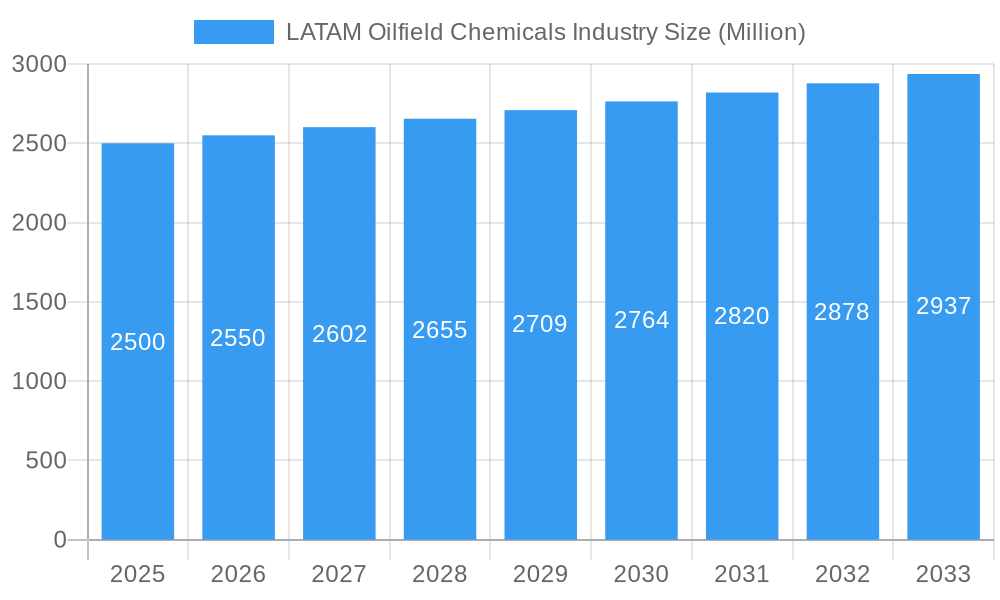
LATAM Oilfield Chemicals Industry Market Size (In Billion)
Despite prevailing economic volatility and fluctuating crude oil prices, the long-term outlook for the LATAM oilfield chemicals market remains optimistic, supported by ongoing investments in infrastructure upgrades and exploration endeavors. However, the market faces constraints such as logistical challenges stemming from regional infrastructure limitations and increasingly stringent environmental regulations. These factors necessitate the development and adoption of sustainable, eco-friendly chemical solutions, presenting both challenges and significant opportunities for innovation. The competitive landscape is characterized by the presence of both global majors and agile regional enterprises. Strategic success hinges on adaptability to market dynamics, sustained investment in research and development, and the cultivation of strong partnerships with local E&P operators. A nuanced understanding of specific market sub-segments within LATAM will be crucial for effective market penetration and strategic positioning.
LATAM Oilfield Chemicals Industry Company Market Share
LATAM Oilfield Chemicals Industry: A Comprehensive Market Report (2019-2033)
This in-depth report provides a comprehensive analysis of the Latin American oilfield chemicals market, offering invaluable insights for industry professionals, investors, and strategic decision-makers. Covering the period from 2019 to 2033, with a focus on 2025, this report delves into market dynamics, growth trends, key players, and future opportunities within this dynamic sector. The report analyzes parent markets (Oil & Gas Exploration and Production) and child markets (specific chemical types and applications) to deliver granular market understanding. The total market size in 2025 is estimated at XX Million.
LATAM Oilfield Chemicals Industry Market Dynamics & Structure
The LATAM oilfield chemicals market is characterized by a moderately concentrated landscape, with a few multinational corporations holding significant market share. The market's growth is driven by technological innovations aimed at enhancing efficiency and reducing environmental impact. Stringent regulatory frameworks focused on environmental protection and worker safety influence operations and product development. Competition exists from alternative chemical solutions and pressure from substitution with more efficient technologies. End-user demographics are largely shaped by the activity levels in the upstream oil and gas sector, and M&A activity reflects the quest for economies of scale and technological advancement.
- Market Concentration: The top 5 players hold approximately xx% of the market share in 2025.
- Technological Innovation: Focus on enhanced oil recovery (EOR) techniques and environmentally friendly chemicals fuels innovation.
- Regulatory Framework: Compliance with increasingly stringent environmental regulations drives the demand for sustainable chemical solutions.
- Competitive Substitutes: Bio-based and biodegradable chemicals are emerging as competitive substitutes.
- M&A Trends: Consolidation is expected to continue, with larger players acquiring smaller companies to expand their product portfolios and geographical reach. An estimated xx M&A deals are projected for 2025–2033.
- Innovation Barriers: High R&D costs and regulatory approvals present challenges to innovation.
LATAM Oilfield Chemicals Industry Growth Trends & Insights
The LATAM oilfield chemicals market is expected to experience robust growth throughout the forecast period (2025-2033). Driven by increasing oil and gas exploration and production activities, coupled with the adoption of advanced technologies such as hydraulic fracturing and horizontal drilling, the market is poised for significant expansion. The rising demand for enhanced oil recovery (EOR) techniques and the growing focus on sustainable and environmentally friendly solutions further contribute to the market's growth trajectory. Consumer behavior shifts towards improved operational efficiency and reduced environmental footprint are also impactful.
The market size is projected to reach XX Million by 2033, exhibiting a Compound Annual Growth Rate (CAGR) of xx% during the forecast period. Market penetration for specialized chemicals is expected to increase significantly. Technological disruptions, such as the development of nanotechnology-based chemicals, are expected to revolutionize the industry.
Dominant Regions, Countries, or Segments in LATAM Oilfield Chemicals Industry
Brazil, Mexico, and Colombia are the leading countries in the LATAM oilfield chemicals market. Within chemical types, corrosion and scale inhibitors, and demulsifiers hold the largest market share due to their critical role in oil and gas production. The drilling and cementing application segment dominates due to its extensive usage in well construction.
- Key Drivers:
- Increasing oil and gas production in Brazil and Mexico.
- Government incentives for oil and gas exploration.
- Growing adoption of enhanced oil recovery (EOR) techniques.
- Dominance Factors:
- High oil and gas reserves.
- Well-established oil and gas infrastructure.
- Favorable government policies supporting energy sector development.
- Growth potential in unconventional oil and gas resources.
LATAM Oilfield Chemicals Industry Product Landscape
The LATAM oilfield chemicals market is characterized by a diverse range of products, including biocides, corrosion and scale inhibitors, demulsifiers, polymers, surfactants, and other specialty chemicals. These chemicals are formulated to meet the specific demands of various applications in drilling and cementing, enhanced oil recovery, production, well stimulation, and workover and completion operations. Recent innovations focus on improving performance, reducing environmental impact, and enhancing operational efficiency. Unique selling propositions include extended operational life, reduced chemical consumption, and improved environmental compatibility.
Key Drivers, Barriers & Challenges in LATAM Oilfield Chemicals Industry
Key Drivers: Rising oil and gas production, the implementation of advanced drilling techniques (e.g., fracking), and government support for the energy sector are key drivers. Technological advancements in chemical formulations leading to improved efficiency and environmental performance also contribute positively.
Challenges & Restraints: Fluctuations in oil prices, environmental regulations, and the competitive landscape present challenges. Supply chain disruptions due to geopolitical factors and logistical constraints impact availability and cost. Regulatory hurdles for new product approvals can delay market entry. Intense competition from both established players and new entrants put pressure on margins.
Emerging Opportunities in LATAM Oilfield Chemicals Industry
Untapped markets in less explored regions of Latin America, the growing demand for sustainable and environmentally friendly oilfield chemicals, and the increasing adoption of digital technologies for optimizing chemical usage offer significant opportunities. Further research in specialized chemicals for EOR applications and the development of innovative solutions to address unique challenges in specific geological formations provide ample opportunities for growth.
Growth Accelerators in the LATAM Oilfield Chemicals Industry
Technological breakthroughs in chemical formulations, strategic partnerships between chemical suppliers and oilfield service companies, and expansion into new geographical markets in Latin America will accelerate growth. Focus on efficient supply chains, sustainability initiatives, and the development of tailored solutions for specific applications are poised to propel the market forward.
Key Players Shaping the LATAM Oilfield Chemicals Industry Market
Notable Milestones in LATAM Oilfield Chemicals Industry Sector
- August 2022: Baker Hughes established a new oilfield services chemicals manufacturing facility in Singapore, enhancing its global reach and operational efficiency.
- March 2022: Halliburton opened a new chemical reaction plant in Saudi Arabia, expanding its manufacturing capacity and strengthening its position in the Middle East.
In-Depth LATAM Oilfield Chemicals Industry Market Outlook
The LATAM oilfield chemicals market is poised for significant growth, driven by sustained investments in oil and gas exploration and production, technological advancements, and increasing demand for sustainable solutions. Strategic partnerships and expansions into new markets will shape the competitive landscape, presenting both opportunities and challenges. The market’s future potential is robust, particularly considering the vast reserves and ongoing exploration activities in the region. Companies that focus on innovation, sustainability, and efficient operations are best positioned for success in this evolving market.
LATAM Oilfield Chemicals Industry Segmentation
-
1. Chemical Type
- 1.1. Biocide
- 1.2. Corrosion and Scale Inhibitor
- 1.3. Demulsifier
- 1.4. Polymer
- 1.5. Surfactant
- 1.6. Other Chemical Types
-
2. Application
- 2.1. Drilling and Cementing
- 2.2. Enhanced Oil Recovery
- 2.3. Production
- 2.4. Well Stimulation
- 2.5. Workover and Completion
LATAM Oilfield Chemicals Industry Segmentation By Geography
- 1. Mexico
- 2. Brazil
- 3. Colombia
- 4. Argentina
- 5. Peru
- 6. Ecuador
- 7. Rest of Latin America
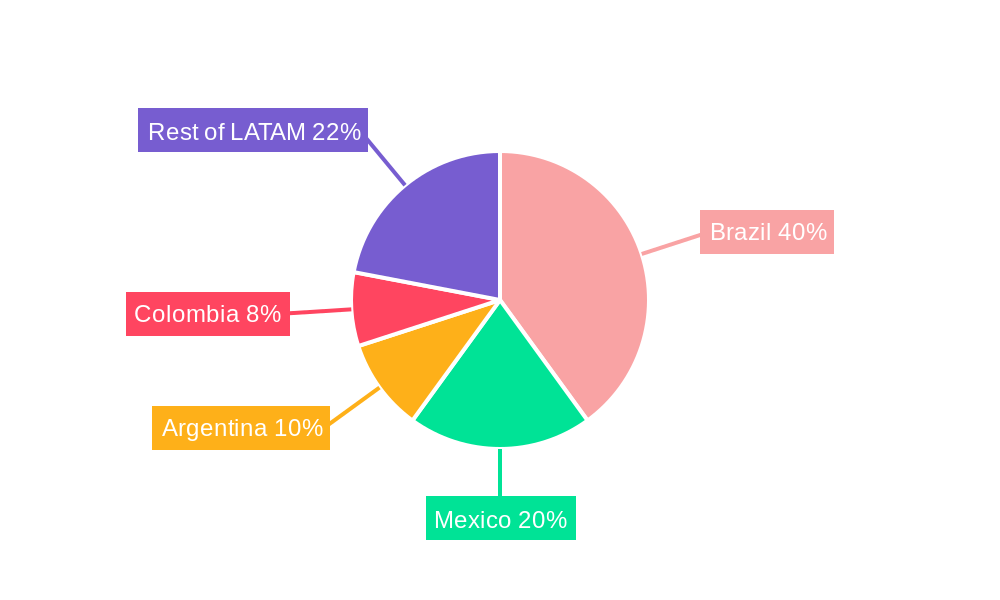
LATAM Oilfield Chemicals Industry Regional Market Share
Geographic Coverage of LATAM Oilfield Chemicals Industry
LATAM Oilfield Chemicals Industry REPORT HIGHLIGHTS
| Aspects | Details |
|---|---|
| Study Period | 2020-2034 |
| Base Year | 2025 |
| Estimated Year | 2026 |
| Forecast Period | 2026-2034 |
| Historical Period | 2020-2025 |
| Growth Rate | CAGR of 2.8% from 2020-2034 |
| Segmentation |
|
Table of Contents
- 1. Introduction
- 1.1. Research Scope
- 1.2. Market Segmentation
- 1.3. Research Objective
- 1.4. Definitions and Assumptions
- 2. Executive Summary
- 2.1. Market Snapshot
- 3. Market Dynamics
- 3.1. Market Drivers
- 3.2. Market Restrains
- 3.3. Market Trends
- 3.4. Market Opportunities
- 4. Market Factor Analysis
- 4.1. Porters Five Forces
- 4.1.1. Bargaining Power of Suppliers
- 4.1.2. Bargaining Power of Buyers
- 4.1.3. Threat of New Entrants
- 4.1.4. Threat of Substitutes
- 4.1.5. Competitive Rivalry
- 4.2. PESTEL analysis
- 4.3. BCG Analysis
- 4.3.1. Stars (High Growth, High Market Share)
- 4.3.2. Cash Cows (Low Growth, High Market Share)
- 4.3.3. Question Mark (High Growth, Low Market Share)
- 4.3.4. Dogs (Low Growth, Low Market Share)
- 4.4. Ansoff Matrix Analysis
- 4.5. Supply Chain Analysis
- 4.6. Regulatory Landscape
- 4.7. Current Market Potential and Opportunity Assessment (TAM–SAM–SOM Framework)
- 4.8. VDR Analyst Note
- 4.1. Porters Five Forces
- 5. Market Analysis, Insights and Forecast 2021-2033
- 5.1. Market Analysis, Insights and Forecast - by Chemical Type
- 5.1.1. Biocide
- 5.1.2. Corrosion and Scale Inhibitor
- 5.1.3. Demulsifier
- 5.1.4. Polymer
- 5.1.5. Surfactant
- 5.1.6. Other Chemical Types
- 5.2. Market Analysis, Insights and Forecast - by Application
- 5.2.1. Drilling and Cementing
- 5.2.2. Enhanced Oil Recovery
- 5.2.3. Production
- 5.2.4. Well Stimulation
- 5.2.5. Workover and Completion
- 5.3. Market Analysis, Insights and Forecast - by Region
- 5.3.1. Mexico
- 5.3.2. Brazil
- 5.3.3. Colombia
- 5.3.4. Argentina
- 5.3.5. Peru
- 5.3.6. Ecuador
- 5.3.7. Rest of Latin America
- 5.1. Market Analysis, Insights and Forecast - by Chemical Type
- 6. LATAM Oilfield Chemicals Industry Analysis, Insights and Forecast, 2021-2033
- 6.1. Market Analysis, Insights and Forecast - by Chemical Type
- 6.1.1. Biocide
- 6.1.2. Corrosion and Scale Inhibitor
- 6.1.3. Demulsifier
- 6.1.4. Polymer
- 6.1.5. Surfactant
- 6.1.6. Other Chemical Types
- 6.2. Market Analysis, Insights and Forecast - by Application
- 6.2.1. Drilling and Cementing
- 6.2.2. Enhanced Oil Recovery
- 6.2.3. Production
- 6.2.4. Well Stimulation
- 6.2.5. Workover and Completion
- 6.1. Market Analysis, Insights and Forecast - by Chemical Type
- 7. Mexico LATAM Oilfield Chemicals Industry Analysis, Insights and Forecast, 2021-2033
- 7.1. Market Analysis, Insights and Forecast - by Chemical Type
- 7.1.1. Biocide
- 7.1.2. Corrosion and Scale Inhibitor
- 7.1.3. Demulsifier
- 7.1.4. Polymer
- 7.1.5. Surfactant
- 7.1.6. Other Chemical Types
- 7.2. Market Analysis, Insights and Forecast - by Application
- 7.2.1. Drilling and Cementing
- 7.2.2. Enhanced Oil Recovery
- 7.2.3. Production
- 7.2.4. Well Stimulation
- 7.2.5. Workover and Completion
- 7.1. Market Analysis, Insights and Forecast - by Chemical Type
- 8. Brazil LATAM Oilfield Chemicals Industry Analysis, Insights and Forecast, 2021-2033
- 8.1. Market Analysis, Insights and Forecast - by Chemical Type
- 8.1.1. Biocide
- 8.1.2. Corrosion and Scale Inhibitor
- 8.1.3. Demulsifier
- 8.1.4. Polymer
- 8.1.5. Surfactant
- 8.1.6. Other Chemical Types
- 8.2. Market Analysis, Insights and Forecast - by Application
- 8.2.1. Drilling and Cementing
- 8.2.2. Enhanced Oil Recovery
- 8.2.3. Production
- 8.2.4. Well Stimulation
- 8.2.5. Workover and Completion
- 8.1. Market Analysis, Insights and Forecast - by Chemical Type
- 9. Colombia LATAM Oilfield Chemicals Industry Analysis, Insights and Forecast, 2021-2033
- 9.1. Market Analysis, Insights and Forecast - by Chemical Type
- 9.1.1. Biocide
- 9.1.2. Corrosion and Scale Inhibitor
- 9.1.3. Demulsifier
- 9.1.4. Polymer
- 9.1.5. Surfactant
- 9.1.6. Other Chemical Types
- 9.2. Market Analysis, Insights and Forecast - by Application
- 9.2.1. Drilling and Cementing
- 9.2.2. Enhanced Oil Recovery
- 9.2.3. Production
- 9.2.4. Well Stimulation
- 9.2.5. Workover and Completion
- 9.1. Market Analysis, Insights and Forecast - by Chemical Type
- 10. Argentina LATAM Oilfield Chemicals Industry Analysis, Insights and Forecast, 2021-2033
- 10.1. Market Analysis, Insights and Forecast - by Chemical Type
- 10.1.1. Biocide
- 10.1.2. Corrosion and Scale Inhibitor
- 10.1.3. Demulsifier
- 10.1.4. Polymer
- 10.1.5. Surfactant
- 10.1.6. Other Chemical Types
- 10.2. Market Analysis, Insights and Forecast - by Application
- 10.2.1. Drilling and Cementing
- 10.2.2. Enhanced Oil Recovery
- 10.2.3. Production
- 10.2.4. Well Stimulation
- 10.2.5. Workover and Completion
- 10.1. Market Analysis, Insights and Forecast - by Chemical Type
- 11. Peru LATAM Oilfield Chemicals Industry Analysis, Insights and Forecast, 2021-2033
- 11.1. Market Analysis, Insights and Forecast - by Chemical Type
- 11.1.1. Biocide
- 11.1.2. Corrosion and Scale Inhibitor
- 11.1.3. Demulsifier
- 11.1.4. Polymer
- 11.1.5. Surfactant
- 11.1.6. Other Chemical Types
- 11.2. Market Analysis, Insights and Forecast - by Application
- 11.2.1. Drilling and Cementing
- 11.2.2. Enhanced Oil Recovery
- 11.2.3. Production
- 11.2.4. Well Stimulation
- 11.2.5. Workover and Completion
- 11.1. Market Analysis, Insights and Forecast - by Chemical Type
- 12. Ecuador LATAM Oilfield Chemicals Industry Analysis, Insights and Forecast, 2021-2033
- 12.1. Market Analysis, Insights and Forecast - by Chemical Type
- 12.1.1. Biocide
- 12.1.2. Corrosion and Scale Inhibitor
- 12.1.3. Demulsifier
- 12.1.4. Polymer
- 12.1.5. Surfactant
- 12.1.6. Other Chemical Types
- 12.2. Market Analysis, Insights and Forecast - by Application
- 12.2.1. Drilling and Cementing
- 12.2.2. Enhanced Oil Recovery
- 12.2.3. Production
- 12.2.4. Well Stimulation
- 12.2.5. Workover and Completion
- 12.1. Market Analysis, Insights and Forecast - by Chemical Type
- 13. Rest of Latin America LATAM Oilfield Chemicals Industry Analysis, Insights and Forecast, 2021-2033
- 13.1. Market Analysis, Insights and Forecast - by Chemical Type
- 13.1.1. Biocide
- 13.1.2. Corrosion and Scale Inhibitor
- 13.1.3. Demulsifier
- 13.1.4. Polymer
- 13.1.5. Surfactant
- 13.1.6. Other Chemical Types
- 13.2. Market Analysis, Insights and Forecast - by Application
- 13.2.1. Drilling and Cementing
- 13.2.2. Enhanced Oil Recovery
- 13.2.3. Production
- 13.2.4. Well Stimulation
- 13.2.5. Workover and Completion
- 13.1. Market Analysis, Insights and Forecast - by Chemical Type
- 14. Competitive Analysis
- 14.1. Company Profiles
- 14.1.1 Solvay S A
- 14.1.1.1. Company Overview
- 14.1.1.2. Products
- 14.1.1.3. Company Financials
- 14.1.1.4. SWOT Analysis
- 14.1.2 Ashland Inc
- 14.1.2.1. Company Overview
- 14.1.2.2. Products
- 14.1.2.3. Company Financials
- 14.1.2.4. SWOT Analysis
- 14.1.3 Exxon Mobil Corporation
- 14.1.3.1. Company Overview
- 14.1.3.2. Products
- 14.1.3.3. Company Financials
- 14.1.3.4. SWOT Analysis
- 14.1.4 Croda International PLC
- 14.1.4.1. Company Overview
- 14.1.4.2. Products
- 14.1.4.3. Company Financials
- 14.1.4.4. SWOT Analysis
- 14.1.5 Dow Inc
- 14.1.5.1. Company Overview
- 14.1.5.2. Products
- 14.1.5.3. Company Financials
- 14.1.5.4. SWOT Analysis
- 14.1.6 Weatherford International Plc
- 14.1.6.1. Company Overview
- 14.1.6.2. Products
- 14.1.6.3. Company Financials
- 14.1.6.4. SWOT Analysis
- 14.1.7 BASF SE
- 14.1.7.1. Company Overview
- 14.1.7.2. Products
- 14.1.7.3. Company Financials
- 14.1.7.4. SWOT Analysis
- 14.1.8 Huntsman International LLC
- 14.1.8.1. Company Overview
- 14.1.8.2. Products
- 14.1.8.3. Company Financials
- 14.1.8.4. SWOT Analysis
- 14.1.9 Baker Hughes Company
- 14.1.9.1. Company Overview
- 14.1.9.2. Products
- 14.1.9.3. Company Financials
- 14.1.9.4. SWOT Analysis
- 14.1.10 Halliburton
- 14.1.10.1. Company Overview
- 14.1.10.2. Products
- 14.1.10.3. Company Financials
- 14.1.10.4. SWOT Analysis
- 14.1.11 Ecolab Inc
- 14.1.11.1. Company Overview
- 14.1.11.2. Products
- 14.1.11.3. Company Financials
- 14.1.11.4. SWOT Analysis
- 14.1.12 Petrolab Industrial E Comercial Ltda
- 14.1.12.1. Company Overview
- 14.1.12.2. Products
- 14.1.12.3. Company Financials
- 14.1.12.4. SWOT Analysis
- 14.1.13 Schlumberger Limited
- 14.1.13.1. Company Overview
- 14.1.13.2. Products
- 14.1.13.3. Company Financials
- 14.1.13.4. SWOT Analysis
- 14.1.14 Clariant AG
- 14.1.14.1. Company Overview
- 14.1.14.2. Products
- 14.1.14.3. Company Financials
- 14.1.14.4. SWOT Analysis
- 14.1.1 Solvay S A
- 14.2. Market Entropy
- 14.2.1 Company's Key Areas Served
- 14.2.2 Recent Developments
- 14.3. Company Market Share Analysis 2025
- 14.3.1 Top 5 Companies Market Share Analysis
- 14.3.2 Top 3 Companies Market Share Analysis
- 14.4. List of Potential Customers
- 15. Research Methodology
List of Figures
- Figure 1: LATAM Oilfield Chemicals Industry Revenue Breakdown (million, %) by Product 2025 & 2033
- Figure 2: LATAM Oilfield Chemicals Industry Share (%) by Company 2025
List of Tables
- Table 1: LATAM Oilfield Chemicals Industry Revenue million Forecast, by Chemical Type 2020 & 2033
- Table 2: LATAM Oilfield Chemicals Industry Volume K Tons Forecast, by Chemical Type 2020 & 2033
- Table 3: LATAM Oilfield Chemicals Industry Revenue million Forecast, by Application 2020 & 2033
- Table 4: LATAM Oilfield Chemicals Industry Volume K Tons Forecast, by Application 2020 & 2033
- Table 5: LATAM Oilfield Chemicals Industry Revenue million Forecast, by Region 2020 & 2033
- Table 6: LATAM Oilfield Chemicals Industry Volume K Tons Forecast, by Region 2020 & 2033
- Table 7: LATAM Oilfield Chemicals Industry Revenue million Forecast, by Chemical Type 2020 & 2033
- Table 8: LATAM Oilfield Chemicals Industry Volume K Tons Forecast, by Chemical Type 2020 & 2033
- Table 9: LATAM Oilfield Chemicals Industry Revenue million Forecast, by Application 2020 & 2033
- Table 10: LATAM Oilfield Chemicals Industry Volume K Tons Forecast, by Application 2020 & 2033
- Table 11: LATAM Oilfield Chemicals Industry Revenue million Forecast, by Country 2020 & 2033
- Table 12: LATAM Oilfield Chemicals Industry Volume K Tons Forecast, by Country 2020 & 2033
- Table 13: LATAM Oilfield Chemicals Industry Revenue million Forecast, by Chemical Type 2020 & 2033
- Table 14: LATAM Oilfield Chemicals Industry Volume K Tons Forecast, by Chemical Type 2020 & 2033
- Table 15: LATAM Oilfield Chemicals Industry Revenue million Forecast, by Application 2020 & 2033
- Table 16: LATAM Oilfield Chemicals Industry Volume K Tons Forecast, by Application 2020 & 2033
- Table 17: LATAM Oilfield Chemicals Industry Revenue million Forecast, by Country 2020 & 2033
- Table 18: LATAM Oilfield Chemicals Industry Volume K Tons Forecast, by Country 2020 & 2033
- Table 19: LATAM Oilfield Chemicals Industry Revenue million Forecast, by Chemical Type 2020 & 2033
- Table 20: LATAM Oilfield Chemicals Industry Volume K Tons Forecast, by Chemical Type 2020 & 2033
- Table 21: LATAM Oilfield Chemicals Industry Revenue million Forecast, by Application 2020 & 2033
- Table 22: LATAM Oilfield Chemicals Industry Volume K Tons Forecast, by Application 2020 & 2033
- Table 23: LATAM Oilfield Chemicals Industry Revenue million Forecast, by Country 2020 & 2033
- Table 24: LATAM Oilfield Chemicals Industry Volume K Tons Forecast, by Country 2020 & 2033
- Table 25: LATAM Oilfield Chemicals Industry Revenue million Forecast, by Chemical Type 2020 & 2033
- Table 26: LATAM Oilfield Chemicals Industry Volume K Tons Forecast, by Chemical Type 2020 & 2033
- Table 27: LATAM Oilfield Chemicals Industry Revenue million Forecast, by Application 2020 & 2033
- Table 28: LATAM Oilfield Chemicals Industry Volume K Tons Forecast, by Application 2020 & 2033
- Table 29: LATAM Oilfield Chemicals Industry Revenue million Forecast, by Country 2020 & 2033
- Table 30: LATAM Oilfield Chemicals Industry Volume K Tons Forecast, by Country 2020 & 2033
- Table 31: LATAM Oilfield Chemicals Industry Revenue million Forecast, by Chemical Type 2020 & 2033
- Table 32: LATAM Oilfield Chemicals Industry Volume K Tons Forecast, by Chemical Type 2020 & 2033
- Table 33: LATAM Oilfield Chemicals Industry Revenue million Forecast, by Application 2020 & 2033
- Table 34: LATAM Oilfield Chemicals Industry Volume K Tons Forecast, by Application 2020 & 2033
- Table 35: LATAM Oilfield Chemicals Industry Revenue million Forecast, by Country 2020 & 2033
- Table 36: LATAM Oilfield Chemicals Industry Volume K Tons Forecast, by Country 2020 & 2033
- Table 37: LATAM Oilfield Chemicals Industry Revenue million Forecast, by Chemical Type 2020 & 2033
- Table 38: LATAM Oilfield Chemicals Industry Volume K Tons Forecast, by Chemical Type 2020 & 2033
- Table 39: LATAM Oilfield Chemicals Industry Revenue million Forecast, by Application 2020 & 2033
- Table 40: LATAM Oilfield Chemicals Industry Volume K Tons Forecast, by Application 2020 & 2033
- Table 41: LATAM Oilfield Chemicals Industry Revenue million Forecast, by Country 2020 & 2033
- Table 42: LATAM Oilfield Chemicals Industry Volume K Tons Forecast, by Country 2020 & 2033
- Table 43: LATAM Oilfield Chemicals Industry Revenue million Forecast, by Chemical Type 2020 & 2033
- Table 44: LATAM Oilfield Chemicals Industry Volume K Tons Forecast, by Chemical Type 2020 & 2033
- Table 45: LATAM Oilfield Chemicals Industry Revenue million Forecast, by Application 2020 & 2033
- Table 46: LATAM Oilfield Chemicals Industry Volume K Tons Forecast, by Application 2020 & 2033
- Table 47: LATAM Oilfield Chemicals Industry Revenue million Forecast, by Country 2020 & 2033
- Table 48: LATAM Oilfield Chemicals Industry Volume K Tons Forecast, by Country 2020 & 2033
Frequently Asked Questions
1. What is the projected Compound Annual Growth Rate (CAGR) of the LATAM Oilfield Chemicals Industry?
The projected CAGR is approximately 2.8%.
2. Which companies are prominent players in the LATAM Oilfield Chemicals Industry?
Key companies in the market include Solvay S A, Ashland Inc, Exxon Mobil Corporation, Croda International PLC, Dow Inc, Weatherford International Plc, BASF SE, Huntsman International LLC, Baker Hughes Company, Halliburton, Ecolab Inc, Petrolab Industrial E Comercial Ltda, Schlumberger Limited, Clariant AG.
3. What are the main segments of the LATAM Oilfield Chemicals Industry?
The market segments include Chemical Type, Application.
4. Can you provide details about the market size?
The market size is estimated to be USD 2758.4 million as of 2022.
5. What are some drivers contributing to market growth?
Increasing Offshore activities in Brazil. Mexico & Argentina.
6. What are the notable trends driving market growth?
Increasing Demand from the Drilling and Cementing Segment.
7. Are there any restraints impacting market growth?
Downfall of Venezuela Economy.
8. Can you provide examples of recent developments in the market?
August 2022: Baker Hughes expanded its presence in Asia by establishing a new oilfield services chemicals manufacturing facility in Singapore, allowing for manufacturing optimization and faster delivery of fit-for-purpose chemical solutions. The 40,000-square-meter facility will manufacture, store, and distribute chemical solutions for the upstream, midstream, downstream, and adjacent industries.
9. What pricing options are available for accessing the report?
Pricing options include single-user, multi-user, and enterprise licenses priced at USD 4750, USD 5250, and USD 8750 respectively.
10. Is the market size provided in terms of value or volume?
The market size is provided in terms of value, measured in million and volume, measured in K Tons.
11. Are there any specific market keywords associated with the report?
Yes, the market keyword associated with the report is "LATAM Oilfield Chemicals Industry," which aids in identifying and referencing the specific market segment covered.
12. How do I determine which pricing option suits my needs best?
The pricing options vary based on user requirements and access needs. Individual users may opt for single-user licenses, while businesses requiring broader access may choose multi-user or enterprise licenses for cost-effective access to the report.
13. Are there any additional resources or data provided in the LATAM Oilfield Chemicals Industry report?
While the report offers comprehensive insights, it's advisable to review the specific contents or supplementary materials provided to ascertain if additional resources or data are available.
14. How can I stay updated on further developments or reports in the LATAM Oilfield Chemicals Industry?
To stay informed about further developments, trends, and reports in the LATAM Oilfield Chemicals Industry, consider subscribing to industry newsletters, following relevant companies and organizations, or regularly checking reputable industry news sources and publications.
Methodology
Step 1 - Identification of Relevant Samples Size from Population Database


Step 2 - Approaches for Defining Global Market Size (Value, Volume* & Price*)

Note*: In applicable scenarios
Step 3 - Data Sources
Primary Research
- Web Analytics
- Survey Reports
- Research Institute
- Latest Research Reports
- Opinion Leaders
Secondary Research
- Annual Reports
- White Paper
- Latest Press Release
- Industry Association
- Paid Database
- Investor Presentations

Step 4 - Data Triangulation
Involves using different sources of information in order to increase the validity of a study
These sources are likely to be stakeholders in a program - participants, other researchers, program staff, other community members, and so on.
Then we put all data in single framework & apply various statistical tools to find out the dynamic on the market.
During the analysis stage, feedback from the stakeholder groups would be compared to determine areas of agreement as well as areas of divergence