

Key Insights
The Global Irrigation Management Software Market is projected for significant expansion, anticipated to reach $7.2 billion by 2025, at a Compound Annual Growth Rate (CAGR) of 11.5%. This growth is driven by the widespread adoption of precision agriculture and the imperative for efficient water management in agriculture. Cloud-based solutions are expected to lead, offering scalability, remote access, and advanced analytics to optimize irrigation, minimize water waste, and enhance crop yields. The integration of IoT sensors and AI-powered insights further bolsters real-time monitoring and predictive analytics for intelligent irrigation strategies.
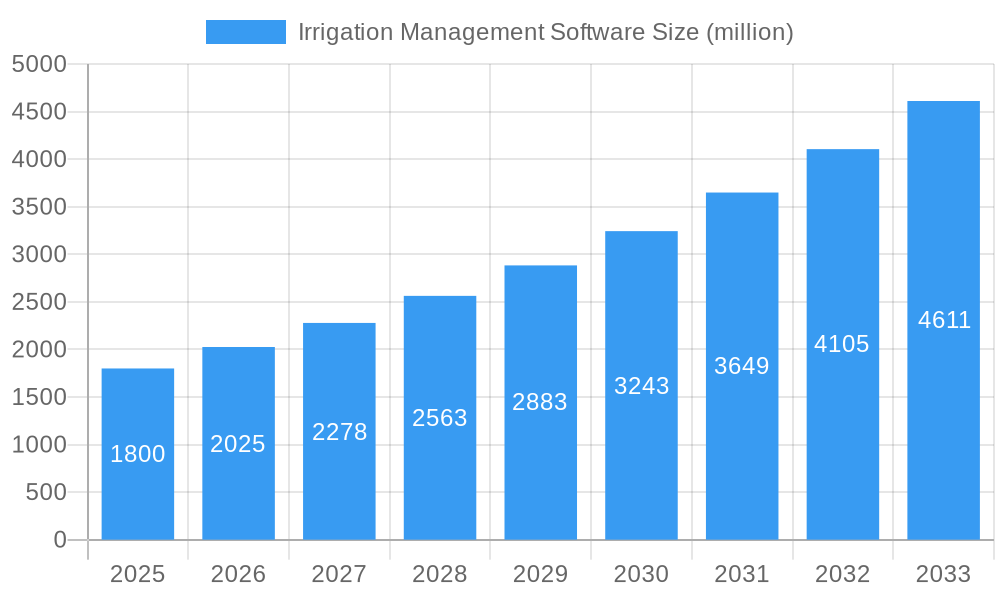
Irrigation Management Software Market Size (In Billion)
Key growth factors include increasing water scarcity driven by climate change and population growth, alongside supportive government initiatives for sustainable agriculture. The software's capacity to deliver substantial cost savings through reduced water and energy usage, coupled with improved crop quality and yield, positions it as a vital tool for modern farming. While initial investment and technical expertise may present challenges, the long-term economic and environmental advantages are substantial. The market features a dynamic competitive environment with established and emerging players driving innovation in smart irrigation.
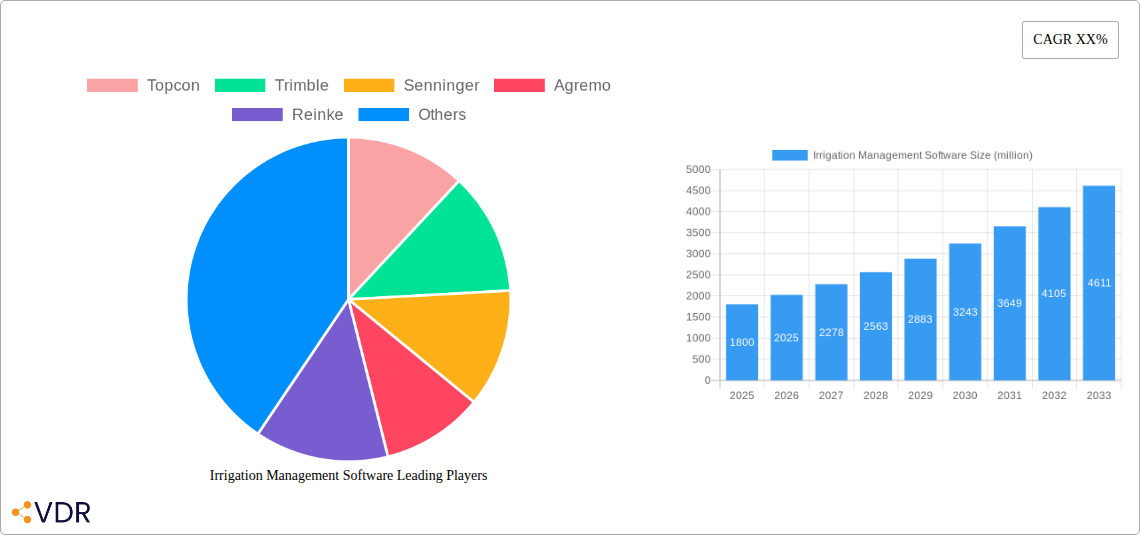
Irrigation Management Software Company Market Share
Irrigation Management Software Market Report: Smart Irrigation Solutions for Sustainable Agriculture
This comprehensive report delves into the global Irrigation Management Software market, forecasting robust growth driven by the increasing adoption of precision agriculture techniques and the critical need for water conservation. We analyze market dynamics, growth trends, regional dominance, product innovations, key drivers, challenges, emerging opportunities, and the competitive landscape from 2019 to 2033, with a base year of 2025. The report provides actionable insights for stakeholders seeking to capitalize on the smart irrigation revolution, essential for farm management and plantation operations worldwide.
Irrigation Management Software Market Dynamics & Structure
The global Irrigation Management Software market exhibits a dynamic structure characterized by increasing consolidation and technological innovation. Market concentration is moderate, with a mix of established players and agile startups vying for market share. Key innovation drivers include advancements in IoT, AI, and sensor technology, enabling real-time data collection and sophisticated decision-making for water application. Regulatory frameworks promoting water efficiency and sustainable farming practices are further accelerating adoption. Competitive product substitutes, such as traditional irrigation timers and manual management, are gradually being phased out in favor of advanced software solutions. End-user demographics are shifting towards tech-savvy farmers and large-scale agricultural enterprises embracing digital transformation. Mergers and acquisitions (M&A) trends indicate a strategic consolidation phase, with larger companies acquiring innovative smaller firms to expand their product portfolios and market reach. We anticipate xx M&A deals in the forecast period, contributing to a more streamlined market.
- Market Concentration: Moderate, with key players holding significant shares but ample room for emerging innovators.
- Technological Innovation Drivers: IoT sensors, AI-powered analytics, cloud computing, weather forecasting integration.
- Regulatory Frameworks: Government incentives for water-saving technologies, environmental protection mandates.
- Competitive Product Substitutes: Traditional timers, manual irrigation scheduling.
- End-User Demographics: Progressive farmers, agricultural co-operatives, large agribusinesses.
- M&A Trends: Strategic acquisitions to gain technological edge and market access.
Irrigation Management Software Growth Trends & Insights
The Irrigation Management Software market is poised for exceptional growth, projected to expand from an estimated $1,800 million in 2025 to $5,500 million by 2033, exhibiting a compound annual growth rate (CAGR) of approximately 15.0% during the forecast period. This significant expansion is fueled by an escalating global demand for food security, coupled with increasing awareness of water scarcity and the imperative for sustainable agricultural practices. Adoption rates for irrigation automation and precision irrigation software are rapidly accelerating across diverse agricultural landscapes. Technological disruptions, particularly the integration of Artificial Intelligence (AI) for predictive analytics and machine learning for optimizing water usage based on crop-specific needs, soil moisture, and micro-climatic conditions, are redefining operational efficiencies. Consumer behavior shifts are evident, with growers increasingly prioritizing data-driven decision-making to enhance crop yields, reduce operational costs, and minimize environmental impact. The market penetration of cloud-based irrigation solutions is projected to surge as farmers seek scalable, accessible, and data-rich platforms. Conversely, the on-premise irrigation software segment, while still relevant for specific large-scale operations with strict data sovereignty requirements, is expected to witness a slower, yet steady, growth trajectory.
The historical period (2019-2024) saw the initial emergence and refinement of irrigation control systems, driven by early adopters and pilot programs showcasing the benefits of digitized water management. The base year of 2025 marks a pivotal point where the technology has matured, and market awareness has reached a critical mass, setting the stage for widespread adoption. The forecast period (2025-2033) will witness this burgeoning demand translate into substantial market growth, with innovations in predictive irrigation, remote monitoring, and integrated farm management systems becoming standard. The increasing affordability of IoT sensors and the development of user-friendly interfaces are further democratizing access to advanced irrigation technologies, making them accessible to a broader range of agricultural operations, from smallholder farms to large commercial enterprises. The global focus on sustainable development goals, particularly SDG 6 (Clean Water and Sanitation) and SDG 2 (Zero Hunger), provides a strong policy tailwind, encouraging investments and research into efficient water management technologies, directly benefiting the irrigation management software sector.
Dominant Regions, Countries, or Segments in Irrigation Management Software
North America currently dominates the Irrigation Management Software market, driven by a highly industrialized agricultural sector, a strong emphasis on technological adoption, and significant government support for water conservation initiatives. The United States, in particular, represents a substantial market share due to its vast agricultural land, diverse crop production, and the presence of leading technology providers. The segment of Farm Management applications is the primary growth engine within North America, with farmers increasingly leveraging software solutions to optimize irrigation schedules, monitor soil health, and improve overall farm productivity.
- Key Drivers in North America:
- Technological Sophistication: High adoption rates of precision agriculture tools and smart farming technologies.
- Water Scarcity Concerns: Growing awareness and regulatory pressure to conserve water resources, especially in arid and semi-arid regions.
- Economic Incentives: Government subsidies and grant programs for adopting water-efficient technologies.
- Advanced Infrastructure: Robust internet connectivity and reliable power supply facilitating the deployment of cloud-based solutions.
- Leading Players Presence: Proximity to major irrigation technology developers and research institutions.
In terms of application, Farm Management holds the largest market share, encompassing a broad spectrum of agricultural operations that benefit from efficient water resource allocation. This segment includes large commercial farms, vineyards, orchards, and row crop producers who are actively seeking to maximize yields while minimizing input costs. The Plantation segment is also experiencing significant growth, particularly in regions with established plantations for crops like coffee, rubber, and palm oil, where precise irrigation is crucial for maintaining crop quality and consistent production.
Within the types of irrigation management software, Cloud-Based solutions are rapidly gaining prominence. Their scalability, accessibility, and ability to integrate with various data sources (weather stations, sensors, satellite imagery) make them highly attractive to a wide range of users. The ability to access data and control systems remotely provides unparalleled flexibility and efficiency. While On-Premise solutions still cater to specific needs requiring stringent data control, the trend is clearly shifting towards cloud-based platforms due to their cost-effectiveness, ease of deployment, and continuous updates. The growth potential for cloud-based solutions in emerging economies, where infrastructure development is a priority, is particularly noteworthy.
Irrigation Management Software Product Landscape
The Irrigation Management Software product landscape is characterized by innovative solutions that integrate cutting-edge technologies to provide highly efficient water management. Products range from sophisticated cloud-based platforms offering real-time data analytics and predictive irrigation scheduling to user-friendly mobile applications for remote control and monitoring. Key innovations include AI-powered algorithms for optimizing water application based on hyper-local weather data, soil moisture sensor integration, and crop-specific growth models. Performance metrics are consistently improving, with advanced systems demonstrating significant water savings of up to 30% and yield improvements of 10-20%. Unique selling propositions often revolve around predictive capabilities, automated system adjustments, and seamless integration with existing farm management ecosystems, enhancing operational efficiency and sustainability.
Key Drivers, Barriers & Challenges in Irrigation Management Software
Key Drivers:
- Water Scarcity and Climate Change: The increasing global concern over water availability and the impact of climate change on agricultural productivity is a primary driver for adopting efficient irrigation solutions.
- Technological Advancements: The continuous evolution of IoT, AI, and sensor technology enables more precise and automated irrigation management.
- Government Initiatives and Regulations: Policies promoting water conservation, sustainable farming, and smart agriculture encourage investment in irrigation management software.
- Demand for Increased Crop Yields: The need to feed a growing global population necessitates maximizing agricultural output, where optimized irrigation plays a crucial role.
Barriers & Challenges:
- High Initial Investment Costs: The upfront cost of hardware (sensors, controllers) and software implementation can be a significant barrier for small and medium-sized farms.
- Lack of Technical Expertise: A shortage of skilled personnel to operate and maintain advanced irrigation management systems can hinder adoption.
- Connectivity Issues: In remote or underdeveloped agricultural regions, unreliable internet connectivity can limit the effectiveness of cloud-based solutions.
- Data Security and Privacy Concerns: Farmers may have reservations about storing sensitive farm data on cloud platforms, necessitating robust security measures.
- Interoperability and Integration: Ensuring seamless integration with existing farm equipment and software platforms can be complex.
Emerging Opportunities in Irrigation Management Software
Emerging opportunities in the Irrigation Management Software market lie in the development of hyper-personalized irrigation solutions tailored to specific micro-climates and crop varieties. The integration of advanced drone and satellite imagery for real-time field analysis, coupled with AI-driven predictive models, presents a significant avenue for growth. Furthermore, the expansion of these solutions into emerging markets with developing agricultural sectors, where water management is becoming increasingly critical, offers untapped potential. The demand for subscription-based service models, providing ongoing support and updates, is also a burgeoning opportunity, making advanced technology more accessible.
Growth Accelerators in the Irrigation Management Software Industry
Growth accelerators for the Irrigation Management Software industry are rooted in continuous technological innovation, strategic partnerships, and market expansion. The development of more affordable and accessible IoT sensor networks, coupled with the increasing processing power of AI algorithms, will further democratize smart irrigation. Strategic collaborations between software providers, hardware manufacturers, and agricultural research institutions will foster the development of integrated solutions. Market expansion into developing economies, where the need for efficient water management is paramount, represents a significant growth catalyst. The increasing focus on data analytics and actionable insights derived from irrigation data will also drive adoption and customer loyalty.
Key Players Shaping the Irrigation Management Software Market
- Topcon
- Trimble
- Senninger
- Agremo
- Reinke
- AquaCheck
- Prominent
- Lindsay
- Rachio
- Hydrawise
- Rubbicon
- GreenIQ
- Spruce
- Nelson
- Agrivi
Notable Milestones in Irrigation Management Software Sector
- 2019: Increased adoption of AI in predictive analytics for irrigation scheduling.
- 2020: Launch of integrated IoT sensor networks for real-time water monitoring.
- 2021: Growing investment in cloud-based irrigation management platforms.
- 2022: Expansion of smart irrigation solutions into diverse crop types and regions.
- 2023: Focus on water-use efficiency and sustainability reporting features.
- 2024: Advancements in drone and satellite imagery integration for detailed field analysis.
In-Depth Irrigation Management Software Market Outlook
The Irrigation Management Software market outlook is exceptionally promising, with continued growth fueled by technological advancements and the indispensable need for sustainable water management in agriculture. Strategic opportunities lie in enhancing predictive capabilities, expanding into underserved markets, and developing integrated farm management ecosystems. The increasing adoption of AI and machine learning will further refine water application efficiency, driving higher yields and reduced operational costs. Investments in robust data analytics and user-friendly interfaces will solidify market penetration, making smart irrigation an indispensable tool for modern agriculture. The focus on a circular economy and resource optimization will continue to be a strong impetus for market expansion.
Irrigation Management Software Segmentation
-
1. Application
- 1.1. Plantation
- 1.2. Farm Management
-
2. Types
- 2.1. Could Based
- 2.2. On-permise
Irrigation Management Software Segmentation By Geography
-
1. North America
- 1.1. United States
- 1.2. Canada
- 1.3. Mexico
-
2. South America
- 2.1. Brazil
- 2.2. Argentina
- 2.3. Rest of South America
-
3. Europe
- 3.1. United Kingdom
- 3.2. Germany
- 3.3. France
- 3.4. Italy
- 3.5. Spain
- 3.6. Russia
- 3.7. Benelux
- 3.8. Nordics
- 3.9. Rest of Europe
-
4. Middle East & Africa
- 4.1. Turkey
- 4.2. Israel
- 4.3. GCC
- 4.4. North Africa
- 4.5. South Africa
- 4.6. Rest of Middle East & Africa
-
5. Asia Pacific
- 5.1. China
- 5.2. India
- 5.3. Japan
- 5.4. South Korea
- 5.5. ASEAN
- 5.6. Oceania
- 5.7. Rest of Asia Pacific
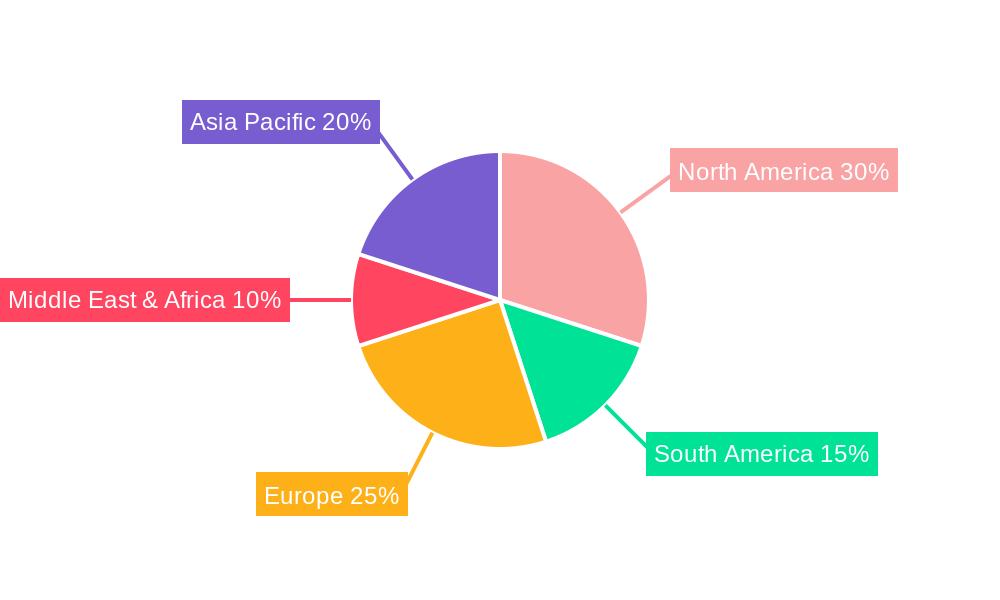
Irrigation Management Software Regional Market Share
Geographic Coverage of Irrigation Management Software
Irrigation Management Software REPORT HIGHLIGHTS
| Aspects | Details |
|---|---|
| Study Period | 2020-2034 |
| Base Year | 2025 |
| Estimated Year | 2026 |
| Forecast Period | 2026-2034 |
| Historical Period | 2020-2025 |
| Growth Rate | CAGR of 11.5% from 2020-2034 |
| Segmentation |
|
Table of Contents
- 1. Introduction
- 1.1. Research Scope
- 1.2. Market Segmentation
- 1.3. Research Objective
- 1.4. Definitions and Assumptions
- 2. Executive Summary
- 2.1. Market Snapshot
- 3. Market Dynamics
- 3.1. Market Drivers
- 3.2. Market Restrains
- 3.3. Market Trends
- 3.4. Market Opportunities
- 4. Market Factor Analysis
- 4.1. Porters Five Forces
- 4.1.1. Bargaining Power of Suppliers
- 4.1.2. Bargaining Power of Buyers
- 4.1.3. Threat of New Entrants
- 4.1.4. Threat of Substitutes
- 4.1.5. Competitive Rivalry
- 4.2. PESTEL analysis
- 4.3. BCG Analysis
- 4.3.1. Stars (High Growth, High Market Share)
- 4.3.2. Cash Cows (Low Growth, High Market Share)
- 4.3.3. Question Mark (High Growth, Low Market Share)
- 4.3.4. Dogs (Low Growth, Low Market Share)
- 4.4. Ansoff Matrix Analysis
- 4.5. Supply Chain Analysis
- 4.6. Regulatory Landscape
- 4.7. Current Market Potential and Opportunity Assessment (TAM–SAM–SOM Framework)
- 4.8. VDR Analyst Note
- 4.1. Porters Five Forces
- 5. Market Analysis, Insights and Forecast 2021-2033
- 5.1. Market Analysis, Insights and Forecast - by Application
- 5.1.1. Plantation
- 5.1.2. Farm Management
- 5.2. Market Analysis, Insights and Forecast - by Types
- 5.2.1. Could Based
- 5.2.2. On-permise
- 5.3. Market Analysis, Insights and Forecast - by Region
- 5.3.1. North America
- 5.3.2. South America
- 5.3.3. Europe
- 5.3.4. Middle East & Africa
- 5.3.5. Asia Pacific
- 5.1. Market Analysis, Insights and Forecast - by Application
- 6. Global Irrigation Management Software Analysis, Insights and Forecast, 2021-2033
- 6.1. Market Analysis, Insights and Forecast - by Application
- 6.1.1. Plantation
- 6.1.2. Farm Management
- 6.2. Market Analysis, Insights and Forecast - by Types
- 6.2.1. Could Based
- 6.2.2. On-permise
- 6.1. Market Analysis, Insights and Forecast - by Application
- 7. North America Irrigation Management Software Analysis, Insights and Forecast, 2021-2033
- 7.1. Market Analysis, Insights and Forecast - by Application
- 7.1.1. Plantation
- 7.1.2. Farm Management
- 7.2. Market Analysis, Insights and Forecast - by Types
- 7.2.1. Could Based
- 7.2.2. On-permise
- 7.1. Market Analysis, Insights and Forecast - by Application
- 8. South America Irrigation Management Software Analysis, Insights and Forecast, 2021-2033
- 8.1. Market Analysis, Insights and Forecast - by Application
- 8.1.1. Plantation
- 8.1.2. Farm Management
- 8.2. Market Analysis, Insights and Forecast - by Types
- 8.2.1. Could Based
- 8.2.2. On-permise
- 8.1. Market Analysis, Insights and Forecast - by Application
- 9. Europe Irrigation Management Software Analysis, Insights and Forecast, 2021-2033
- 9.1. Market Analysis, Insights and Forecast - by Application
- 9.1.1. Plantation
- 9.1.2. Farm Management
- 9.2. Market Analysis, Insights and Forecast - by Types
- 9.2.1. Could Based
- 9.2.2. On-permise
- 9.1. Market Analysis, Insights and Forecast - by Application
- 10. Middle East & Africa Irrigation Management Software Analysis, Insights and Forecast, 2021-2033
- 10.1. Market Analysis, Insights and Forecast - by Application
- 10.1.1. Plantation
- 10.1.2. Farm Management
- 10.2. Market Analysis, Insights and Forecast - by Types
- 10.2.1. Could Based
- 10.2.2. On-permise
- 10.1. Market Analysis, Insights and Forecast - by Application
- 11. Asia Pacific Irrigation Management Software Analysis, Insights and Forecast, 2021-2033
- 11.1. Market Analysis, Insights and Forecast - by Application
- 11.1.1. Plantation
- 11.1.2. Farm Management
- 11.2. Market Analysis, Insights and Forecast - by Types
- 11.2.1. Could Based
- 11.2.2. On-permise
- 11.1. Market Analysis, Insights and Forecast - by Application
- 12. Competitive Analysis
- 12.1. Company Profiles
- 12.1.1 Topcon
- 12.1.1.1. Company Overview
- 12.1.1.2. Products
- 12.1.1.3. Company Financials
- 12.1.1.4. SWOT Analysis
- 12.1.2 Trimble
- 12.1.2.1. Company Overview
- 12.1.2.2. Products
- 12.1.2.3. Company Financials
- 12.1.2.4. SWOT Analysis
- 12.1.3 Senninger
- 12.1.3.1. Company Overview
- 12.1.3.2. Products
- 12.1.3.3. Company Financials
- 12.1.3.4. SWOT Analysis
- 12.1.4 Agremo
- 12.1.4.1. Company Overview
- 12.1.4.2. Products
- 12.1.4.3. Company Financials
- 12.1.4.4. SWOT Analysis
- 12.1.5 Reinke
- 12.1.5.1. Company Overview
- 12.1.5.2. Products
- 12.1.5.3. Company Financials
- 12.1.5.4. SWOT Analysis
- 12.1.6 AquaCheck
- 12.1.6.1. Company Overview
- 12.1.6.2. Products
- 12.1.6.3. Company Financials
- 12.1.6.4. SWOT Analysis
- 12.1.7 Prominent
- 12.1.7.1. Company Overview
- 12.1.7.2. Products
- 12.1.7.3. Company Financials
- 12.1.7.4. SWOT Analysis
- 12.1.8 Lindsay
- 12.1.8.1. Company Overview
- 12.1.8.2. Products
- 12.1.8.3. Company Financials
- 12.1.8.4. SWOT Analysis
- 12.1.9 Rachio
- 12.1.9.1. Company Overview
- 12.1.9.2. Products
- 12.1.9.3. Company Financials
- 12.1.9.4. SWOT Analysis
- 12.1.10 Hydrawise
- 12.1.10.1. Company Overview
- 12.1.10.2. Products
- 12.1.10.3. Company Financials
- 12.1.10.4. SWOT Analysis
- 12.1.11 Rubbicon
- 12.1.11.1. Company Overview
- 12.1.11.2. Products
- 12.1.11.3. Company Financials
- 12.1.11.4. SWOT Analysis
- 12.1.12 GreenIQ
- 12.1.12.1. Company Overview
- 12.1.12.2. Products
- 12.1.12.3. Company Financials
- 12.1.12.4. SWOT Analysis
- 12.1.13 Spruce
- 12.1.13.1. Company Overview
- 12.1.13.2. Products
- 12.1.13.3. Company Financials
- 12.1.13.4. SWOT Analysis
- 12.1.14 Nelson
- 12.1.14.1. Company Overview
- 12.1.14.2. Products
- 12.1.14.3. Company Financials
- 12.1.14.4. SWOT Analysis
- 12.1.15 Agrivi
- 12.1.15.1. Company Overview
- 12.1.15.2. Products
- 12.1.15.3. Company Financials
- 12.1.15.4. SWOT Analysis
- 12.1.1 Topcon
- 12.2. Market Entropy
- 12.2.1 Company's Key Areas Served
- 12.2.2 Recent Developments
- 12.3. Company Market Share Analysis 2025
- 12.3.1 Top 5 Companies Market Share Analysis
- 12.3.2 Top 3 Companies Market Share Analysis
- 12.4. List of Potential Customers
- 13. Research Methodology
List of Figures
- Figure 1: Global Irrigation Management Software Revenue Breakdown (billion, %) by Region 2025 & 2033
- Figure 2: North America Irrigation Management Software Revenue (billion), by Application 2025 & 2033
- Figure 3: North America Irrigation Management Software Revenue Share (%), by Application 2025 & 2033
- Figure 4: North America Irrigation Management Software Revenue (billion), by Types 2025 & 2033
- Figure 5: North America Irrigation Management Software Revenue Share (%), by Types 2025 & 2033
- Figure 6: North America Irrigation Management Software Revenue (billion), by Country 2025 & 2033
- Figure 7: North America Irrigation Management Software Revenue Share (%), by Country 2025 & 2033
- Figure 8: South America Irrigation Management Software Revenue (billion), by Application 2025 & 2033
- Figure 9: South America Irrigation Management Software Revenue Share (%), by Application 2025 & 2033
- Figure 10: South America Irrigation Management Software Revenue (billion), by Types 2025 & 2033
- Figure 11: South America Irrigation Management Software Revenue Share (%), by Types 2025 & 2033
- Figure 12: South America Irrigation Management Software Revenue (billion), by Country 2025 & 2033
- Figure 13: South America Irrigation Management Software Revenue Share (%), by Country 2025 & 2033
- Figure 14: Europe Irrigation Management Software Revenue (billion), by Application 2025 & 2033
- Figure 15: Europe Irrigation Management Software Revenue Share (%), by Application 2025 & 2033
- Figure 16: Europe Irrigation Management Software Revenue (billion), by Types 2025 & 2033
- Figure 17: Europe Irrigation Management Software Revenue Share (%), by Types 2025 & 2033
- Figure 18: Europe Irrigation Management Software Revenue (billion), by Country 2025 & 2033
- Figure 19: Europe Irrigation Management Software Revenue Share (%), by Country 2025 & 2033
- Figure 20: Middle East & Africa Irrigation Management Software Revenue (billion), by Application 2025 & 2033
- Figure 21: Middle East & Africa Irrigation Management Software Revenue Share (%), by Application 2025 & 2033
- Figure 22: Middle East & Africa Irrigation Management Software Revenue (billion), by Types 2025 & 2033
- Figure 23: Middle East & Africa Irrigation Management Software Revenue Share (%), by Types 2025 & 2033
- Figure 24: Middle East & Africa Irrigation Management Software Revenue (billion), by Country 2025 & 2033
- Figure 25: Middle East & Africa Irrigation Management Software Revenue Share (%), by Country 2025 & 2033
- Figure 26: Asia Pacific Irrigation Management Software Revenue (billion), by Application 2025 & 2033
- Figure 27: Asia Pacific Irrigation Management Software Revenue Share (%), by Application 2025 & 2033
- Figure 28: Asia Pacific Irrigation Management Software Revenue (billion), by Types 2025 & 2033
- Figure 29: Asia Pacific Irrigation Management Software Revenue Share (%), by Types 2025 & 2033
- Figure 30: Asia Pacific Irrigation Management Software Revenue (billion), by Country 2025 & 2033
- Figure 31: Asia Pacific Irrigation Management Software Revenue Share (%), by Country 2025 & 2033
List of Tables
- Table 1: Global Irrigation Management Software Revenue billion Forecast, by Application 2020 & 2033
- Table 2: Global Irrigation Management Software Revenue billion Forecast, by Types 2020 & 2033
- Table 3: Global Irrigation Management Software Revenue billion Forecast, by Region 2020 & 2033
- Table 4: Global Irrigation Management Software Revenue billion Forecast, by Application 2020 & 2033
- Table 5: Global Irrigation Management Software Revenue billion Forecast, by Types 2020 & 2033
- Table 6: Global Irrigation Management Software Revenue billion Forecast, by Country 2020 & 2033
- Table 7: United States Irrigation Management Software Revenue (billion) Forecast, by Application 2020 & 2033
- Table 8: Canada Irrigation Management Software Revenue (billion) Forecast, by Application 2020 & 2033
- Table 9: Mexico Irrigation Management Software Revenue (billion) Forecast, by Application 2020 & 2033
- Table 10: Global Irrigation Management Software Revenue billion Forecast, by Application 2020 & 2033
- Table 11: Global Irrigation Management Software Revenue billion Forecast, by Types 2020 & 2033
- Table 12: Global Irrigation Management Software Revenue billion Forecast, by Country 2020 & 2033
- Table 13: Brazil Irrigation Management Software Revenue (billion) Forecast, by Application 2020 & 2033
- Table 14: Argentina Irrigation Management Software Revenue (billion) Forecast, by Application 2020 & 2033
- Table 15: Rest of South America Irrigation Management Software Revenue (billion) Forecast, by Application 2020 & 2033
- Table 16: Global Irrigation Management Software Revenue billion Forecast, by Application 2020 & 2033
- Table 17: Global Irrigation Management Software Revenue billion Forecast, by Types 2020 & 2033
- Table 18: Global Irrigation Management Software Revenue billion Forecast, by Country 2020 & 2033
- Table 19: United Kingdom Irrigation Management Software Revenue (billion) Forecast, by Application 2020 & 2033
- Table 20: Germany Irrigation Management Software Revenue (billion) Forecast, by Application 2020 & 2033
- Table 21: France Irrigation Management Software Revenue (billion) Forecast, by Application 2020 & 2033
- Table 22: Italy Irrigation Management Software Revenue (billion) Forecast, by Application 2020 & 2033
- Table 23: Spain Irrigation Management Software Revenue (billion) Forecast, by Application 2020 & 2033
- Table 24: Russia Irrigation Management Software Revenue (billion) Forecast, by Application 2020 & 2033
- Table 25: Benelux Irrigation Management Software Revenue (billion) Forecast, by Application 2020 & 2033
- Table 26: Nordics Irrigation Management Software Revenue (billion) Forecast, by Application 2020 & 2033
- Table 27: Rest of Europe Irrigation Management Software Revenue (billion) Forecast, by Application 2020 & 2033
- Table 28: Global Irrigation Management Software Revenue billion Forecast, by Application 2020 & 2033
- Table 29: Global Irrigation Management Software Revenue billion Forecast, by Types 2020 & 2033
- Table 30: Global Irrigation Management Software Revenue billion Forecast, by Country 2020 & 2033
- Table 31: Turkey Irrigation Management Software Revenue (billion) Forecast, by Application 2020 & 2033
- Table 32: Israel Irrigation Management Software Revenue (billion) Forecast, by Application 2020 & 2033
- Table 33: GCC Irrigation Management Software Revenue (billion) Forecast, by Application 2020 & 2033
- Table 34: North Africa Irrigation Management Software Revenue (billion) Forecast, by Application 2020 & 2033
- Table 35: South Africa Irrigation Management Software Revenue (billion) Forecast, by Application 2020 & 2033
- Table 36: Rest of Middle East & Africa Irrigation Management Software Revenue (billion) Forecast, by Application 2020 & 2033
- Table 37: Global Irrigation Management Software Revenue billion Forecast, by Application 2020 & 2033
- Table 38: Global Irrigation Management Software Revenue billion Forecast, by Types 2020 & 2033
- Table 39: Global Irrigation Management Software Revenue billion Forecast, by Country 2020 & 2033
- Table 40: China Irrigation Management Software Revenue (billion) Forecast, by Application 2020 & 2033
- Table 41: India Irrigation Management Software Revenue (billion) Forecast, by Application 2020 & 2033
- Table 42: Japan Irrigation Management Software Revenue (billion) Forecast, by Application 2020 & 2033
- Table 43: South Korea Irrigation Management Software Revenue (billion) Forecast, by Application 2020 & 2033
- Table 44: ASEAN Irrigation Management Software Revenue (billion) Forecast, by Application 2020 & 2033
- Table 45: Oceania Irrigation Management Software Revenue (billion) Forecast, by Application 2020 & 2033
- Table 46: Rest of Asia Pacific Irrigation Management Software Revenue (billion) Forecast, by Application 2020 & 2033
Frequently Asked Questions
1. What is the projected Compound Annual Growth Rate (CAGR) of the Irrigation Management Software?
The projected CAGR is approximately 11.5%.
2. Which companies are prominent players in the Irrigation Management Software?
Key companies in the market include Topcon, Trimble, Senninger, Agremo, Reinke, AquaCheck, Prominent, Lindsay, Rachio, Hydrawise, Rubbicon, GreenIQ, Spruce, Nelson, Agrivi.
3. What are the main segments of the Irrigation Management Software?
The market segments include Application, Types.
4. Can you provide details about the market size?
The market size is estimated to be USD 7.2 billion as of 2022.
5. What are some drivers contributing to market growth?
N/A
6. What are the notable trends driving market growth?
N/A
7. Are there any restraints impacting market growth?
N/A
8. Can you provide examples of recent developments in the market?
N/A
9. What pricing options are available for accessing the report?
Pricing options include single-user, multi-user, and enterprise licenses priced at USD 2900.00, USD 4350.00, and USD 5800.00 respectively.
10. Is the market size provided in terms of value or volume?
The market size is provided in terms of value, measured in billion.
11. Are there any specific market keywords associated with the report?
Yes, the market keyword associated with the report is "Irrigation Management Software," which aids in identifying and referencing the specific market segment covered.
12. How do I determine which pricing option suits my needs best?
The pricing options vary based on user requirements and access needs. Individual users may opt for single-user licenses, while businesses requiring broader access may choose multi-user or enterprise licenses for cost-effective access to the report.
13. Are there any additional resources or data provided in the Irrigation Management Software report?
While the report offers comprehensive insights, it's advisable to review the specific contents or supplementary materials provided to ascertain if additional resources or data are available.
14. How can I stay updated on further developments or reports in the Irrigation Management Software?
To stay informed about further developments, trends, and reports in the Irrigation Management Software, consider subscribing to industry newsletters, following relevant companies and organizations, or regularly checking reputable industry news sources and publications.
Methodology
Step 1 - Identification of Relevant Samples Size from Population Database


Step 2 - Approaches for Defining Global Market Size (Value, Volume* & Price*)

Note*: In applicable scenarios
Step 3 - Data Sources
Primary Research
- Web Analytics
- Survey Reports
- Research Institute
- Latest Research Reports
- Opinion Leaders
Secondary Research
- Annual Reports
- White Paper
- Latest Press Release
- Industry Association
- Paid Database
- Investor Presentations

Step 4 - Data Triangulation
Involves using different sources of information in order to increase the validity of a study
These sources are likely to be stakeholders in a program - participants, other researchers, program staff, other community members, and so on.
Then we put all data in single framework & apply various statistical tools to find out the dynamic on the market.
During the analysis stage, feedback from the stakeholder groups would be compared to determine areas of agreement as well as areas of divergence