


Key Insights
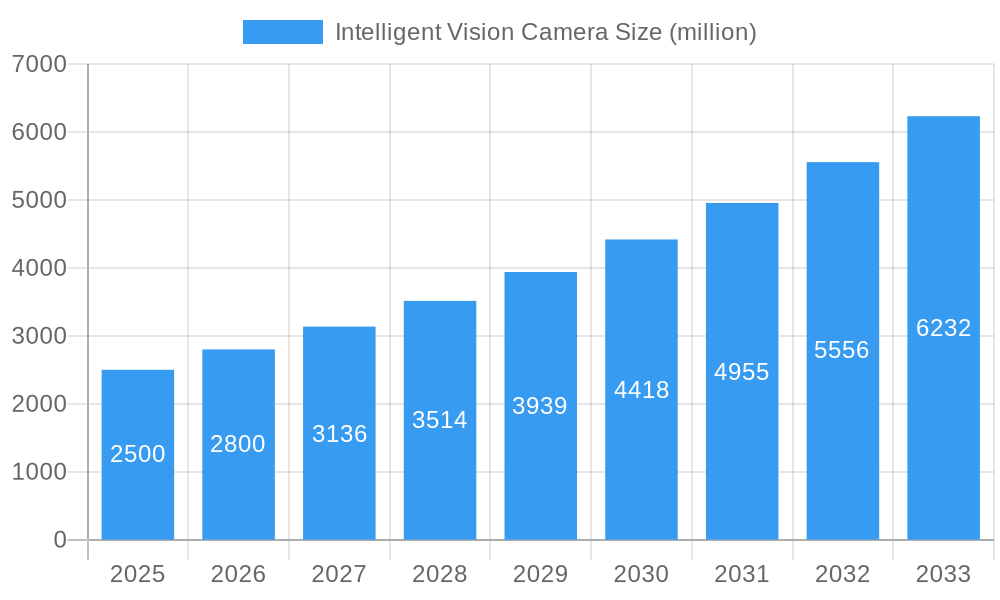
The intelligent vision camera market is poised for significant expansion, driven by escalating automation demands across manufacturing, logistics, and automotive sectors. Key growth drivers include the imperative for enhanced process efficiency, superior quality control, the burgeoning adoption of smart factories and Industry 4.0, and the declining costs coupled with advancements in intelligent vision camera technology. Innovations in machine learning and artificial intelligence (AI) are pivotal, empowering cameras with sophisticated capabilities for object recognition, defect detection, and real-time data analysis, thereby delivering substantial cost savings and productivity improvements. The intelligent vision camera market is projected to reach $15.83 billion by 2025, with a compound annual growth rate (CAGR) of 8.3% from a base year of 2025 through 2033. Growth will be distributed across segments such as resolution, technology (2D, 3D), and application. Leading companies including Advantech and ADLINK Technology are actively investing in R&D to maintain competitive advantages.
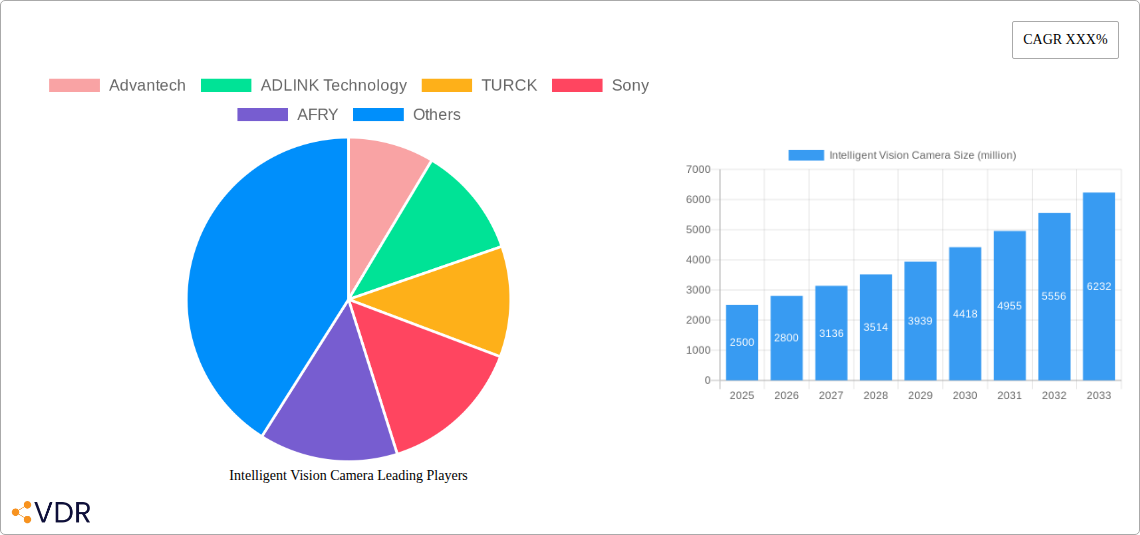
Intelligent Vision Camera Market Size (In Billion)

The market's competitive environment features a blend of established industry leaders and innovative new entrants. Incumbents are capitalizing on their established market presence and technical expertise, while emerging players are focusing on groundbreaking solutions and specialized applications. Initial investment and the requirement for specialized expertise for implementation and maintenance present ongoing challenges. Nevertheless, the market's long-term trajectory is highly favorable, underpinned by continuous technological progress and the increasing demand for automation. Significant regional growth disparities are anticipated, with North America and Asia-Pacific expected to lead due to substantial investments in automation and technological infrastructure.
Intelligent Vision Camera Company Market Share
Intelligent Vision Camera Market Report: 2019-2033
This comprehensive report provides a detailed analysis of the Intelligent Vision Camera market, encompassing market dynamics, growth trends, regional dominance, product landscape, key players, and future outlook. The study period covers 2019-2033, with 2025 as the base year and forecast period spanning 2025-2033. The report leverages extensive data analysis to provide actionable insights for industry professionals, investors, and strategic decision-makers within the parent market of machine vision and the child market of industrial automation.
Intelligent Vision Camera Market Dynamics & Structure
The Intelligent Vision Camera market is experiencing significant growth, driven by technological advancements, increasing automation across diverse industries, and the growing need for enhanced process efficiency and quality control. Market concentration is moderate, with several key players holding substantial market share, while smaller, specialized companies cater to niche segments. The market is characterized by continuous technological innovation, particularly in areas like deep learning, AI-powered image processing, and high-resolution sensor technology. Regulatory frameworks related to data privacy and safety standards influence market dynamics. Competitive substitutes include traditional vision systems and manual inspection methods; however, the superior accuracy, speed, and data analysis capabilities of intelligent vision cameras are driving market adoption. End-user demographics are expanding beyond traditional manufacturing to encompass logistics, healthcare, and agriculture. M&A activity is relatively high, with larger companies acquiring smaller players to expand their product portfolios and technological capabilities.
- Market Concentration: Moderately concentrated, with top 5 players holding approximately xx% market share (2025).
- Technological Innovation: Deep learning, AI-powered image processing, 3D vision, and high-resolution sensors are key drivers.
- Regulatory Frameworks: Compliance with data privacy regulations (e.g., GDPR) and safety standards (e.g., ISO 13485) is crucial.
- M&A Activity: xx major M&A deals recorded between 2019 and 2024, indicating increasing consolidation.
- Innovation Barriers: High initial investment costs, complexity of integration, and lack of skilled workforce.
Intelligent Vision Camera Growth Trends & Insights
The Intelligent Vision Camera market is exhibiting robust growth, with a projected CAGR of xx% during the forecast period (2025-2033). Market size is estimated at $xx billion in 2025, expected to reach $xx billion by 2033. Adoption rates are accelerating across various industries, driven by factors such as increasing automation needs, improved product quality requirements, and the decreasing cost of intelligent vision cameras. Technological disruptions, particularly the integration of AI and machine learning algorithms, are enhancing the capabilities of these cameras, enabling more complex tasks and higher accuracy. Consumer behavior shifts towards smart and automated systems are further fueling market demand. Market penetration is increasing significantly in emerging economies, driven by industrialization and infrastructure development.
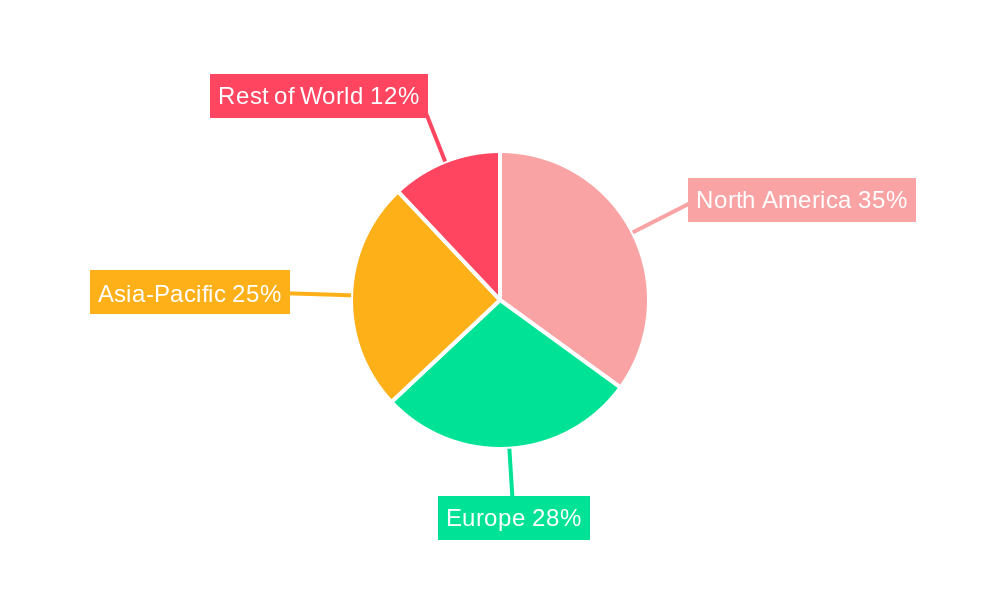
Dominant Regions, Countries, or Segments in Intelligent Vision Camera
North America currently holds the largest market share in the intelligent vision camera market, followed by Europe and Asia-Pacific. The dominance of North America is attributed to the high concentration of advanced manufacturing industries, strong technological infrastructure, and early adoption of automation technologies. Within North America, the United States accounts for the largest share, driven by significant investments in automation across various sectors. Europe is another key market, fueled by the growing adoption of Industry 4.0 initiatives and the presence of technologically advanced manufacturing hubs in Germany, France, and the UK. The Asia-Pacific region is witnessing rapid growth, driven by rapid industrialization in countries like China, Japan, and South Korea.
- Key Drivers in North America: High automation adoption rates, strong technological infrastructure, and government support for advanced manufacturing.
- Key Drivers in Europe: Industry 4.0 initiatives, strong presence of automation technology providers, and robust manufacturing sector.
- Key Drivers in Asia-Pacific: Rapid industrialization, increasing investment in automation, and a large pool of manufacturing industries.
Intelligent Vision Camera Product Landscape
The intelligent vision camera market offers a diverse range of products with varying resolutions, functionalities, and price points. Innovations focus on improving image processing speed, enhancing AI capabilities, integrating advanced sensor technologies, and developing compact, versatile designs. Applications span across diverse industries including manufacturing, logistics, automotive, healthcare, and agriculture. Key performance metrics include resolution, frame rate, processing speed, and accuracy of object detection and classification. Unique selling propositions often include specific AI algorithms tailored to particular applications, robust design for harsh industrial environments, and easy integration with existing automation systems.
Key Drivers, Barriers & Challenges in Intelligent Vision Camera
Key Drivers:
- Increasing automation in manufacturing and other industries.
- Growing demand for enhanced quality control and process efficiency.
- Advancements in AI and machine learning technologies.
- Decreasing costs of intelligent vision cameras.
Challenges:
- High initial investment costs.
- Complexity of integration with existing systems.
- Lack of skilled workforce to operate and maintain these systems.
- Data security and privacy concerns. The impact of these challenges is estimated to reduce market growth by approximately xx% in the next 5 years.
Emerging Opportunities in Intelligent Vision Camera
- Expansion into new markets: Untapped opportunities exist in sectors like agriculture, healthcare, and smart cities.
- Development of innovative applications: Intelligent vision cameras are finding applications in robotics, autonomous vehicles, and augmented reality.
- Integration with other technologies: Combining intelligent vision cameras with IoT devices, cloud computing, and big data analytics.
Growth Accelerators in the Intelligent Vision Camera Industry
Technological advancements in AI, deep learning, and sensor technologies are key growth accelerators. Strategic partnerships between camera manufacturers, software developers, and system integrators are driving innovation and market penetration. Market expansion strategies focused on emerging economies and new application areas will further accelerate growth.
Key Players Shaping the Intelligent Vision Camera Market
- Advantech
- ADLINK Technology
- TURCK
- Sony
- AFRY
- ABB
- NI
- Teledyne Technologies
- Keyence
- Datalogic
- Baumer Holding AG
- NET GmbH
- OPT Machine Vision
- Matrix Vision GmbH
- Matrox Imaging
- Tattile Srl
- Banner Engineering
- Industrial Vision Systems
- Rotalec
Notable Milestones in Intelligent Vision Camera Sector
- 2020: Introduction of AI-powered intelligent vision cameras with enhanced object recognition capabilities.
- 2021: Several key players announced strategic partnerships to develop integrated vision systems for specific industrial applications.
- 2022: Launch of high-resolution 3D intelligent vision cameras for advanced automation applications.
- 2023: Significant increase in M&A activity within the intelligent vision camera market.
In-Depth Intelligent Vision Camera Market Outlook
The intelligent vision camera market is poised for sustained growth, driven by ongoing technological advancements, increasing adoption across various sectors, and expansion into new application areas. Strategic partnerships, investments in R&D, and the development of innovative products will further propel market expansion. The market offers significant opportunities for both established players and new entrants, creating a dynamic and competitive landscape in the coming years.
Intelligent Vision Camera Segmentation
-
1. Application
- 1.1. Manufacturing
- 1.2. Security and Surveillance
- 1.3. Medical and Life Sciences
- 1.4. Intelligent Transportation System (ITS)
- 1.5. Other
-
2. Type
- 2.1. Video Surveillance and Alarm Systems
- 2.2. Industrial Robot
- 2.3. Security Camera
- 2.4. Others
Intelligent Vision Camera Segmentation By Geography
-
1. North America
- 1.1. United States
- 1.2. Canada
- 1.3. Mexico
-
2. South America
- 2.1. Brazil
- 2.2. Argentina
- 2.3. Rest of South America
-
3. Europe
- 3.1. United Kingdom
- 3.2. Germany
- 3.3. France
- 3.4. Italy
- 3.5. Spain
- 3.6. Russia
- 3.7. Benelux
- 3.8. Nordics
- 3.9. Rest of Europe
-
4. Middle East & Africa
- 4.1. Turkey
- 4.2. Israel
- 4.3. GCC
- 4.4. North Africa
- 4.5. South Africa
- 4.6. Rest of Middle East & Africa
-
5. Asia Pacific
- 5.1. China
- 5.2. India
- 5.3. Japan
- 5.4. South Korea
- 5.5. ASEAN
- 5.6. Oceania
- 5.7. Rest of Asia Pacific
Intelligent Vision Camera Regional Market Share
Geographic Coverage of Intelligent Vision Camera
Intelligent Vision Camera REPORT HIGHLIGHTS
| Aspects | Details |
|---|---|
| Study Period | 2020-2034 |
| Base Year | 2025 |
| Estimated Year | 2026 |
| Forecast Period | 2026-2034 |
| Historical Period | 2020-2025 |
| Growth Rate | CAGR of 8.3% from 2020-2034 |
| Segmentation |
|
Table of Contents
- 1. Introduction
- 1.1. Research Scope
- 1.2. Market Segmentation
- 1.3. Research Methodology
- 1.4. Definitions and Assumptions
- 2. Executive Summary
- 2.1. Introduction
- 3. Market Dynamics
- 3.1. Introduction
- 3.2. Market Drivers
- 3.3. Market Restrains
- 3.4. Market Trends
- 4. Market Factor Analysis
- 4.1. Porters Five Forces
- 4.2. Supply/Value Chain
- 4.3. PESTEL analysis
- 4.4. Market Entropy
- 4.5. Patent/Trademark Analysis
- 5. Global Intelligent Vision Camera Analysis, Insights and Forecast, 2020-2032
- 5.1. Market Analysis, Insights and Forecast - by Application
- 5.1.1. Manufacturing
- 5.1.2. Security and Surveillance
- 5.1.3. Medical and Life Sciences
- 5.1.4. Intelligent Transportation System (ITS)
- 5.1.5. Other
- 5.2. Market Analysis, Insights and Forecast - by Type
- 5.2.1. Video Surveillance and Alarm Systems
- 5.2.2. Industrial Robot
- 5.2.3. Security Camera
- 5.2.4. Others
- 5.3. Market Analysis, Insights and Forecast - by Region
- 5.3.1. North America
- 5.3.2. South America
- 5.3.3. Europe
- 5.3.4. Middle East & Africa
- 5.3.5. Asia Pacific
- 5.1. Market Analysis, Insights and Forecast - by Application
- 6. North America Intelligent Vision Camera Analysis, Insights and Forecast, 2020-2032
- 6.1. Market Analysis, Insights and Forecast - by Application
- 6.1.1. Manufacturing
- 6.1.2. Security and Surveillance
- 6.1.3. Medical and Life Sciences
- 6.1.4. Intelligent Transportation System (ITS)
- 6.1.5. Other
- 6.2. Market Analysis, Insights and Forecast - by Type
- 6.2.1. Video Surveillance and Alarm Systems
- 6.2.2. Industrial Robot
- 6.2.3. Security Camera
- 6.2.4. Others
- 6.1. Market Analysis, Insights and Forecast - by Application
- 7. South America Intelligent Vision Camera Analysis, Insights and Forecast, 2020-2032
- 7.1. Market Analysis, Insights and Forecast - by Application
- 7.1.1. Manufacturing
- 7.1.2. Security and Surveillance
- 7.1.3. Medical and Life Sciences
- 7.1.4. Intelligent Transportation System (ITS)
- 7.1.5. Other
- 7.2. Market Analysis, Insights and Forecast - by Type
- 7.2.1. Video Surveillance and Alarm Systems
- 7.2.2. Industrial Robot
- 7.2.3. Security Camera
- 7.2.4. Others
- 7.1. Market Analysis, Insights and Forecast - by Application
- 8. Europe Intelligent Vision Camera Analysis, Insights and Forecast, 2020-2032
- 8.1. Market Analysis, Insights and Forecast - by Application
- 8.1.1. Manufacturing
- 8.1.2. Security and Surveillance
- 8.1.3. Medical and Life Sciences
- 8.1.4. Intelligent Transportation System (ITS)
- 8.1.5. Other
- 8.2. Market Analysis, Insights and Forecast - by Type
- 8.2.1. Video Surveillance and Alarm Systems
- 8.2.2. Industrial Robot
- 8.2.3. Security Camera
- 8.2.4. Others
- 8.1. Market Analysis, Insights and Forecast - by Application
- 9. Middle East & Africa Intelligent Vision Camera Analysis, Insights and Forecast, 2020-2032
- 9.1. Market Analysis, Insights and Forecast - by Application
- 9.1.1. Manufacturing
- 9.1.2. Security and Surveillance
- 9.1.3. Medical and Life Sciences
- 9.1.4. Intelligent Transportation System (ITS)
- 9.1.5. Other
- 9.2. Market Analysis, Insights and Forecast - by Type
- 9.2.1. Video Surveillance and Alarm Systems
- 9.2.2. Industrial Robot
- 9.2.3. Security Camera
- 9.2.4. Others
- 9.1. Market Analysis, Insights and Forecast - by Application
- 10. Asia Pacific Intelligent Vision Camera Analysis, Insights and Forecast, 2020-2032
- 10.1. Market Analysis, Insights and Forecast - by Application
- 10.1.1. Manufacturing
- 10.1.2. Security and Surveillance
- 10.1.3. Medical and Life Sciences
- 10.1.4. Intelligent Transportation System (ITS)
- 10.1.5. Other
- 10.2. Market Analysis, Insights and Forecast - by Type
- 10.2.1. Video Surveillance and Alarm Systems
- 10.2.2. Industrial Robot
- 10.2.3. Security Camera
- 10.2.4. Others
- 10.1. Market Analysis, Insights and Forecast - by Application
- 11. Competitive Analysis
- 11.1. Global Market Share Analysis 2025
- 11.2. Company Profiles
- 11.2.1 Advantech
- 11.2.1.1. Overview
- 11.2.1.2. Products
- 11.2.1.3. SWOT Analysis
- 11.2.1.4. Recent Developments
- 11.2.1.5. Financials (Based on Availability)
- 11.2.2 ADLINK Technology
- 11.2.2.1. Overview
- 11.2.2.2. Products
- 11.2.2.3. SWOT Analysis
- 11.2.2.4. Recent Developments
- 11.2.2.5. Financials (Based on Availability)
- 11.2.3 TURCK
- 11.2.3.1. Overview
- 11.2.3.2. Products
- 11.2.3.3. SWOT Analysis
- 11.2.3.4. Recent Developments
- 11.2.3.5. Financials (Based on Availability)
- 11.2.4 Sony
- 11.2.4.1. Overview
- 11.2.4.2. Products
- 11.2.4.3. SWOT Analysis
- 11.2.4.4. Recent Developments
- 11.2.4.5. Financials (Based on Availability)
- 11.2.5 AFRY
- 11.2.5.1. Overview
- 11.2.5.2. Products
- 11.2.5.3. SWOT Analysis
- 11.2.5.4. Recent Developments
- 11.2.5.5. Financials (Based on Availability)
- 11.2.6 ABB
- 11.2.6.1. Overview
- 11.2.6.2. Products
- 11.2.6.3. SWOT Analysis
- 11.2.6.4. Recent Developments
- 11.2.6.5. Financials (Based on Availability)
- 11.2.7 NI
- 11.2.7.1. Overview
- 11.2.7.2. Products
- 11.2.7.3. SWOT Analysis
- 11.2.7.4. Recent Developments
- 11.2.7.5. Financials (Based on Availability)
- 11.2.8 Teledyne Technologies
- 11.2.8.1. Overview
- 11.2.8.2. Products
- 11.2.8.3. SWOT Analysis
- 11.2.8.4. Recent Developments
- 11.2.8.5. Financials (Based on Availability)
- 11.2.9 Keyence
- 11.2.9.1. Overview
- 11.2.9.2. Products
- 11.2.9.3. SWOT Analysis
- 11.2.9.4. Recent Developments
- 11.2.9.5. Financials (Based on Availability)
- 11.2.10 Datalogic
- 11.2.10.1. Overview
- 11.2.10.2. Products
- 11.2.10.3. SWOT Analysis
- 11.2.10.4. Recent Developments
- 11.2.10.5. Financials (Based on Availability)
- 11.2.11 Baumer Holding AG
- 11.2.11.1. Overview
- 11.2.11.2. Products
- 11.2.11.3. SWOT Analysis
- 11.2.11.4. Recent Developments
- 11.2.11.5. Financials (Based on Availability)
- 11.2.12 NET GmbH
- 11.2.12.1. Overview
- 11.2.12.2. Products
- 11.2.12.3. SWOT Analysis
- 11.2.12.4. Recent Developments
- 11.2.12.5. Financials (Based on Availability)
- 11.2.13 OPT Machine Vision
- 11.2.13.1. Overview
- 11.2.13.2. Products
- 11.2.13.3. SWOT Analysis
- 11.2.13.4. Recent Developments
- 11.2.13.5. Financials (Based on Availability)
- 11.2.14 Matrix Vision GmbH
- 11.2.14.1. Overview
- 11.2.14.2. Products
- 11.2.14.3. SWOT Analysis
- 11.2.14.4. Recent Developments
- 11.2.14.5. Financials (Based on Availability)
- 11.2.15 Matrox Imaging
- 11.2.15.1. Overview
- 11.2.15.2. Products
- 11.2.15.3. SWOT Analysis
- 11.2.15.4. Recent Developments
- 11.2.15.5. Financials (Based on Availability)
- 11.2.16 Tattile Srl
- 11.2.16.1. Overview
- 11.2.16.2. Products
- 11.2.16.3. SWOT Analysis
- 11.2.16.4. Recent Developments
- 11.2.16.5. Financials (Based on Availability)
- 11.2.17 Banner Engineering
- 11.2.17.1. Overview
- 11.2.17.2. Products
- 11.2.17.3. SWOT Analysis
- 11.2.17.4. Recent Developments
- 11.2.17.5. Financials (Based on Availability)
- 11.2.18 Industrial Vision Systems
- 11.2.18.1. Overview
- 11.2.18.2. Products
- 11.2.18.3. SWOT Analysis
- 11.2.18.4. Recent Developments
- 11.2.18.5. Financials (Based on Availability)
- 11.2.19 Rotalec
- 11.2.19.1. Overview
- 11.2.19.2. Products
- 11.2.19.3. SWOT Analysis
- 11.2.19.4. Recent Developments
- 11.2.19.5. Financials (Based on Availability)
- 11.2.1 Advantech
List of Figures
- Figure 1: Global Intelligent Vision Camera Revenue Breakdown (billion, %) by Region 2025 & 2033
- Figure 2: Global Intelligent Vision Camera Volume Breakdown (K, %) by Region 2025 & 2033
- Figure 3: North America Intelligent Vision Camera Revenue (billion), by Application 2025 & 2033
- Figure 4: North America Intelligent Vision Camera Volume (K), by Application 2025 & 2033
- Figure 5: North America Intelligent Vision Camera Revenue Share (%), by Application 2025 & 2033
- Figure 6: North America Intelligent Vision Camera Volume Share (%), by Application 2025 & 2033
- Figure 7: North America Intelligent Vision Camera Revenue (billion), by Type 2025 & 2033
- Figure 8: North America Intelligent Vision Camera Volume (K), by Type 2025 & 2033
- Figure 9: North America Intelligent Vision Camera Revenue Share (%), by Type 2025 & 2033
- Figure 10: North America Intelligent Vision Camera Volume Share (%), by Type 2025 & 2033
- Figure 11: North America Intelligent Vision Camera Revenue (billion), by Country 2025 & 2033
- Figure 12: North America Intelligent Vision Camera Volume (K), by Country 2025 & 2033
- Figure 13: North America Intelligent Vision Camera Revenue Share (%), by Country 2025 & 2033
- Figure 14: North America Intelligent Vision Camera Volume Share (%), by Country 2025 & 2033
- Figure 15: South America Intelligent Vision Camera Revenue (billion), by Application 2025 & 2033
- Figure 16: South America Intelligent Vision Camera Volume (K), by Application 2025 & 2033
- Figure 17: South America Intelligent Vision Camera Revenue Share (%), by Application 2025 & 2033
- Figure 18: South America Intelligent Vision Camera Volume Share (%), by Application 2025 & 2033
- Figure 19: South America Intelligent Vision Camera Revenue (billion), by Type 2025 & 2033
- Figure 20: South America Intelligent Vision Camera Volume (K), by Type 2025 & 2033
- Figure 21: South America Intelligent Vision Camera Revenue Share (%), by Type 2025 & 2033
- Figure 22: South America Intelligent Vision Camera Volume Share (%), by Type 2025 & 2033
- Figure 23: South America Intelligent Vision Camera Revenue (billion), by Country 2025 & 2033
- Figure 24: South America Intelligent Vision Camera Volume (K), by Country 2025 & 2033
- Figure 25: South America Intelligent Vision Camera Revenue Share (%), by Country 2025 & 2033
- Figure 26: South America Intelligent Vision Camera Volume Share (%), by Country 2025 & 2033
- Figure 27: Europe Intelligent Vision Camera Revenue (billion), by Application 2025 & 2033
- Figure 28: Europe Intelligent Vision Camera Volume (K), by Application 2025 & 2033
- Figure 29: Europe Intelligent Vision Camera Revenue Share (%), by Application 2025 & 2033
- Figure 30: Europe Intelligent Vision Camera Volume Share (%), by Application 2025 & 2033
- Figure 31: Europe Intelligent Vision Camera Revenue (billion), by Type 2025 & 2033
- Figure 32: Europe Intelligent Vision Camera Volume (K), by Type 2025 & 2033
- Figure 33: Europe Intelligent Vision Camera Revenue Share (%), by Type 2025 & 2033
- Figure 34: Europe Intelligent Vision Camera Volume Share (%), by Type 2025 & 2033
- Figure 35: Europe Intelligent Vision Camera Revenue (billion), by Country 2025 & 2033
- Figure 36: Europe Intelligent Vision Camera Volume (K), by Country 2025 & 2033
- Figure 37: Europe Intelligent Vision Camera Revenue Share (%), by Country 2025 & 2033
- Figure 38: Europe Intelligent Vision Camera Volume Share (%), by Country 2025 & 2033
- Figure 39: Middle East & Africa Intelligent Vision Camera Revenue (billion), by Application 2025 & 2033
- Figure 40: Middle East & Africa Intelligent Vision Camera Volume (K), by Application 2025 & 2033
- Figure 41: Middle East & Africa Intelligent Vision Camera Revenue Share (%), by Application 2025 & 2033
- Figure 42: Middle East & Africa Intelligent Vision Camera Volume Share (%), by Application 2025 & 2033
- Figure 43: Middle East & Africa Intelligent Vision Camera Revenue (billion), by Type 2025 & 2033
- Figure 44: Middle East & Africa Intelligent Vision Camera Volume (K), by Type 2025 & 2033
- Figure 45: Middle East & Africa Intelligent Vision Camera Revenue Share (%), by Type 2025 & 2033
- Figure 46: Middle East & Africa Intelligent Vision Camera Volume Share (%), by Type 2025 & 2033
- Figure 47: Middle East & Africa Intelligent Vision Camera Revenue (billion), by Country 2025 & 2033
- Figure 48: Middle East & Africa Intelligent Vision Camera Volume (K), by Country 2025 & 2033
- Figure 49: Middle East & Africa Intelligent Vision Camera Revenue Share (%), by Country 2025 & 2033
- Figure 50: Middle East & Africa Intelligent Vision Camera Volume Share (%), by Country 2025 & 2033
- Figure 51: Asia Pacific Intelligent Vision Camera Revenue (billion), by Application 2025 & 2033
- Figure 52: Asia Pacific Intelligent Vision Camera Volume (K), by Application 2025 & 2033
- Figure 53: Asia Pacific Intelligent Vision Camera Revenue Share (%), by Application 2025 & 2033
- Figure 54: Asia Pacific Intelligent Vision Camera Volume Share (%), by Application 2025 & 2033
- Figure 55: Asia Pacific Intelligent Vision Camera Revenue (billion), by Type 2025 & 2033
- Figure 56: Asia Pacific Intelligent Vision Camera Volume (K), by Type 2025 & 2033
- Figure 57: Asia Pacific Intelligent Vision Camera Revenue Share (%), by Type 2025 & 2033
- Figure 58: Asia Pacific Intelligent Vision Camera Volume Share (%), by Type 2025 & 2033
- Figure 59: Asia Pacific Intelligent Vision Camera Revenue (billion), by Country 2025 & 2033
- Figure 60: Asia Pacific Intelligent Vision Camera Volume (K), by Country 2025 & 2033
- Figure 61: Asia Pacific Intelligent Vision Camera Revenue Share (%), by Country 2025 & 2033
- Figure 62: Asia Pacific Intelligent Vision Camera Volume Share (%), by Country 2025 & 2033
List of Tables
- Table 1: Global Intelligent Vision Camera Revenue billion Forecast, by Application 2020 & 2033
- Table 2: Global Intelligent Vision Camera Volume K Forecast, by Application 2020 & 2033
- Table 3: Global Intelligent Vision Camera Revenue billion Forecast, by Type 2020 & 2033
- Table 4: Global Intelligent Vision Camera Volume K Forecast, by Type 2020 & 2033
- Table 5: Global Intelligent Vision Camera Revenue billion Forecast, by Region 2020 & 2033
- Table 6: Global Intelligent Vision Camera Volume K Forecast, by Region 2020 & 2033
- Table 7: Global Intelligent Vision Camera Revenue billion Forecast, by Application 2020 & 2033
- Table 8: Global Intelligent Vision Camera Volume K Forecast, by Application 2020 & 2033
- Table 9: Global Intelligent Vision Camera Revenue billion Forecast, by Type 2020 & 2033
- Table 10: Global Intelligent Vision Camera Volume K Forecast, by Type 2020 & 2033
- Table 11: Global Intelligent Vision Camera Revenue billion Forecast, by Country 2020 & 2033
- Table 12: Global Intelligent Vision Camera Volume K Forecast, by Country 2020 & 2033
- Table 13: United States Intelligent Vision Camera Revenue (billion) Forecast, by Application 2020 & 2033
- Table 14: United States Intelligent Vision Camera Volume (K) Forecast, by Application 2020 & 2033
- Table 15: Canada Intelligent Vision Camera Revenue (billion) Forecast, by Application 2020 & 2033
- Table 16: Canada Intelligent Vision Camera Volume (K) Forecast, by Application 2020 & 2033
- Table 17: Mexico Intelligent Vision Camera Revenue (billion) Forecast, by Application 2020 & 2033
- Table 18: Mexico Intelligent Vision Camera Volume (K) Forecast, by Application 2020 & 2033
- Table 19: Global Intelligent Vision Camera Revenue billion Forecast, by Application 2020 & 2033
- Table 20: Global Intelligent Vision Camera Volume K Forecast, by Application 2020 & 2033
- Table 21: Global Intelligent Vision Camera Revenue billion Forecast, by Type 2020 & 2033
- Table 22: Global Intelligent Vision Camera Volume K Forecast, by Type 2020 & 2033
- Table 23: Global Intelligent Vision Camera Revenue billion Forecast, by Country 2020 & 2033
- Table 24: Global Intelligent Vision Camera Volume K Forecast, by Country 2020 & 2033
- Table 25: Brazil Intelligent Vision Camera Revenue (billion) Forecast, by Application 2020 & 2033
- Table 26: Brazil Intelligent Vision Camera Volume (K) Forecast, by Application 2020 & 2033
- Table 27: Argentina Intelligent Vision Camera Revenue (billion) Forecast, by Application 2020 & 2033
- Table 28: Argentina Intelligent Vision Camera Volume (K) Forecast, by Application 2020 & 2033
- Table 29: Rest of South America Intelligent Vision Camera Revenue (billion) Forecast, by Application 2020 & 2033
- Table 30: Rest of South America Intelligent Vision Camera Volume (K) Forecast, by Application 2020 & 2033
- Table 31: Global Intelligent Vision Camera Revenue billion Forecast, by Application 2020 & 2033
- Table 32: Global Intelligent Vision Camera Volume K Forecast, by Application 2020 & 2033
- Table 33: Global Intelligent Vision Camera Revenue billion Forecast, by Type 2020 & 2033
- Table 34: Global Intelligent Vision Camera Volume K Forecast, by Type 2020 & 2033
- Table 35: Global Intelligent Vision Camera Revenue billion Forecast, by Country 2020 & 2033
- Table 36: Global Intelligent Vision Camera Volume K Forecast, by Country 2020 & 2033
- Table 37: United Kingdom Intelligent Vision Camera Revenue (billion) Forecast, by Application 2020 & 2033
- Table 38: United Kingdom Intelligent Vision Camera Volume (K) Forecast, by Application 2020 & 2033
- Table 39: Germany Intelligent Vision Camera Revenue (billion) Forecast, by Application 2020 & 2033
- Table 40: Germany Intelligent Vision Camera Volume (K) Forecast, by Application 2020 & 2033
- Table 41: France Intelligent Vision Camera Revenue (billion) Forecast, by Application 2020 & 2033
- Table 42: France Intelligent Vision Camera Volume (K) Forecast, by Application 2020 & 2033
- Table 43: Italy Intelligent Vision Camera Revenue (billion) Forecast, by Application 2020 & 2033
- Table 44: Italy Intelligent Vision Camera Volume (K) Forecast, by Application 2020 & 2033
- Table 45: Spain Intelligent Vision Camera Revenue (billion) Forecast, by Application 2020 & 2033
- Table 46: Spain Intelligent Vision Camera Volume (K) Forecast, by Application 2020 & 2033
- Table 47: Russia Intelligent Vision Camera Revenue (billion) Forecast, by Application 2020 & 2033
- Table 48: Russia Intelligent Vision Camera Volume (K) Forecast, by Application 2020 & 2033
- Table 49: Benelux Intelligent Vision Camera Revenue (billion) Forecast, by Application 2020 & 2033
- Table 50: Benelux Intelligent Vision Camera Volume (K) Forecast, by Application 2020 & 2033
- Table 51: Nordics Intelligent Vision Camera Revenue (billion) Forecast, by Application 2020 & 2033
- Table 52: Nordics Intelligent Vision Camera Volume (K) Forecast, by Application 2020 & 2033
- Table 53: Rest of Europe Intelligent Vision Camera Revenue (billion) Forecast, by Application 2020 & 2033
- Table 54: Rest of Europe Intelligent Vision Camera Volume (K) Forecast, by Application 2020 & 2033
- Table 55: Global Intelligent Vision Camera Revenue billion Forecast, by Application 2020 & 2033
- Table 56: Global Intelligent Vision Camera Volume K Forecast, by Application 2020 & 2033
- Table 57: Global Intelligent Vision Camera Revenue billion Forecast, by Type 2020 & 2033
- Table 58: Global Intelligent Vision Camera Volume K Forecast, by Type 2020 & 2033
- Table 59: Global Intelligent Vision Camera Revenue billion Forecast, by Country 2020 & 2033
- Table 60: Global Intelligent Vision Camera Volume K Forecast, by Country 2020 & 2033
- Table 61: Turkey Intelligent Vision Camera Revenue (billion) Forecast, by Application 2020 & 2033
- Table 62: Turkey Intelligent Vision Camera Volume (K) Forecast, by Application 2020 & 2033
- Table 63: Israel Intelligent Vision Camera Revenue (billion) Forecast, by Application 2020 & 2033
- Table 64: Israel Intelligent Vision Camera Volume (K) Forecast, by Application 2020 & 2033
- Table 65: GCC Intelligent Vision Camera Revenue (billion) Forecast, by Application 2020 & 2033
- Table 66: GCC Intelligent Vision Camera Volume (K) Forecast, by Application 2020 & 2033
- Table 67: North Africa Intelligent Vision Camera Revenue (billion) Forecast, by Application 2020 & 2033
- Table 68: North Africa Intelligent Vision Camera Volume (K) Forecast, by Application 2020 & 2033
- Table 69: South Africa Intelligent Vision Camera Revenue (billion) Forecast, by Application 2020 & 2033
- Table 70: South Africa Intelligent Vision Camera Volume (K) Forecast, by Application 2020 & 2033
- Table 71: Rest of Middle East & Africa Intelligent Vision Camera Revenue (billion) Forecast, by Application 2020 & 2033
- Table 72: Rest of Middle East & Africa Intelligent Vision Camera Volume (K) Forecast, by Application 2020 & 2033
- Table 73: Global Intelligent Vision Camera Revenue billion Forecast, by Application 2020 & 2033
- Table 74: Global Intelligent Vision Camera Volume K Forecast, by Application 2020 & 2033
- Table 75: Global Intelligent Vision Camera Revenue billion Forecast, by Type 2020 & 2033
- Table 76: Global Intelligent Vision Camera Volume K Forecast, by Type 2020 & 2033
- Table 77: Global Intelligent Vision Camera Revenue billion Forecast, by Country 2020 & 2033
- Table 78: Global Intelligent Vision Camera Volume K Forecast, by Country 2020 & 2033
- Table 79: China Intelligent Vision Camera Revenue (billion) Forecast, by Application 2020 & 2033
- Table 80: China Intelligent Vision Camera Volume (K) Forecast, by Application 2020 & 2033
- Table 81: India Intelligent Vision Camera Revenue (billion) Forecast, by Application 2020 & 2033
- Table 82: India Intelligent Vision Camera Volume (K) Forecast, by Application 2020 & 2033
- Table 83: Japan Intelligent Vision Camera Revenue (billion) Forecast, by Application 2020 & 2033
- Table 84: Japan Intelligent Vision Camera Volume (K) Forecast, by Application 2020 & 2033
- Table 85: South Korea Intelligent Vision Camera Revenue (billion) Forecast, by Application 2020 & 2033
- Table 86: South Korea Intelligent Vision Camera Volume (K) Forecast, by Application 2020 & 2033
- Table 87: ASEAN Intelligent Vision Camera Revenue (billion) Forecast, by Application 2020 & 2033
- Table 88: ASEAN Intelligent Vision Camera Volume (K) Forecast, by Application 2020 & 2033
- Table 89: Oceania Intelligent Vision Camera Revenue (billion) Forecast, by Application 2020 & 2033
- Table 90: Oceania Intelligent Vision Camera Volume (K) Forecast, by Application 2020 & 2033
- Table 91: Rest of Asia Pacific Intelligent Vision Camera Revenue (billion) Forecast, by Application 2020 & 2033
- Table 92: Rest of Asia Pacific Intelligent Vision Camera Volume (K) Forecast, by Application 2020 & 2033
Frequently Asked Questions
1. What is the projected Compound Annual Growth Rate (CAGR) of the Intelligent Vision Camera?
The projected CAGR is approximately 8.3%.
2. Which companies are prominent players in the Intelligent Vision Camera?
Key companies in the market include Advantech, ADLINK Technology, TURCK, Sony, AFRY, ABB, NI, Teledyne Technologies, Keyence, Datalogic, Baumer Holding AG, NET GmbH, OPT Machine Vision, Matrix Vision GmbH, Matrox Imaging, Tattile Srl, Banner Engineering, Industrial Vision Systems, Rotalec.
3. What are the main segments of the Intelligent Vision Camera?
The market segments include Application, Type.
4. Can you provide details about the market size?
The market size is estimated to be USD 15.83 billion as of 2022.
5. What are some drivers contributing to market growth?
N/A
6. What are the notable trends driving market growth?
N/A
7. Are there any restraints impacting market growth?
N/A
8. Can you provide examples of recent developments in the market?
N/A
9. What pricing options are available for accessing the report?
Pricing options include single-user, multi-user, and enterprise licenses priced at USD 3950.00, USD 5925.00, and USD 7900.00 respectively.
10. Is the market size provided in terms of value or volume?
The market size is provided in terms of value, measured in billion and volume, measured in K.
11. Are there any specific market keywords associated with the report?
Yes, the market keyword associated with the report is "Intelligent Vision Camera," which aids in identifying and referencing the specific market segment covered.
12. How do I determine which pricing option suits my needs best?
The pricing options vary based on user requirements and access needs. Individual users may opt for single-user licenses, while businesses requiring broader access may choose multi-user or enterprise licenses for cost-effective access to the report.
13. Are there any additional resources or data provided in the Intelligent Vision Camera report?
While the report offers comprehensive insights, it's advisable to review the specific contents or supplementary materials provided to ascertain if additional resources or data are available.
14. How can I stay updated on further developments or reports in the Intelligent Vision Camera?
To stay informed about further developments, trends, and reports in the Intelligent Vision Camera, consider subscribing to industry newsletters, following relevant companies and organizations, or regularly checking reputable industry news sources and publications.
Methodology
Step 1 - Identification of Relevant Samples Size from Population Database


Step 2 - Approaches for Defining Global Market Size (Value, Volume* & Price*)

Note*: In applicable scenarios
Step 3 - Data Sources
Primary Research
- Web Analytics
- Survey Reports
- Research Institute
- Latest Research Reports
- Opinion Leaders
Secondary Research
- Annual Reports
- White Paper
- Latest Press Release
- Industry Association
- Paid Database
- Investor Presentations

Step 4 - Data Triangulation
Involves using different sources of information in order to increase the validity of a study
These sources are likely to be stakeholders in a program - participants, other researchers, program staff, other community members, and so on.
Then we put all data in single framework & apply various statistical tools to find out the dynamic on the market.
During the analysis stage, feedback from the stakeholder groups would be compared to determine areas of agreement as well as areas of divergence