
Key Insights
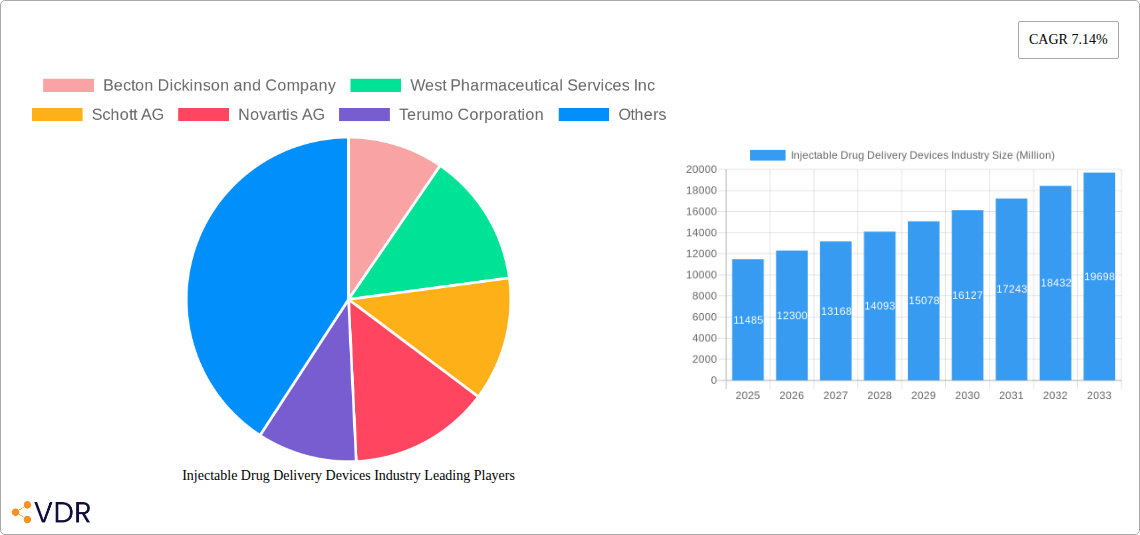
The injectable drug delivery devices market is experiencing robust growth, projected to reach a substantial size driven by several key factors. The market's Compound Annual Growth Rate (CAGR) of 7.14% from 2019 to 2024 indicates a consistent upward trajectory, further fueled by an aging global population with increasing prevalence of chronic diseases like cardiovascular disease, diabetes, and cancer. These conditions necessitate frequent injections, significantly boosting demand for devices across various therapeutic applications. Technological advancements in advanced drug delivery systems, such as pre-filled syringes, auto-injectors, and smart injectors, are enhancing patient convenience and improving medication adherence, contributing to market expansion. Furthermore, the increasing outsourcing of drug manufacturing and packaging to contract manufacturers specializing in injectable drug delivery is streamlining operations and boosting market growth. The growing preference for biologics, which often require injectable delivery, is another significant driver.
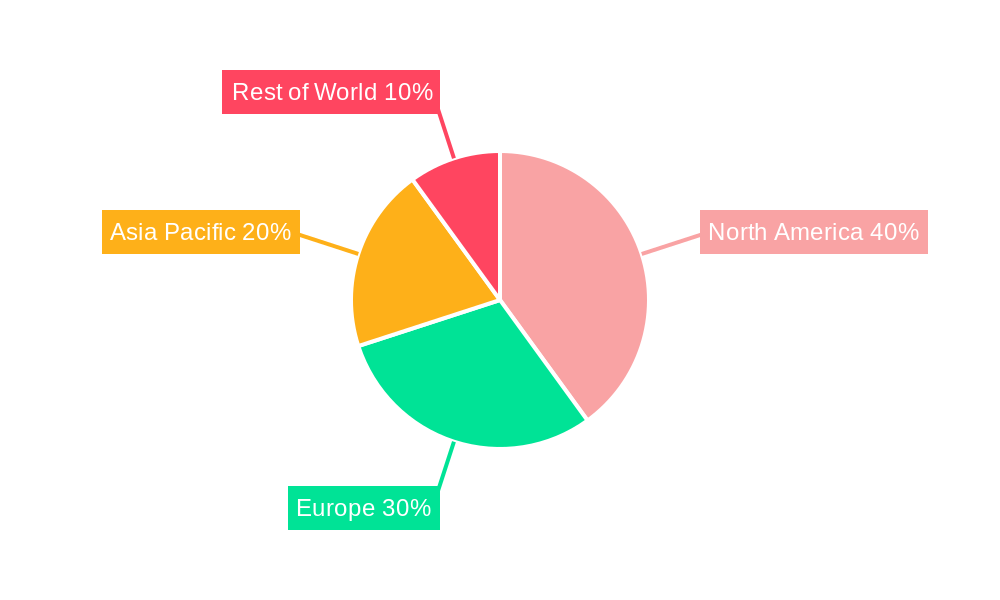
Geographic distribution of the market shows significant regional variations. North America and Europe currently hold substantial market shares due to established healthcare infrastructure and high adoption rates of advanced drug delivery devices. However, rapidly developing economies in Asia Pacific and other regions are showing significant growth potential, driven by rising healthcare expenditure and increasing awareness about chronic diseases. Competitive intensity is high, with major pharmaceutical and medical device companies such as Becton Dickinson, West Pharmaceutical Services, and others actively engaged in research and development, mergers, acquisitions, and strategic partnerships to maintain their market positions and capitalize on emerging opportunities. Regulatory approvals and stringent quality standards will continue to shape the competitive landscape, particularly for innovative advanced drug delivery systems. The market is segmented by device type (conventional vs. advanced) and therapeutic application, enabling targeted strategies for various stakeholders.
Injectable Drug Delivery Devices Industry Market Report: 2019-2033
This comprehensive report provides an in-depth analysis of the Injectable Drug Delivery Devices market, encompassing market dynamics, growth trends, regional dominance, product landscape, key players, and future outlook. The study period covers 2019-2033, with 2025 as the base year and forecast period extending to 2033. The report segments the market by Devices Type (Conventional Drug Delivery Devices, Advanced Drug Delivery Devices) and Therapeutic Application (Cardiovascular Disease, Diabetes, Oncology, Autoimmune Disorders, Hepatitis, Other Therapeutic Applications). The global market size is estimated to reach xx Million units by 2025.
Injectable Drug Delivery Devices Industry Market Dynamics & Structure
This section analyzes the market's competitive landscape, technological advancements, regulatory environment, and market forces. The market is characterized by a moderately concentrated structure with key players holding significant market share. Becton Dickinson and Company, West Pharmaceutical Services Inc., and Schott AG are among the leading players.
Market Concentration: The top 5 players hold approximately xx% of the market share in 2025. This is expected to decline slightly by 2033 to xx%.
Technological Innovation: Advancements in materials science (e.g., biocompatible polymers), miniaturization technologies, and smart delivery systems are driving innovation. However, high R&D costs and regulatory hurdles pose significant barriers to entry.
Regulatory Frameworks: Stringent regulatory approvals (e.g., FDA, EMA) significantly impact market entry and product development timelines. Harmonization of global regulations is a crucial factor influencing market growth.
Competitive Product Substitutes: Oral and transdermal drug delivery systems are potential substitutes, but injectable devices maintain dominance due to superior efficacy and bioavailability for certain therapeutic applications.
End-User Demographics: Growth is driven by the increasing prevalence of chronic diseases such as diabetes, cardiovascular diseases, and cancer, leading to higher demand for injectable medications.
M&A Trends: The sector witnesses frequent mergers and acquisitions, driven by companies seeking to expand their product portfolio, gain market share, and access new technologies. An estimated xx M&A deals were recorded between 2019-2024.
Injectable Drug Delivery Devices Industry Growth Trends & Insights
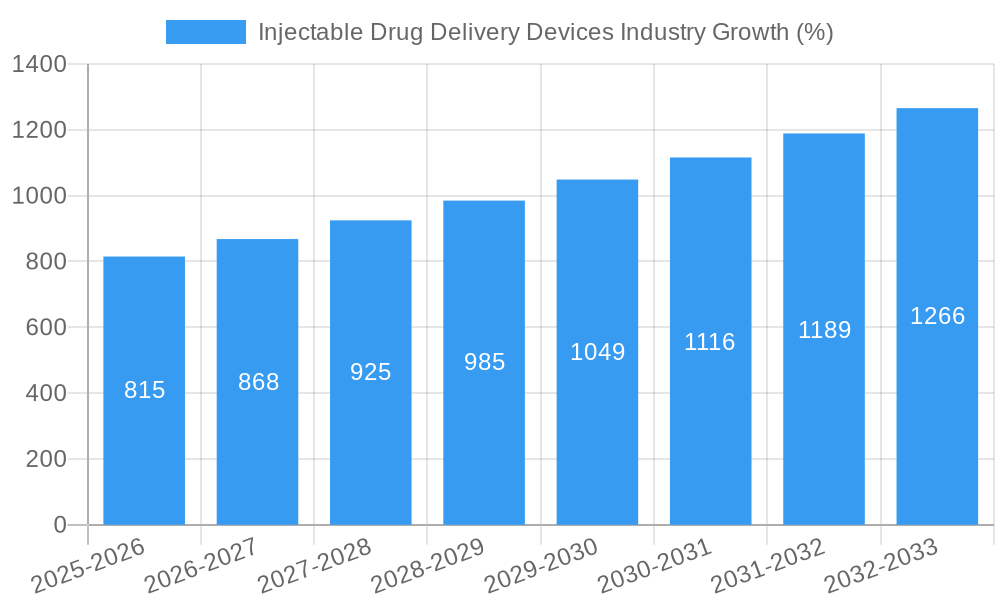
The global injectable drug delivery devices market exhibits a robust growth trajectory, fueled by factors such as the rising prevalence of chronic diseases, advancements in drug delivery technologies, and an expanding geriatric population. The market experienced a CAGR of xx% during the historical period (2019-2024), and is projected to maintain a CAGR of xx% during the forecast period (2025-2033), reaching a market size of xx Million units by 2033. This growth is further stimulated by the increasing adoption of advanced drug delivery systems, such as pre-filled syringes and auto-injectors, owing to their improved convenience and reduced healthcare personnel interaction. Consumer behavior is shifting towards self-administered injectable medications, further driving market expansion. Technological disruptions, including the integration of smart technologies and connected devices, are expected to further propel market growth in the coming years. Market penetration of advanced drug delivery devices is projected to increase from xx% in 2025 to xx% by 2033.
Dominant Regions, Countries, or Segments in Injectable Drug Delivery Devices Industry
North America and Europe currently dominate the injectable drug delivery devices market, driven by robust healthcare infrastructure, high healthcare expenditure, and a large patient population with chronic diseases. However, Asia-Pacific is poised for significant growth due to increasing healthcare investments and rising prevalence of chronic illnesses.
By Devices Type: Advanced drug delivery devices are experiencing faster growth compared to conventional devices, driven by increasing demand for convenience, patient compliance, and improved drug efficacy.
By Therapeutic Application: Oncology and diabetes segments are the largest contributors to market growth, driven by the high prevalence of these diseases and the increasing preference for injectable therapies.
- Key Drivers (North America): Advanced healthcare infrastructure, high R&D investment, favorable regulatory environment.
- Key Drivers (Europe): High healthcare expenditure, stringent regulatory approvals, strong pharmaceutical industry presence.
- Key Drivers (Asia-Pacific): Rising healthcare expenditure, increasing prevalence of chronic diseases, growing adoption of advanced technologies.
Injectable Drug Delivery Devices Industry Product Landscape
The injectable drug delivery device market encompasses a wide range of products, including pre-filled syringes, auto-injectors, pen injectors, and infusion pumps. Continuous innovation focuses on improving ease of use, reducing needle phobia, and enhancing patient compliance. Recent advancements include smart injectors with integrated tracking and data monitoring capabilities, contributing to better disease management. The unique selling propositions include improved patient experience, enhanced efficacy, reduced healthcare costs, and advanced data analytics.
Key Drivers, Barriers & Challenges in Injectable Drug Delivery Devices Industry
Key Drivers:
- Rising prevalence of chronic diseases (diabetes, cancer, autoimmune disorders).
- Technological advancements leading to improved drug delivery systems.
- Increasing demand for convenient and self-administered therapies.
- Growing geriatric population.
Key Challenges:
- Stringent regulatory approvals leading to long product development cycles.
- High R&D costs associated with developing new technologies.
- Intense competition among established players and emerging companies.
- Supply chain disruptions impacting the availability of raw materials. (estimated impact: xx% reduction in production in 2022)
Emerging Opportunities in Injectable Drug Delivery Devices Industry
- Development of biocompatible and biodegradable materials for enhanced safety and reduced adverse effects.
- Integration of smart technologies and digital health solutions for improved patient monitoring and compliance.
- Expansion into emerging markets with high growth potential (e.g., Africa, Latin America).
- Development of personalized drug delivery systems tailored to individual patient needs.
Growth Accelerators in the Injectable Drug Delivery Devices Industry
Long-term growth is driven by sustained technological advancements in areas such as drug formulation, materials science, and miniaturization. Strategic partnerships between pharmaceutical companies and device manufacturers will accelerate innovation and market penetration. Expansion into untapped markets through increased accessibility and affordability of injectable therapies, particularly in developing nations, will further fuel market expansion.
Key Players Shaping the Injectable Drug Delivery Devices Industry Market
- Becton Dickinson and Company
- West Pharmaceutical Services Inc
- Schott AG
- Novartis AG
- Terumo Corporation
- Eli Lilly and Company
- F Hoffmann-La Roche Ltd
- Teva Pharmaceutical Industries Ltd
- Novo Nordisk A/S
- Baxter International Inc
- Gerresheimer AG
- Pfizer Inc
Notable Milestones in Injectable Drug Delivery Devices Industry Sector
- January 2022: Hikma Pharmaceuticals USA Inc. launched Diazepam Injection, USP, expanding its pre-filled syringe offerings.
- November 2022: Medmix Drug Delivery (Haselmeier) and AARDEX Group collaborated to improve self-administration of injectable drugs in clinical trials.
In-Depth Injectable Drug Delivery Devices Industry Market Outlook
The future of the injectable drug delivery devices market appears exceptionally promising. Continued technological advancements, strategic collaborations, and expansion into new markets will sustain robust growth. Opportunities exist for companies focusing on developing innovative, patient-centric devices that improve treatment outcomes and address unmet medical needs. The market is expected to see sustained growth, driven by factors outlined above, presenting lucrative investment opportunities for stakeholders.
Injectable Drug Delivery Devices Industry Segmentation
-
1. Devices Type
- 1.1. Conventional Drug Delivery Devices
-
1.2. Advanced Drug Delivery Devices
- 1.2.1. Prefilled Syringes
- 1.2.2. Injectable Pens
- 1.2.3. Auto Injectors
- 1.2.4. Needle-free Injectors
- 1.2.5. Other Device Types
-
2. Therapeutic Application
- 2.1. Cardiovascular Disease
- 2.2. Diabetes
- 2.3. Oncology
- 2.4. Autoimmune Disorders
- 2.5. Hepatitis
- 2.6. Other Therapeutic Applications
Injectable Drug Delivery Devices Industry Segmentation By Geography
-
1. North America
- 1.1. United States
- 1.2. Canada
- 1.3. Mexico
-
2. Europe
- 2.1. Germany
- 2.2. United Kingdom
- 2.3. France
- 2.4. Italy
- 2.5. Spain
- 2.6. Rest of Europe
-
3. Asia Pacific
- 3.1. China
- 3.2. Japan
- 3.3. India
- 3.4. Australia
- 3.5. South Korea
- 3.6. Rest of Asia Pacific
-
4. Middle East and Africa
- 4.1. GCC
- 4.2. South Africa
- 4.3. Rest of Middle East and Africa
-
5. South America
- 5.1. Brazil
- 5.2. Argentina
- 5.3. Rest of South America
Injectable Drug Delivery Devices Industry REPORT HIGHLIGHTS
| Aspects | Details |
|---|---|
| Study Period | 2019-2033 |
| Base Year | 2024 |
| Estimated Year | 2025 |
| Forecast Period | 2025-2033 |
| Historical Period | 2019-2024 |
| Growth Rate | CAGR of 7.14% from 2019-2033 |
| Segmentation |
|
Table of Contents
- 1. Introduction
- 1.1. Research Scope
- 1.2. Market Segmentation
- 1.3. Research Methodology
- 1.4. Definitions and Assumptions
- 2. Executive Summary
- 2.1. Introduction
- 3. Market Dynamics
- 3.1. Introduction
- 3.2. Market Drivers
- 3.2.1. Increasing Burden of Chronic Diseases; Benefits and Convenience in Self Injectors; Growth of the Biologics Market Leading to Increased Demand for Injectors
- 3.3. Market Restrains
- 3.3.1. Injuries and Infections Caused by Needles; Increasing Use of Alternative Delivery Methods
- 3.4. Market Trends
- 3.4.1. Prefilled Syringes Subsegment is Anticipated to Grow Significantly Over the Forecast Period
- 4. Market Factor Analysis
- 4.1. Porters Five Forces
- 4.2. Supply/Value Chain
- 4.3. PESTEL analysis
- 4.4. Market Entropy
- 4.5. Patent/Trademark Analysis
- 5. Global Injectable Drug Delivery Devices Industry Analysis, Insights and Forecast, 2019-2031
- 5.1. Market Analysis, Insights and Forecast - by Devices Type
- 5.1.1. Conventional Drug Delivery Devices
- 5.1.2. Advanced Drug Delivery Devices
- 5.1.2.1. Prefilled Syringes
- 5.1.2.2. Injectable Pens
- 5.1.2.3. Auto Injectors
- 5.1.2.4. Needle-free Injectors
- 5.1.2.5. Other Device Types
- 5.2. Market Analysis, Insights and Forecast - by Therapeutic Application
- 5.2.1. Cardiovascular Disease
- 5.2.2. Diabetes
- 5.2.3. Oncology
- 5.2.4. Autoimmune Disorders
- 5.2.5. Hepatitis
- 5.2.6. Other Therapeutic Applications
- 5.3. Market Analysis, Insights and Forecast - by Region
- 5.3.1. North America
- 5.3.2. Europe
- 5.3.3. Asia Pacific
- 5.3.4. Middle East and Africa
- 5.3.5. South America
- 5.1. Market Analysis, Insights and Forecast - by Devices Type
- 6. North America Injectable Drug Delivery Devices Industry Analysis, Insights and Forecast, 2019-2031
- 6.1. Market Analysis, Insights and Forecast - by Devices Type
- 6.1.1. Conventional Drug Delivery Devices
- 6.1.2. Advanced Drug Delivery Devices
- 6.1.2.1. Prefilled Syringes
- 6.1.2.2. Injectable Pens
- 6.1.2.3. Auto Injectors
- 6.1.2.4. Needle-free Injectors
- 6.1.2.5. Other Device Types
- 6.2. Market Analysis, Insights and Forecast - by Therapeutic Application
- 6.2.1. Cardiovascular Disease
- 6.2.2. Diabetes
- 6.2.3. Oncology
- 6.2.4. Autoimmune Disorders
- 6.2.5. Hepatitis
- 6.2.6. Other Therapeutic Applications
- 6.1. Market Analysis, Insights and Forecast - by Devices Type
- 7. Europe Injectable Drug Delivery Devices Industry Analysis, Insights and Forecast, 2019-2031
- 7.1. Market Analysis, Insights and Forecast - by Devices Type
- 7.1.1. Conventional Drug Delivery Devices
- 7.1.2. Advanced Drug Delivery Devices
- 7.1.2.1. Prefilled Syringes
- 7.1.2.2. Injectable Pens
- 7.1.2.3. Auto Injectors
- 7.1.2.4. Needle-free Injectors
- 7.1.2.5. Other Device Types
- 7.2. Market Analysis, Insights and Forecast - by Therapeutic Application
- 7.2.1. Cardiovascular Disease
- 7.2.2. Diabetes
- 7.2.3. Oncology
- 7.2.4. Autoimmune Disorders
- 7.2.5. Hepatitis
- 7.2.6. Other Therapeutic Applications
- 7.1. Market Analysis, Insights and Forecast - by Devices Type
- 8. Asia Pacific Injectable Drug Delivery Devices Industry Analysis, Insights and Forecast, 2019-2031
- 8.1. Market Analysis, Insights and Forecast - by Devices Type
- 8.1.1. Conventional Drug Delivery Devices
- 8.1.2. Advanced Drug Delivery Devices
- 8.1.2.1. Prefilled Syringes
- 8.1.2.2. Injectable Pens
- 8.1.2.3. Auto Injectors
- 8.1.2.4. Needle-free Injectors
- 8.1.2.5. Other Device Types
- 8.2. Market Analysis, Insights and Forecast - by Therapeutic Application
- 8.2.1. Cardiovascular Disease
- 8.2.2. Diabetes
- 8.2.3. Oncology
- 8.2.4. Autoimmune Disorders
- 8.2.5. Hepatitis
- 8.2.6. Other Therapeutic Applications
- 8.1. Market Analysis, Insights and Forecast - by Devices Type
- 9. Middle East and Africa Injectable Drug Delivery Devices Industry Analysis, Insights and Forecast, 2019-2031
- 9.1. Market Analysis, Insights and Forecast - by Devices Type
- 9.1.1. Conventional Drug Delivery Devices
- 9.1.2. Advanced Drug Delivery Devices
- 9.1.2.1. Prefilled Syringes
- 9.1.2.2. Injectable Pens
- 9.1.2.3. Auto Injectors
- 9.1.2.4. Needle-free Injectors
- 9.1.2.5. Other Device Types
- 9.2. Market Analysis, Insights and Forecast - by Therapeutic Application
- 9.2.1. Cardiovascular Disease
- 9.2.2. Diabetes
- 9.2.3. Oncology
- 9.2.4. Autoimmune Disorders
- 9.2.5. Hepatitis
- 9.2.6. Other Therapeutic Applications
- 9.1. Market Analysis, Insights and Forecast - by Devices Type
- 10. South America Injectable Drug Delivery Devices Industry Analysis, Insights and Forecast, 2019-2031
- 10.1. Market Analysis, Insights and Forecast - by Devices Type
- 10.1.1. Conventional Drug Delivery Devices
- 10.1.2. Advanced Drug Delivery Devices
- 10.1.2.1. Prefilled Syringes
- 10.1.2.2. Injectable Pens
- 10.1.2.3. Auto Injectors
- 10.1.2.4. Needle-free Injectors
- 10.1.2.5. Other Device Types
- 10.2. Market Analysis, Insights and Forecast - by Therapeutic Application
- 10.2.1. Cardiovascular Disease
- 10.2.2. Diabetes
- 10.2.3. Oncology
- 10.2.4. Autoimmune Disorders
- 10.2.5. Hepatitis
- 10.2.6. Other Therapeutic Applications
- 10.1. Market Analysis, Insights and Forecast - by Devices Type
- 11. North America Injectable Drug Delivery Devices Industry Analysis, Insights and Forecast, 2019-2031
- 11.1. Market Analysis, Insights and Forecast - By Country/Sub-region
- 11.1.1 United States
- 11.1.2 Canada
- 11.1.3 Mexico
- 12. Europe Injectable Drug Delivery Devices Industry Analysis, Insights and Forecast, 2019-2031
- 12.1. Market Analysis, Insights and Forecast - By Country/Sub-region
- 12.1.1 Germany
- 12.1.2 United Kingdom
- 12.1.3 France
- 12.1.4 Italy
- 12.1.5 Spain
- 12.1.6 Rest of Europe
- 13. Asia Pacific Injectable Drug Delivery Devices Industry Analysis, Insights and Forecast, 2019-2031
- 13.1. Market Analysis, Insights and Forecast - By Country/Sub-region
- 13.1.1 China
- 13.1.2 Japan
- 13.1.3 India
- 13.1.4 Australia
- 13.1.5 South Korea
- 13.1.6 Rest of Asia Pacific
- 14. Middle East and Africa Injectable Drug Delivery Devices Industry Analysis, Insights and Forecast, 2019-2031
- 14.1. Market Analysis, Insights and Forecast - By Country/Sub-region
- 14.1.1 GCC
- 14.1.2 South Africa
- 14.1.3 Rest of Middle East and Africa
- 15. South America Injectable Drug Delivery Devices Industry Analysis, Insights and Forecast, 2019-2031
- 15.1. Market Analysis, Insights and Forecast - By Country/Sub-region
- 15.1.1 Brazil
- 15.1.2 Argentina
- 15.1.3 Rest of South America
- 16. Competitive Analysis
- 16.1. Global Market Share Analysis 2024
- 16.2. Company Profiles
- 16.2.1 Becton Dickinson and Company
- 16.2.1.1. Overview
- 16.2.1.2. Products
- 16.2.1.3. SWOT Analysis
- 16.2.1.4. Recent Developments
- 16.2.1.5. Financials (Based on Availability)
- 16.2.2 West Pharmaceutical Services Inc
- 16.2.2.1. Overview
- 16.2.2.2. Products
- 16.2.2.3. SWOT Analysis
- 16.2.2.4. Recent Developments
- 16.2.2.5. Financials (Based on Availability)
- 16.2.3 Schott AG
- 16.2.3.1. Overview
- 16.2.3.2. Products
- 16.2.3.3. SWOT Analysis
- 16.2.3.4. Recent Developments
- 16.2.3.5. Financials (Based on Availability)
- 16.2.4 Novartis AG
- 16.2.4.1. Overview
- 16.2.4.2. Products
- 16.2.4.3. SWOT Analysis
- 16.2.4.4. Recent Developments
- 16.2.4.5. Financials (Based on Availability)
- 16.2.5 Terumo Corporation
- 16.2.5.1. Overview
- 16.2.5.2. Products
- 16.2.5.3. SWOT Analysis
- 16.2.5.4. Recent Developments
- 16.2.5.5. Financials (Based on Availability)
- 16.2.6 Eli Lilly and Company
- 16.2.6.1. Overview
- 16.2.6.2. Products
- 16.2.6.3. SWOT Analysis
- 16.2.6.4. Recent Developments
- 16.2.6.5. Financials (Based on Availability)
- 16.2.7 F Hoffmann-La Roche Ltd*List Not Exhaustive
- 16.2.7.1. Overview
- 16.2.7.2. Products
- 16.2.7.3. SWOT Analysis
- 16.2.7.4. Recent Developments
- 16.2.7.5. Financials (Based on Availability)
- 16.2.8 Teva Pharmaceutical Industries Ltd
- 16.2.8.1. Overview
- 16.2.8.2. Products
- 16.2.8.3. SWOT Analysis
- 16.2.8.4. Recent Developments
- 16.2.8.5. Financials (Based on Availability)
- 16.2.9 Novo Nordisk A/S
- 16.2.9.1. Overview
- 16.2.9.2. Products
- 16.2.9.3. SWOT Analysis
- 16.2.9.4. Recent Developments
- 16.2.9.5. Financials (Based on Availability)
- 16.2.10 Baxter International Inc
- 16.2.10.1. Overview
- 16.2.10.2. Products
- 16.2.10.3. SWOT Analysis
- 16.2.10.4. Recent Developments
- 16.2.10.5. Financials (Based on Availability)
- 16.2.11 Gerresheimer AG
- 16.2.11.1. Overview
- 16.2.11.2. Products
- 16.2.11.3. SWOT Analysis
- 16.2.11.4. Recent Developments
- 16.2.11.5. Financials (Based on Availability)
- 16.2.12 Pfizer Inc
- 16.2.12.1. Overview
- 16.2.12.2. Products
- 16.2.12.3. SWOT Analysis
- 16.2.12.4. Recent Developments
- 16.2.12.5. Financials (Based on Availability)
- 16.2.1 Becton Dickinson and Company
List of Figures
- Figure 1: Global Injectable Drug Delivery Devices Industry Revenue Breakdown (Million, %) by Region 2024 & 2032
- Figure 2: North America Injectable Drug Delivery Devices Industry Revenue (Million), by Country 2024 & 2032
- Figure 3: North America Injectable Drug Delivery Devices Industry Revenue Share (%), by Country 2024 & 2032
- Figure 4: Europe Injectable Drug Delivery Devices Industry Revenue (Million), by Country 2024 & 2032
- Figure 5: Europe Injectable Drug Delivery Devices Industry Revenue Share (%), by Country 2024 & 2032
- Figure 6: Asia Pacific Injectable Drug Delivery Devices Industry Revenue (Million), by Country 2024 & 2032
- Figure 7: Asia Pacific Injectable Drug Delivery Devices Industry Revenue Share (%), by Country 2024 & 2032
- Figure 8: Middle East and Africa Injectable Drug Delivery Devices Industry Revenue (Million), by Country 2024 & 2032
- Figure 9: Middle East and Africa Injectable Drug Delivery Devices Industry Revenue Share (%), by Country 2024 & 2032
- Figure 10: South America Injectable Drug Delivery Devices Industry Revenue (Million), by Country 2024 & 2032
- Figure 11: South America Injectable Drug Delivery Devices Industry Revenue Share (%), by Country 2024 & 2032
- Figure 12: North America Injectable Drug Delivery Devices Industry Revenue (Million), by Devices Type 2024 & 2032
- Figure 13: North America Injectable Drug Delivery Devices Industry Revenue Share (%), by Devices Type 2024 & 2032
- Figure 14: North America Injectable Drug Delivery Devices Industry Revenue (Million), by Therapeutic Application 2024 & 2032
- Figure 15: North America Injectable Drug Delivery Devices Industry Revenue Share (%), by Therapeutic Application 2024 & 2032
- Figure 16: North America Injectable Drug Delivery Devices Industry Revenue (Million), by Country 2024 & 2032
- Figure 17: North America Injectable Drug Delivery Devices Industry Revenue Share (%), by Country 2024 & 2032
- Figure 18: Europe Injectable Drug Delivery Devices Industry Revenue (Million), by Devices Type 2024 & 2032
- Figure 19: Europe Injectable Drug Delivery Devices Industry Revenue Share (%), by Devices Type 2024 & 2032
- Figure 20: Europe Injectable Drug Delivery Devices Industry Revenue (Million), by Therapeutic Application 2024 & 2032
- Figure 21: Europe Injectable Drug Delivery Devices Industry Revenue Share (%), by Therapeutic Application 2024 & 2032
- Figure 22: Europe Injectable Drug Delivery Devices Industry Revenue (Million), by Country 2024 & 2032
- Figure 23: Europe Injectable Drug Delivery Devices Industry Revenue Share (%), by Country 2024 & 2032
- Figure 24: Asia Pacific Injectable Drug Delivery Devices Industry Revenue (Million), by Devices Type 2024 & 2032
- Figure 25: Asia Pacific Injectable Drug Delivery Devices Industry Revenue Share (%), by Devices Type 2024 & 2032
- Figure 26: Asia Pacific Injectable Drug Delivery Devices Industry Revenue (Million), by Therapeutic Application 2024 & 2032
- Figure 27: Asia Pacific Injectable Drug Delivery Devices Industry Revenue Share (%), by Therapeutic Application 2024 & 2032
- Figure 28: Asia Pacific Injectable Drug Delivery Devices Industry Revenue (Million), by Country 2024 & 2032
- Figure 29: Asia Pacific Injectable Drug Delivery Devices Industry Revenue Share (%), by Country 2024 & 2032
- Figure 30: Middle East and Africa Injectable Drug Delivery Devices Industry Revenue (Million), by Devices Type 2024 & 2032
- Figure 31: Middle East and Africa Injectable Drug Delivery Devices Industry Revenue Share (%), by Devices Type 2024 & 2032
- Figure 32: Middle East and Africa Injectable Drug Delivery Devices Industry Revenue (Million), by Therapeutic Application 2024 & 2032
- Figure 33: Middle East and Africa Injectable Drug Delivery Devices Industry Revenue Share (%), by Therapeutic Application 2024 & 2032
- Figure 34: Middle East and Africa Injectable Drug Delivery Devices Industry Revenue (Million), by Country 2024 & 2032
- Figure 35: Middle East and Africa Injectable Drug Delivery Devices Industry Revenue Share (%), by Country 2024 & 2032
- Figure 36: South America Injectable Drug Delivery Devices Industry Revenue (Million), by Devices Type 2024 & 2032
- Figure 37: South America Injectable Drug Delivery Devices Industry Revenue Share (%), by Devices Type 2024 & 2032
- Figure 38: South America Injectable Drug Delivery Devices Industry Revenue (Million), by Therapeutic Application 2024 & 2032
- Figure 39: South America Injectable Drug Delivery Devices Industry Revenue Share (%), by Therapeutic Application 2024 & 2032
- Figure 40: South America Injectable Drug Delivery Devices Industry Revenue (Million), by Country 2024 & 2032
- Figure 41: South America Injectable Drug Delivery Devices Industry Revenue Share (%), by Country 2024 & 2032
List of Tables
- Table 1: Global Injectable Drug Delivery Devices Industry Revenue Million Forecast, by Region 2019 & 2032
- Table 2: Global Injectable Drug Delivery Devices Industry Revenue Million Forecast, by Devices Type 2019 & 2032
- Table 3: Global Injectable Drug Delivery Devices Industry Revenue Million Forecast, by Therapeutic Application 2019 & 2032
- Table 4: Global Injectable Drug Delivery Devices Industry Revenue Million Forecast, by Region 2019 & 2032
- Table 5: Global Injectable Drug Delivery Devices Industry Revenue Million Forecast, by Country 2019 & 2032
- Table 6: United States Injectable Drug Delivery Devices Industry Revenue (Million) Forecast, by Application 2019 & 2032
- Table 7: Canada Injectable Drug Delivery Devices Industry Revenue (Million) Forecast, by Application 2019 & 2032
- Table 8: Mexico Injectable Drug Delivery Devices Industry Revenue (Million) Forecast, by Application 2019 & 2032
- Table 9: Global Injectable Drug Delivery Devices Industry Revenue Million Forecast, by Country 2019 & 2032
- Table 10: Germany Injectable Drug Delivery Devices Industry Revenue (Million) Forecast, by Application 2019 & 2032
- Table 11: United Kingdom Injectable Drug Delivery Devices Industry Revenue (Million) Forecast, by Application 2019 & 2032
- Table 12: France Injectable Drug Delivery Devices Industry Revenue (Million) Forecast, by Application 2019 & 2032
- Table 13: Italy Injectable Drug Delivery Devices Industry Revenue (Million) Forecast, by Application 2019 & 2032
- Table 14: Spain Injectable Drug Delivery Devices Industry Revenue (Million) Forecast, by Application 2019 & 2032
- Table 15: Rest of Europe Injectable Drug Delivery Devices Industry Revenue (Million) Forecast, by Application 2019 & 2032
- Table 16: Global Injectable Drug Delivery Devices Industry Revenue Million Forecast, by Country 2019 & 2032
- Table 17: China Injectable Drug Delivery Devices Industry Revenue (Million) Forecast, by Application 2019 & 2032
- Table 18: Japan Injectable Drug Delivery Devices Industry Revenue (Million) Forecast, by Application 2019 & 2032
- Table 19: India Injectable Drug Delivery Devices Industry Revenue (Million) Forecast, by Application 2019 & 2032
- Table 20: Australia Injectable Drug Delivery Devices Industry Revenue (Million) Forecast, by Application 2019 & 2032
- Table 21: South Korea Injectable Drug Delivery Devices Industry Revenue (Million) Forecast, by Application 2019 & 2032
- Table 22: Rest of Asia Pacific Injectable Drug Delivery Devices Industry Revenue (Million) Forecast, by Application 2019 & 2032
- Table 23: Global Injectable Drug Delivery Devices Industry Revenue Million Forecast, by Country 2019 & 2032
- Table 24: GCC Injectable Drug Delivery Devices Industry Revenue (Million) Forecast, by Application 2019 & 2032
- Table 25: South Africa Injectable Drug Delivery Devices Industry Revenue (Million) Forecast, by Application 2019 & 2032
- Table 26: Rest of Middle East and Africa Injectable Drug Delivery Devices Industry Revenue (Million) Forecast, by Application 2019 & 2032
- Table 27: Global Injectable Drug Delivery Devices Industry Revenue Million Forecast, by Country 2019 & 2032
- Table 28: Brazil Injectable Drug Delivery Devices Industry Revenue (Million) Forecast, by Application 2019 & 2032
- Table 29: Argentina Injectable Drug Delivery Devices Industry Revenue (Million) Forecast, by Application 2019 & 2032
- Table 30: Rest of South America Injectable Drug Delivery Devices Industry Revenue (Million) Forecast, by Application 2019 & 2032
- Table 31: Global Injectable Drug Delivery Devices Industry Revenue Million Forecast, by Devices Type 2019 & 2032
- Table 32: Global Injectable Drug Delivery Devices Industry Revenue Million Forecast, by Therapeutic Application 2019 & 2032
- Table 33: Global Injectable Drug Delivery Devices Industry Revenue Million Forecast, by Country 2019 & 2032
- Table 34: United States Injectable Drug Delivery Devices Industry Revenue (Million) Forecast, by Application 2019 & 2032
- Table 35: Canada Injectable Drug Delivery Devices Industry Revenue (Million) Forecast, by Application 2019 & 2032
- Table 36: Mexico Injectable Drug Delivery Devices Industry Revenue (Million) Forecast, by Application 2019 & 2032
- Table 37: Global Injectable Drug Delivery Devices Industry Revenue Million Forecast, by Devices Type 2019 & 2032
- Table 38: Global Injectable Drug Delivery Devices Industry Revenue Million Forecast, by Therapeutic Application 2019 & 2032
- Table 39: Global Injectable Drug Delivery Devices Industry Revenue Million Forecast, by Country 2019 & 2032
- Table 40: Germany Injectable Drug Delivery Devices Industry Revenue (Million) Forecast, by Application 2019 & 2032
- Table 41: United Kingdom Injectable Drug Delivery Devices Industry Revenue (Million) Forecast, by Application 2019 & 2032
- Table 42: France Injectable Drug Delivery Devices Industry Revenue (Million) Forecast, by Application 2019 & 2032
- Table 43: Italy Injectable Drug Delivery Devices Industry Revenue (Million) Forecast, by Application 2019 & 2032
- Table 44: Spain Injectable Drug Delivery Devices Industry Revenue (Million) Forecast, by Application 2019 & 2032
- Table 45: Rest of Europe Injectable Drug Delivery Devices Industry Revenue (Million) Forecast, by Application 2019 & 2032
- Table 46: Global Injectable Drug Delivery Devices Industry Revenue Million Forecast, by Devices Type 2019 & 2032
- Table 47: Global Injectable Drug Delivery Devices Industry Revenue Million Forecast, by Therapeutic Application 2019 & 2032
- Table 48: Global Injectable Drug Delivery Devices Industry Revenue Million Forecast, by Country 2019 & 2032
- Table 49: China Injectable Drug Delivery Devices Industry Revenue (Million) Forecast, by Application 2019 & 2032
- Table 50: Japan Injectable Drug Delivery Devices Industry Revenue (Million) Forecast, by Application 2019 & 2032
- Table 51: India Injectable Drug Delivery Devices Industry Revenue (Million) Forecast, by Application 2019 & 2032
- Table 52: Australia Injectable Drug Delivery Devices Industry Revenue (Million) Forecast, by Application 2019 & 2032
- Table 53: South Korea Injectable Drug Delivery Devices Industry Revenue (Million) Forecast, by Application 2019 & 2032
- Table 54: Rest of Asia Pacific Injectable Drug Delivery Devices Industry Revenue (Million) Forecast, by Application 2019 & 2032
- Table 55: Global Injectable Drug Delivery Devices Industry Revenue Million Forecast, by Devices Type 2019 & 2032
- Table 56: Global Injectable Drug Delivery Devices Industry Revenue Million Forecast, by Therapeutic Application 2019 & 2032
- Table 57: Global Injectable Drug Delivery Devices Industry Revenue Million Forecast, by Country 2019 & 2032
- Table 58: GCC Injectable Drug Delivery Devices Industry Revenue (Million) Forecast, by Application 2019 & 2032
- Table 59: South Africa Injectable Drug Delivery Devices Industry Revenue (Million) Forecast, by Application 2019 & 2032
- Table 60: Rest of Middle East and Africa Injectable Drug Delivery Devices Industry Revenue (Million) Forecast, by Application 2019 & 2032
- Table 61: Global Injectable Drug Delivery Devices Industry Revenue Million Forecast, by Devices Type 2019 & 2032
- Table 62: Global Injectable Drug Delivery Devices Industry Revenue Million Forecast, by Therapeutic Application 2019 & 2032
- Table 63: Global Injectable Drug Delivery Devices Industry Revenue Million Forecast, by Country 2019 & 2032
- Table 64: Brazil Injectable Drug Delivery Devices Industry Revenue (Million) Forecast, by Application 2019 & 2032
- Table 65: Argentina Injectable Drug Delivery Devices Industry Revenue (Million) Forecast, by Application 2019 & 2032
- Table 66: Rest of South America Injectable Drug Delivery Devices Industry Revenue (Million) Forecast, by Application 2019 & 2032
Frequently Asked Questions
1. What is the projected Compound Annual Growth Rate (CAGR) of the Injectable Drug Delivery Devices Industry?
The projected CAGR is approximately 7.14%.
2. Which companies are prominent players in the Injectable Drug Delivery Devices Industry?
Key companies in the market include Becton Dickinson and Company, West Pharmaceutical Services Inc, Schott AG, Novartis AG, Terumo Corporation, Eli Lilly and Company, F Hoffmann-La Roche Ltd*List Not Exhaustive, Teva Pharmaceutical Industries Ltd, Novo Nordisk A/S, Baxter International Inc, Gerresheimer AG, Pfizer Inc.
3. What are the main segments of the Injectable Drug Delivery Devices Industry?
The market segments include Devices Type, Therapeutic Application.
4. Can you provide details about the market size?
The market size is estimated to be USD 114.85 Million as of 2022.
5. What are some drivers contributing to market growth?
Increasing Burden of Chronic Diseases; Benefits and Convenience in Self Injectors; Growth of the Biologics Market Leading to Increased Demand for Injectors.
6. What are the notable trends driving market growth?
Prefilled Syringes Subsegment is Anticipated to Grow Significantly Over the Forecast Period.
7. Are there any restraints impacting market growth?
Injuries and Infections Caused by Needles; Increasing Use of Alternative Delivery Methods.
8. Can you provide examples of recent developments in the market?
November 2022: Medmix Drug Delivery (Haselmeier) and AARDEX Group collaborated by combining Haselmeiers D-Flex Logbook with AARDEX Group's Medication Adherence software and Hardware ecosystem to improve self-administration of injectable drugs in clinical trials in Germany.
9. What pricing options are available for accessing the report?
Pricing options include single-user, multi-user, and enterprise licenses priced at USD 4750, USD 5250, and USD 8750 respectively.
10. Is the market size provided in terms of value or volume?
The market size is provided in terms of value, measured in Million.
11. Are there any specific market keywords associated with the report?
Yes, the market keyword associated with the report is "Injectable Drug Delivery Devices Industry," which aids in identifying and referencing the specific market segment covered.
12. How do I determine which pricing option suits my needs best?
The pricing options vary based on user requirements and access needs. Individual users may opt for single-user licenses, while businesses requiring broader access may choose multi-user or enterprise licenses for cost-effective access to the report.
13. Are there any additional resources or data provided in the Injectable Drug Delivery Devices Industry report?
While the report offers comprehensive insights, it's advisable to review the specific contents or supplementary materials provided to ascertain if additional resources or data are available.
14. How can I stay updated on further developments or reports in the Injectable Drug Delivery Devices Industry?
To stay informed about further developments, trends, and reports in the Injectable Drug Delivery Devices Industry, consider subscribing to industry newsletters, following relevant companies and organizations, or regularly checking reputable industry news sources and publications.
Methodology
Step 1 - Identification of Relevant Samples Size from Population Database


Step 2 - Approaches for Defining Global Market Size (Value, Volume* & Price*)

Note*: In applicable scenarios
Step 3 - Data Sources
Primary Research
- Web Analytics
- Survey Reports
- Research Institute
- Latest Research Reports
- Opinion Leaders
Secondary Research
- Annual Reports
- White Paper
- Latest Press Release
- Industry Association
- Paid Database
- Investor Presentations

Step 4 - Data Triangulation
Involves using different sources of information in order to increase the validity of a study
These sources are likely to be stakeholders in a program - participants, other researchers, program staff, other community members, and so on.
Then we put all data in single framework & apply various statistical tools to find out the dynamic on the market.
During the analysis stage, feedback from the stakeholder groups would be compared to determine areas of agreement as well as areas of divergence


