

Key Insights
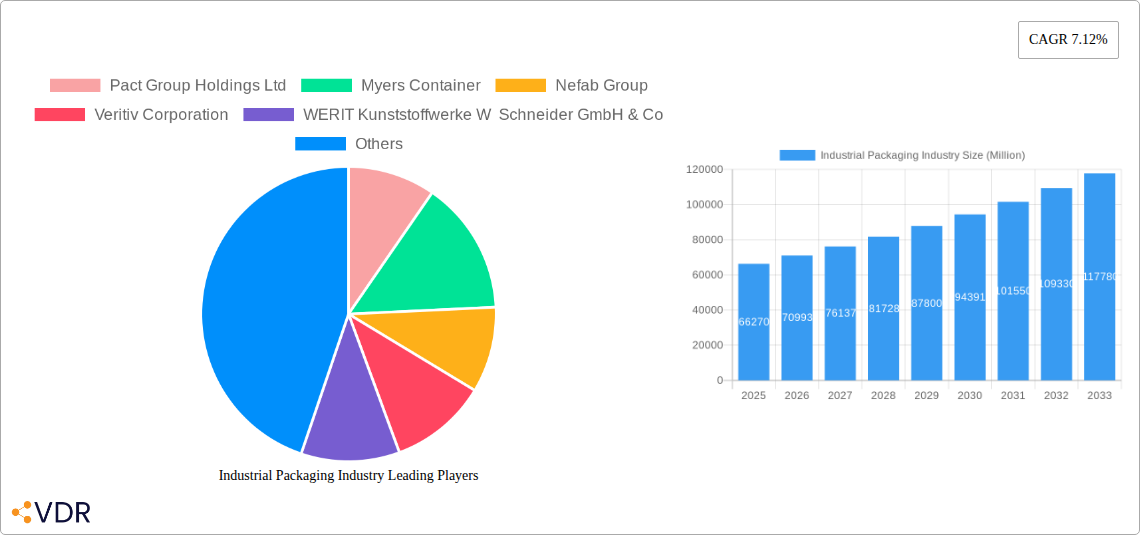
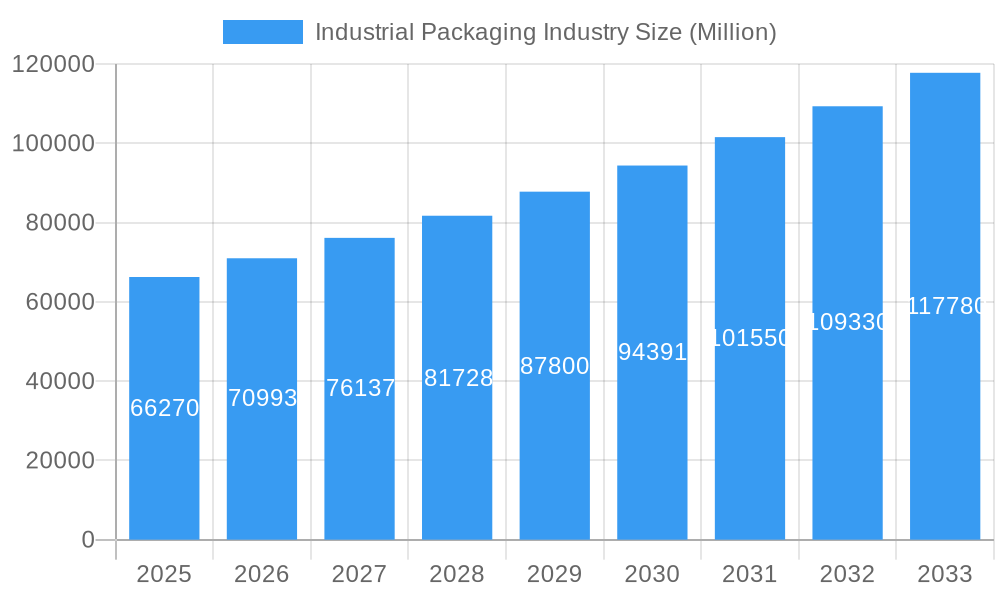
The industrial packaging market, valued at $66.27 billion in 2025, is projected to experience robust growth, driven by a Compound Annual Growth Rate (CAGR) of 7.12% from 2025 to 2033. This expansion is fueled by several key factors. The burgeoning e-commerce sector necessitates efficient and protective packaging solutions for a wide array of goods, significantly increasing demand. Simultaneously, the rise of automation and technological advancements in packaging materials and processes are improving efficiency and reducing waste, further boosting market growth. Increased focus on sustainability and eco-friendly packaging options is shaping industry trends, with companies increasingly adopting recycled and biodegradable materials. Regulations aimed at reducing environmental impact are also driving innovation in sustainable packaging design and production. The diverse end-user industries, including automotive, food and beverage, chemicals, and pharmaceuticals, contribute significantly to the market's size and growth potential. Competition within the market is intense, with established players like Greif Inc, Amcor PLC, and Smurfit Kappa Group PLC vying for market share alongside smaller, specialized businesses. Regional variations exist, with North America and Europe currently holding substantial market shares, while Asia-Pacific is poised for significant growth due to rapid industrialization and economic expansion.
Industrial Packaging Industry Market Size (In Billion)
The projected growth trajectory indicates a substantial market expansion over the forecast period. The market segmentation by product type (IBCs, sacks, drums, etc.) and end-user industry allows for targeted strategies by companies. Continued innovation in materials science, focusing on lightweight, durable, and sustainable options, will be critical for long-term market success. Furthermore, companies that effectively integrate advanced technologies like automation and data analytics into their operations will be better positioned to meet the evolving demands of the market and enhance supply chain efficiency. The industry's ongoing focus on sustainability, combined with evolving regulatory landscapes, will continue to shape both product development and operational practices within the industrial packaging sector.
Industrial Packaging Industry Company Market Share
Industrial Packaging Industry Market Report: 2019-2033
This comprehensive report provides a detailed analysis of the Industrial Packaging Market, encompassing market size, growth trends, competitive landscape, and future outlook from 2019 to 2033. With a focus on key segments – Intermediate Bulk Containers (IBCs), Sacks, Drums, Pails, and other products – across diverse end-user industries like Automotive, Food & Beverage, Chemicals & Pharmaceuticals, Oil & Gas, and Construction, this report is an essential resource for industry professionals, investors, and strategic decision-makers. The report includes detailed profiles of leading players such as Amcor PLC, DS Smith PLC, and Greif Inc., offering valuable insights into their market strategies and competitive dynamics. The base year is 2025, with a forecast period spanning 2025-2033 and historical data covering 2019-2024. Market values are presented in million units.
Industrial Packaging Industry Market Dynamics & Structure
The industrial packaging market is characterized by moderate concentration, with a few large multinational companies dominating alongside numerous smaller regional players. Technological innovation, driven by sustainability concerns and evolving end-user needs, is a key driver. Stringent regulatory frameworks concerning material recyclability and waste management significantly impact production methods and material choices. Competitive pressures from substitute materials like biodegradable polymers are creating challenges. End-user demographics, particularly growth in emerging economies, influence demand. The market exhibits consistent M&A activity, driven by consolidation and expansion strategies.
- Market Concentration: Highly fragmented, with top 5 players holding approximately xx% market share in 2024.
- Technological Innovation: Focus on lightweighting, sustainable materials (e.g., recycled content, biodegradable options), and smart packaging solutions.
- Regulatory Landscape: Increasingly stringent regulations on hazardous material packaging and waste management in various regions.
- Competitive Substitutes: Growth of biodegradable and compostable packaging options poses a competitive threat.
- M&A Activity: xx deals recorded between 2019-2024, indicating consolidation trends within the industry. Average deal value: xx million.
Industrial Packaging Industry Growth Trends & Insights
The global industrial packaging market witnessed robust growth throughout the historical period (2019-2024), primarily fueled by the expansion of end-use industries like e-commerce and food and beverage. This growth trajectory is projected to continue during the forecast period (2025-2033), albeit at a slightly moderated pace. Technological disruptions, particularly advancements in automation and sustainable packaging materials, are reshaping the market landscape. Shifting consumer preferences towards eco-friendly packaging solutions are influencing product development and adoption rates. The market exhibited a CAGR of xx% between 2019 and 2024 and is projected to maintain a CAGR of xx% from 2025 to 2033. Market penetration for sustainable packaging options is currently at xx% and is projected to rise to xx% by 2033.
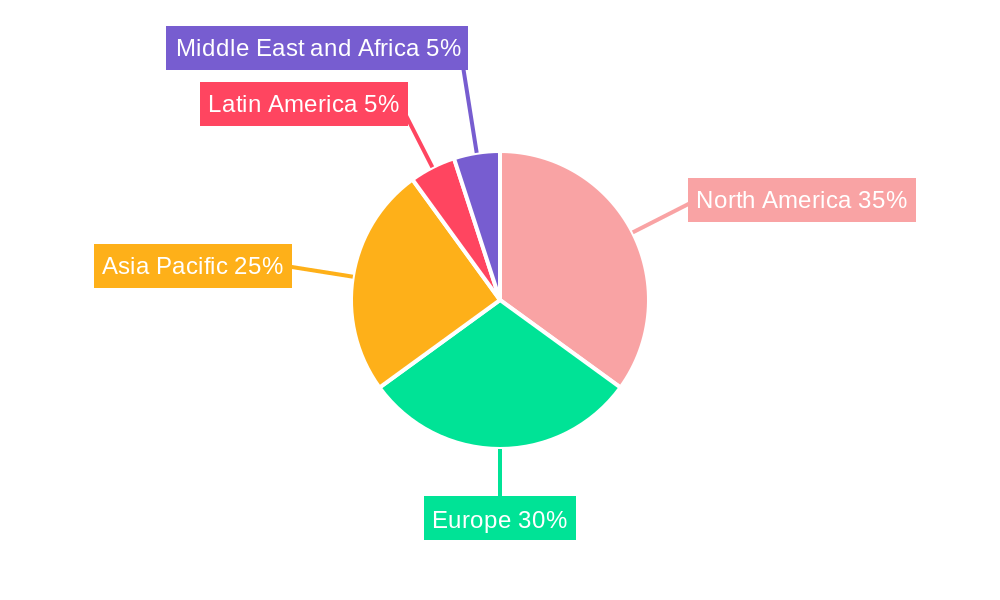
Dominant Regions, Countries, or Segments in Industrial Packaging Industry
North America and Europe currently dominate the industrial packaging market, driven by high industrial output and stringent regulatory environments. However, Asia-Pacific exhibits significant growth potential, fueled by rapid industrialization and expanding e-commerce. Within product segments, IBCs and drums represent the largest shares due to their extensive use in the chemical and pharmaceutical sectors. The Food and Beverage sector exhibits high demand for specialized packaging to preserve product quality and enhance shelf life.
- Leading Regions: North America (xx% market share in 2024), Europe (xx%), Asia-Pacific (xx%).
- Key Drivers (Asia-Pacific): Rapid industrialization, expanding e-commerce, favorable government policies promoting manufacturing.
- Key Drivers (North America/Europe): Stringent environmental regulations, advancements in sustainable packaging technology, high consumer awareness.
- Dominant Product Segments: IBCs (xx% of total market volume in 2024), Drums (xx%), Sacks (xx%).
- Dominant End-user Industries: Chemicals and Pharmaceuticals (xx% of total market demand in 2024), Food & Beverage (xx%), Automotive (xx%).
Industrial Packaging Industry Product Landscape
Product innovation within the industrial packaging sector is largely focused on enhancing sustainability, improving performance, and optimizing supply chain efficiency. Lightweight designs using recycled and renewable materials are gaining prominence. Smart packaging features, such as integrated sensors for real-time tracking and condition monitoring, are increasingly being integrated to improve product safety and traceability. The focus is on increasing efficiency and reducing costs throughout the entire supply chain.
Key Drivers, Barriers & Challenges in Industrial Packaging Industry
Key Drivers:
- Growing demand from end-user industries (e.g., e-commerce, food and beverage).
- Advancements in sustainable and lightweight packaging materials.
- Stringent regulatory frameworks driving adoption of eco-friendly solutions.
Key Challenges:
- Fluctuations in raw material prices impacting production costs.
- Supply chain disruptions affecting timely delivery of packaging solutions.
- Intense competition from both established and emerging players. Market share battles are intensifying among major players, impacting margins.
Emerging Opportunities in Industrial Packaging Industry
- Expanding demand for customized and specialized packaging solutions.
- Growing adoption of smart packaging incorporating sensors and tracking technologies.
- Opportunities in emerging markets with expanding industrial sectors.
- Increasing focus on sustainable and circular economy models creating avenues for innovative packaging solutions.
Growth Accelerators in the Industrial Packaging Industry Industry
Long-term growth is projected to be driven by continuous innovation in packaging materials, automation of production processes, and strategic partnerships across the supply chain. Expansion into emerging markets with strong growth potential, especially in Asia-Pacific, presents significant opportunities. The shift towards a circular economy, focusing on reusable and recyclable packaging, will also stimulate market growth.
Key Players Shaping the Industrial Packaging Industry Market
- Pact Group Holdings Ltd
- Myers Container
- Nefab Group
- Veritiv Corporation
- WERIT Kunststoffwerke W Schneider GmbH & Co
- Schutz GmbH & Co KGaA
- Greif Inc
- Visy
- Global-Pak Inc
- DS Smith PLC
- Amcor PLC
- Mondi PLC
- International Paper Company
- Smurfit Kappa Group PLC
- Snyder Industries LLC
- Packaging Corporation of America
- Berry Global Inc
- Mauser Packaging Solutions
- Brambles Ltd (CHEP)
- Tank Holding Corp
Notable Milestones in Industrial Packaging Industry Sector
- April 2023: Mauser Packaging Solutions expands its product range in Singapore with new equipment for producing plastic drums, enhancing access to the Infinity Series.
- March 2024: Greif Inc. and CDF Corporation launch a redesigned GCUBE IBC Flex for transporting sensitive fluids in sterile environments, emphasizing sustainable solutions.
In-Depth Industrial Packaging Industry Market Outlook
The industrial packaging market is poised for continued growth, driven by factors such as increased industrial production, rising e-commerce activity, and the growing adoption of sustainable packaging solutions. Strategic partnerships, technological advancements, and market expansion into developing economies will further fuel this growth. Companies that prioritize innovation, sustainability, and efficient supply chain management are well-positioned to capture significant market share in the years to come.
Industrial Packaging Industry Segmentation
-
1. Product
- 1.1. Intermediate Bulk Containers (IBCs)
- 1.2. Sacks
- 1.3. Drums
- 1.4. Pails
- 1.5. Other Products
-
2. End-user Industry
- 2.1. Automotive
- 2.2. Food and Beverage
- 2.3. Chemicals and Pharmaceuticals
- 2.4. Oil and Gas and Petrochemicals
- 2.5. Building and Construction
- 2.6. Other End-user Industries
Industrial Packaging Industry Segmentation By Geography
-
1. North America
- 1.1. United States
- 1.2. Canada
-
2. Europe
- 2.1. Germany
- 2.2. United Kingdom
- 2.3. France
- 2.4. Russia
-
3. Asia Pacific
- 3.1. China
- 3.2. Japan
- 3.3. India
- 3.4. Australia and New Zealand
- 4. Latin America
- 5. Middle East and Africa
Industrial Packaging Industry Regional Market Share
Geographic Coverage of Industrial Packaging Industry
Industrial Packaging Industry REPORT HIGHLIGHTS
| Aspects | Details |
|---|---|
| Study Period | 2020-2034 |
| Base Year | 2025 |
| Estimated Year | 2026 |
| Forecast Period | 2026-2034 |
| Historical Period | 2020-2025 |
| Growth Rate | CAGR of 7.12% from 2020-2034 |
| Segmentation |
|
Table of Contents
- 1. Introduction
- 1.1. Research Scope
- 1.2. Market Segmentation
- 1.3. Research Objective
- 1.4. Definitions and Assumptions
- 2. Executive Summary
- 2.1. Market Snapshot
- 3. Market Dynamics
- 3.1. Market Drivers
- 3.2. Market Restrains
- 3.3. Market Trends
- 3.4. Market Opportunities
- 4. Market Factor Analysis
- 4.1. Porters Five Forces
- 4.1.1. Bargaining Power of Suppliers
- 4.1.2. Bargaining Power of Buyers
- 4.1.3. Threat of New Entrants
- 4.1.4. Threat of Substitutes
- 4.1.5. Competitive Rivalry
- 4.2. PESTEL analysis
- 4.3. BCG Analysis
- 4.3.1. Stars (High Growth, High Market Share)
- 4.3.2. Cash Cows (Low Growth, High Market Share)
- 4.3.3. Question Mark (High Growth, Low Market Share)
- 4.3.4. Dogs (Low Growth, Low Market Share)
- 4.4. Ansoff Matrix Analysis
- 4.5. Supply Chain Analysis
- 4.6. Regulatory Landscape
- 4.7. Current Market Potential and Opportunity Assessment (TAM–SAM–SOM Framework)
- 4.8. VDR Analyst Note
- 4.1. Porters Five Forces
- 5. Market Analysis, Insights and Forecast 2021-2033
- 5.1. Market Analysis, Insights and Forecast - by Product
- 5.1.1. Intermediate Bulk Containers (IBCs)
- 5.1.2. Sacks
- 5.1.3. Drums
- 5.1.4. Pails
- 5.1.5. Other Products
- 5.2. Market Analysis, Insights and Forecast - by End-user Industry
- 5.2.1. Automotive
- 5.2.2. Food and Beverage
- 5.2.3. Chemicals and Pharmaceuticals
- 5.2.4. Oil and Gas and Petrochemicals
- 5.2.5. Building and Construction
- 5.2.6. Other End-user Industries
- 5.3. Market Analysis, Insights and Forecast - by Region
- 5.3.1. North America
- 5.3.2. Europe
- 5.3.3. Asia Pacific
- 5.3.4. Latin America
- 5.3.5. Middle East and Africa
- 5.1. Market Analysis, Insights and Forecast - by Product
- 6. Global Industrial Packaging Industry Analysis, Insights and Forecast, 2021-2033
- 6.1. Market Analysis, Insights and Forecast - by Product
- 6.1.1. Intermediate Bulk Containers (IBCs)
- 6.1.2. Sacks
- 6.1.3. Drums
- 6.1.4. Pails
- 6.1.5. Other Products
- 6.2. Market Analysis, Insights and Forecast - by End-user Industry
- 6.2.1. Automotive
- 6.2.2. Food and Beverage
- 6.2.3. Chemicals and Pharmaceuticals
- 6.2.4. Oil and Gas and Petrochemicals
- 6.2.5. Building and Construction
- 6.2.6. Other End-user Industries
- 6.1. Market Analysis, Insights and Forecast - by Product
- 7. North America Industrial Packaging Industry Analysis, Insights and Forecast, 2021-2033
- 7.1. Market Analysis, Insights and Forecast - by Product
- 7.1.1. Intermediate Bulk Containers (IBCs)
- 7.1.2. Sacks
- 7.1.3. Drums
- 7.1.4. Pails
- 7.1.5. Other Products
- 7.2. Market Analysis, Insights and Forecast - by End-user Industry
- 7.2.1. Automotive
- 7.2.2. Food and Beverage
- 7.2.3. Chemicals and Pharmaceuticals
- 7.2.4. Oil and Gas and Petrochemicals
- 7.2.5. Building and Construction
- 7.2.6. Other End-user Industries
- 7.1. Market Analysis, Insights and Forecast - by Product
- 8. Europe Industrial Packaging Industry Analysis, Insights and Forecast, 2021-2033
- 8.1. Market Analysis, Insights and Forecast - by Product
- 8.1.1. Intermediate Bulk Containers (IBCs)
- 8.1.2. Sacks
- 8.1.3. Drums
- 8.1.4. Pails
- 8.1.5. Other Products
- 8.2. Market Analysis, Insights and Forecast - by End-user Industry
- 8.2.1. Automotive
- 8.2.2. Food and Beverage
- 8.2.3. Chemicals and Pharmaceuticals
- 8.2.4. Oil and Gas and Petrochemicals
- 8.2.5. Building and Construction
- 8.2.6. Other End-user Industries
- 8.1. Market Analysis, Insights and Forecast - by Product
- 9. Asia Pacific Industrial Packaging Industry Analysis, Insights and Forecast, 2021-2033
- 9.1. Market Analysis, Insights and Forecast - by Product
- 9.1.1. Intermediate Bulk Containers (IBCs)
- 9.1.2. Sacks
- 9.1.3. Drums
- 9.1.4. Pails
- 9.1.5. Other Products
- 9.2. Market Analysis, Insights and Forecast - by End-user Industry
- 9.2.1. Automotive
- 9.2.2. Food and Beverage
- 9.2.3. Chemicals and Pharmaceuticals
- 9.2.4. Oil and Gas and Petrochemicals
- 9.2.5. Building and Construction
- 9.2.6. Other End-user Industries
- 9.1. Market Analysis, Insights and Forecast - by Product
- 10. Latin America Industrial Packaging Industry Analysis, Insights and Forecast, 2021-2033
- 10.1. Market Analysis, Insights and Forecast - by Product
- 10.1.1. Intermediate Bulk Containers (IBCs)
- 10.1.2. Sacks
- 10.1.3. Drums
- 10.1.4. Pails
- 10.1.5. Other Products
- 10.2. Market Analysis, Insights and Forecast - by End-user Industry
- 10.2.1. Automotive
- 10.2.2. Food and Beverage
- 10.2.3. Chemicals and Pharmaceuticals
- 10.2.4. Oil and Gas and Petrochemicals
- 10.2.5. Building and Construction
- 10.2.6. Other End-user Industries
- 10.1. Market Analysis, Insights and Forecast - by Product
- 11. Middle East and Africa Industrial Packaging Industry Analysis, Insights and Forecast, 2021-2033
- 11.1. Market Analysis, Insights and Forecast - by Product
- 11.1.1. Intermediate Bulk Containers (IBCs)
- 11.1.2. Sacks
- 11.1.3. Drums
- 11.1.4. Pails
- 11.1.5. Other Products
- 11.2. Market Analysis, Insights and Forecast - by End-user Industry
- 11.2.1. Automotive
- 11.2.2. Food and Beverage
- 11.2.3. Chemicals and Pharmaceuticals
- 11.2.4. Oil and Gas and Petrochemicals
- 11.2.5. Building and Construction
- 11.2.6. Other End-user Industries
- 11.1. Market Analysis, Insights and Forecast - by Product
- 12. Competitive Analysis
- 12.1. Company Profiles
- 12.1.1 Pact Group Holdings Ltd
- 12.1.1.1. Company Overview
- 12.1.1.2. Products
- 12.1.1.3. Company Financials
- 12.1.1.4. SWOT Analysis
- 12.1.2 Myers Container
- 12.1.2.1. Company Overview
- 12.1.2.2. Products
- 12.1.2.3. Company Financials
- 12.1.2.4. SWOT Analysis
- 12.1.3 Nefab Group
- 12.1.3.1. Company Overview
- 12.1.3.2. Products
- 12.1.3.3. Company Financials
- 12.1.3.4. SWOT Analysis
- 12.1.4 Veritiv Corporation
- 12.1.4.1. Company Overview
- 12.1.4.2. Products
- 12.1.4.3. Company Financials
- 12.1.4.4. SWOT Analysis
- 12.1.5 WERIT Kunststoffwerke W Schneider GmbH & Co
- 12.1.5.1. Company Overview
- 12.1.5.2. Products
- 12.1.5.3. Company Financials
- 12.1.5.4. SWOT Analysis
- 12.1.6 Schutz GmbH & Co KGaA
- 12.1.6.1. Company Overview
- 12.1.6.2. Products
- 12.1.6.3. Company Financials
- 12.1.6.4. SWOT Analysis
- 12.1.7 Greif Inc
- 12.1.7.1. Company Overview
- 12.1.7.2. Products
- 12.1.7.3. Company Financials
- 12.1.7.4. SWOT Analysis
- 12.1.8 Visy
- 12.1.8.1. Company Overview
- 12.1.8.2. Products
- 12.1.8.3. Company Financials
- 12.1.8.4. SWOT Analysis
- 12.1.9 Global-Pak Inc
- 12.1.9.1. Company Overview
- 12.1.9.2. Products
- 12.1.9.3. Company Financials
- 12.1.9.4. SWOT Analysis
- 12.1.10 DS Smith PLC
- 12.1.10.1. Company Overview
- 12.1.10.2. Products
- 12.1.10.3. Company Financials
- 12.1.10.4. SWOT Analysis
- 12.1.11 Amcor PLC
- 12.1.11.1. Company Overview
- 12.1.11.2. Products
- 12.1.11.3. Company Financials
- 12.1.11.4. SWOT Analysis
- 12.1.12 Mondi PLC
- 12.1.12.1. Company Overview
- 12.1.12.2. Products
- 12.1.12.3. Company Financials
- 12.1.12.4. SWOT Analysis
- 12.1.13 International Paper Company
- 12.1.13.1. Company Overview
- 12.1.13.2. Products
- 12.1.13.3. Company Financials
- 12.1.13.4. SWOT Analysis
- 12.1.14 Smurfit Kappa Group PLC
- 12.1.14.1. Company Overview
- 12.1.14.2. Products
- 12.1.14.3. Company Financials
- 12.1.14.4. SWOT Analysis
- 12.1.15 Snyder Industries LLC
- 12.1.15.1. Company Overview
- 12.1.15.2. Products
- 12.1.15.3. Company Financials
- 12.1.15.4. SWOT Analysis
- 12.1.16 Packaging Corporation of America
- 12.1.16.1. Company Overview
- 12.1.16.2. Products
- 12.1.16.3. Company Financials
- 12.1.16.4. SWOT Analysis
- 12.1.17 Berry Global Inc
- 12.1.17.1. Company Overview
- 12.1.17.2. Products
- 12.1.17.3. Company Financials
- 12.1.17.4. SWOT Analysis
- 12.1.18 Mauser Packaging Solutions
- 12.1.18.1. Company Overview
- 12.1.18.2. Products
- 12.1.18.3. Company Financials
- 12.1.18.4. SWOT Analysis
- 12.1.19 Brambles Ltd (CHEP)
- 12.1.19.1. Company Overview
- 12.1.19.2. Products
- 12.1.19.3. Company Financials
- 12.1.19.4. SWOT Analysis
- 12.1.20 Tank Holding Corp
- 12.1.20.1. Company Overview
- 12.1.20.2. Products
- 12.1.20.3. Company Financials
- 12.1.20.4. SWOT Analysis
- 12.1.1 Pact Group Holdings Ltd
- 12.2. Market Entropy
- 12.2.1 Company's Key Areas Served
- 12.2.2 Recent Developments
- 12.3. Company Market Share Analysis 2025
- 12.3.1 Top 5 Companies Market Share Analysis
- 12.3.2 Top 3 Companies Market Share Analysis
- 12.4. List of Potential Customers
- 13. Research Methodology
List of Figures
- Figure 1: Global Industrial Packaging Industry Revenue Breakdown (Million, %) by Region 2025 & 2033
- Figure 2: North America Industrial Packaging Industry Revenue (Million), by Product 2025 & 2033
- Figure 3: North America Industrial Packaging Industry Revenue Share (%), by Product 2025 & 2033
- Figure 4: North America Industrial Packaging Industry Revenue (Million), by End-user Industry 2025 & 2033
- Figure 5: North America Industrial Packaging Industry Revenue Share (%), by End-user Industry 2025 & 2033
- Figure 6: North America Industrial Packaging Industry Revenue (Million), by Country 2025 & 2033
- Figure 7: North America Industrial Packaging Industry Revenue Share (%), by Country 2025 & 2033
- Figure 8: Europe Industrial Packaging Industry Revenue (Million), by Product 2025 & 2033
- Figure 9: Europe Industrial Packaging Industry Revenue Share (%), by Product 2025 & 2033
- Figure 10: Europe Industrial Packaging Industry Revenue (Million), by End-user Industry 2025 & 2033
- Figure 11: Europe Industrial Packaging Industry Revenue Share (%), by End-user Industry 2025 & 2033
- Figure 12: Europe Industrial Packaging Industry Revenue (Million), by Country 2025 & 2033
- Figure 13: Europe Industrial Packaging Industry Revenue Share (%), by Country 2025 & 2033
- Figure 14: Asia Pacific Industrial Packaging Industry Revenue (Million), by Product 2025 & 2033
- Figure 15: Asia Pacific Industrial Packaging Industry Revenue Share (%), by Product 2025 & 2033
- Figure 16: Asia Pacific Industrial Packaging Industry Revenue (Million), by End-user Industry 2025 & 2033
- Figure 17: Asia Pacific Industrial Packaging Industry Revenue Share (%), by End-user Industry 2025 & 2033
- Figure 18: Asia Pacific Industrial Packaging Industry Revenue (Million), by Country 2025 & 2033
- Figure 19: Asia Pacific Industrial Packaging Industry Revenue Share (%), by Country 2025 & 2033
- Figure 20: Latin America Industrial Packaging Industry Revenue (Million), by Product 2025 & 2033
- Figure 21: Latin America Industrial Packaging Industry Revenue Share (%), by Product 2025 & 2033
- Figure 22: Latin America Industrial Packaging Industry Revenue (Million), by End-user Industry 2025 & 2033
- Figure 23: Latin America Industrial Packaging Industry Revenue Share (%), by End-user Industry 2025 & 2033
- Figure 24: Latin America Industrial Packaging Industry Revenue (Million), by Country 2025 & 2033
- Figure 25: Latin America Industrial Packaging Industry Revenue Share (%), by Country 2025 & 2033
- Figure 26: Middle East and Africa Industrial Packaging Industry Revenue (Million), by Product 2025 & 2033
- Figure 27: Middle East and Africa Industrial Packaging Industry Revenue Share (%), by Product 2025 & 2033
- Figure 28: Middle East and Africa Industrial Packaging Industry Revenue (Million), by End-user Industry 2025 & 2033
- Figure 29: Middle East and Africa Industrial Packaging Industry Revenue Share (%), by End-user Industry 2025 & 2033
- Figure 30: Middle East and Africa Industrial Packaging Industry Revenue (Million), by Country 2025 & 2033
- Figure 31: Middle East and Africa Industrial Packaging Industry Revenue Share (%), by Country 2025 & 2033
List of Tables
- Table 1: Global Industrial Packaging Industry Revenue Million Forecast, by Product 2020 & 2033
- Table 2: Global Industrial Packaging Industry Revenue Million Forecast, by End-user Industry 2020 & 2033
- Table 3: Global Industrial Packaging Industry Revenue Million Forecast, by Region 2020 & 2033
- Table 4: Global Industrial Packaging Industry Revenue Million Forecast, by Product 2020 & 2033
- Table 5: Global Industrial Packaging Industry Revenue Million Forecast, by End-user Industry 2020 & 2033
- Table 6: Global Industrial Packaging Industry Revenue Million Forecast, by Country 2020 & 2033
- Table 7: United States Industrial Packaging Industry Revenue (Million) Forecast, by Application 2020 & 2033
- Table 8: Canada Industrial Packaging Industry Revenue (Million) Forecast, by Application 2020 & 2033
- Table 9: Global Industrial Packaging Industry Revenue Million Forecast, by Product 2020 & 2033
- Table 10: Global Industrial Packaging Industry Revenue Million Forecast, by End-user Industry 2020 & 2033
- Table 11: Global Industrial Packaging Industry Revenue Million Forecast, by Country 2020 & 2033
- Table 12: Germany Industrial Packaging Industry Revenue (Million) Forecast, by Application 2020 & 2033
- Table 13: United Kingdom Industrial Packaging Industry Revenue (Million) Forecast, by Application 2020 & 2033
- Table 14: France Industrial Packaging Industry Revenue (Million) Forecast, by Application 2020 & 2033
- Table 15: Russia Industrial Packaging Industry Revenue (Million) Forecast, by Application 2020 & 2033
- Table 16: Global Industrial Packaging Industry Revenue Million Forecast, by Product 2020 & 2033
- Table 17: Global Industrial Packaging Industry Revenue Million Forecast, by End-user Industry 2020 & 2033
- Table 18: Global Industrial Packaging Industry Revenue Million Forecast, by Country 2020 & 2033
- Table 19: China Industrial Packaging Industry Revenue (Million) Forecast, by Application 2020 & 2033
- Table 20: Japan Industrial Packaging Industry Revenue (Million) Forecast, by Application 2020 & 2033
- Table 21: India Industrial Packaging Industry Revenue (Million) Forecast, by Application 2020 & 2033
- Table 22: Australia and New Zealand Industrial Packaging Industry Revenue (Million) Forecast, by Application 2020 & 2033
- Table 23: Global Industrial Packaging Industry Revenue Million Forecast, by Product 2020 & 2033
- Table 24: Global Industrial Packaging Industry Revenue Million Forecast, by End-user Industry 2020 & 2033
- Table 25: Global Industrial Packaging Industry Revenue Million Forecast, by Country 2020 & 2033
- Table 26: Global Industrial Packaging Industry Revenue Million Forecast, by Product 2020 & 2033
- Table 27: Global Industrial Packaging Industry Revenue Million Forecast, by End-user Industry 2020 & 2033
- Table 28: Global Industrial Packaging Industry Revenue Million Forecast, by Country 2020 & 2033
Frequently Asked Questions
1. What is the projected Compound Annual Growth Rate (CAGR) of the Industrial Packaging Industry?
The projected CAGR is approximately 7.12%.
2. Which companies are prominent players in the Industrial Packaging Industry?
Key companies in the market include Pact Group Holdings Ltd, Myers Container, Nefab Group, Veritiv Corporation, WERIT Kunststoffwerke W Schneider GmbH & Co, Schutz GmbH & Co KGaA, Greif Inc, Visy, Global-Pak Inc, DS Smith PLC, Amcor PLC, Mondi PLC, International Paper Company, Smurfit Kappa Group PLC, Snyder Industries LLC, Packaging Corporation of America, Berry Global Inc, Mauser Packaging Solutions, Brambles Ltd (CHEP), Tank Holding Corp.
3. What are the main segments of the Industrial Packaging Industry?
The market segments include Product, End-user Industry.
4. Can you provide details about the market size?
The market size is estimated to be USD 66.27 Million as of 2022.
5. What are some drivers contributing to market growth?
Emergence of Sustainable and Recyclable Packaging Materials; Increasing Utilization of the Shipping Containers.
6. What are the notable trends driving market growth?
Food and Beverages Expected to Drive the Market.
7. Are there any restraints impacting market growth?
Dynamic Changes in Regulatory Standards Due to Increasing Environmental Concerns.
8. Can you provide examples of recent developments in the market?
March 2024: Greif Inc. collaborated with CDF Corporation to launch an innovative redesign of its GCUBE intermediate bulk container (IBC) Flex. It is specially designed to transport highly sensitive and fluid products in a sterile environment. The launch aligns with the firm's overall innovation and investment approach, where sustainable solutions improve customer experience and protect product quality and safety.
9. What pricing options are available for accessing the report?
Pricing options include single-user, multi-user, and enterprise licenses priced at USD 4750, USD 5250, and USD 8750 respectively.
10. Is the market size provided in terms of value or volume?
The market size is provided in terms of value, measured in Million.
11. Are there any specific market keywords associated with the report?
Yes, the market keyword associated with the report is "Industrial Packaging Industry," which aids in identifying and referencing the specific market segment covered.
12. How do I determine which pricing option suits my needs best?
The pricing options vary based on user requirements and access needs. Individual users may opt for single-user licenses, while businesses requiring broader access may choose multi-user or enterprise licenses for cost-effective access to the report.
13. Are there any additional resources or data provided in the Industrial Packaging Industry report?
While the report offers comprehensive insights, it's advisable to review the specific contents or supplementary materials provided to ascertain if additional resources or data are available.
14. How can I stay updated on further developments or reports in the Industrial Packaging Industry?
To stay informed about further developments, trends, and reports in the Industrial Packaging Industry, consider subscribing to industry newsletters, following relevant companies and organizations, or regularly checking reputable industry news sources and publications.
Methodology
Step 1 - Identification of Relevant Samples Size from Population Database


Step 2 - Approaches for Defining Global Market Size (Value, Volume* & Price*)

Note*: In applicable scenarios
Step 3 - Data Sources
Primary Research
- Web Analytics
- Survey Reports
- Research Institute
- Latest Research Reports
- Opinion Leaders
Secondary Research
- Annual Reports
- White Paper
- Latest Press Release
- Industry Association
- Paid Database
- Investor Presentations

Step 4 - Data Triangulation
Involves using different sources of information in order to increase the validity of a study
These sources are likely to be stakeholders in a program - participants, other researchers, program staff, other community members, and so on.
Then we put all data in single framework & apply various statistical tools to find out the dynamic on the market.
During the analysis stage, feedback from the stakeholder groups would be compared to determine areas of agreement as well as areas of divergence