Strategic Insights for Industrial Gearbox Industry Market Growth

Industrial Gearbox Industry by Type (Worm Gearbox, Helical Gearbox, Bevel Helical Gearbox, Planetary Gearbox, Other Types), by Application (Power Industry, Steel Industry, Mines and Minerals Industry, Wastewater Treatment Industry, Manufacturing Industry, Other Applications), by North America (United States, Canada, Rest of North America), by Europe (Germany, France, United Kingdom, Rest of Europe), by Asia Pacific (China, India, Japan, South Korea, Rest of Asia Pacific), by South America (Brazil, Argentina, Rest of South America), by Middle East and Africa (Saudi Arabia, United Arab Emirates, South Africa, Rest of Middle East and Africa) Forecast 2025-2033

Jun 29 2025
Base Year: 2024

234 Pages
Main Logo

Strategic Insights for Industrial Gearbox Industry Market Growth


Home
Industries
Energy & Power
sponsor image
sponsor image
sponsor image
sponsor image
sponsor image

Tailored for you

  • In-depth Analysis Tailored to Specified Regions or Segments
  • Company Profiles Customized to User Preferences
  • Comprehensive Insights Focused on Specific Segments or Regions
  • Customized Evaluation of Competitive Landscape to Meet Your Needs
  • Tailored Customization to Address Other Specific Requirements
Ask for customization


Key Insights

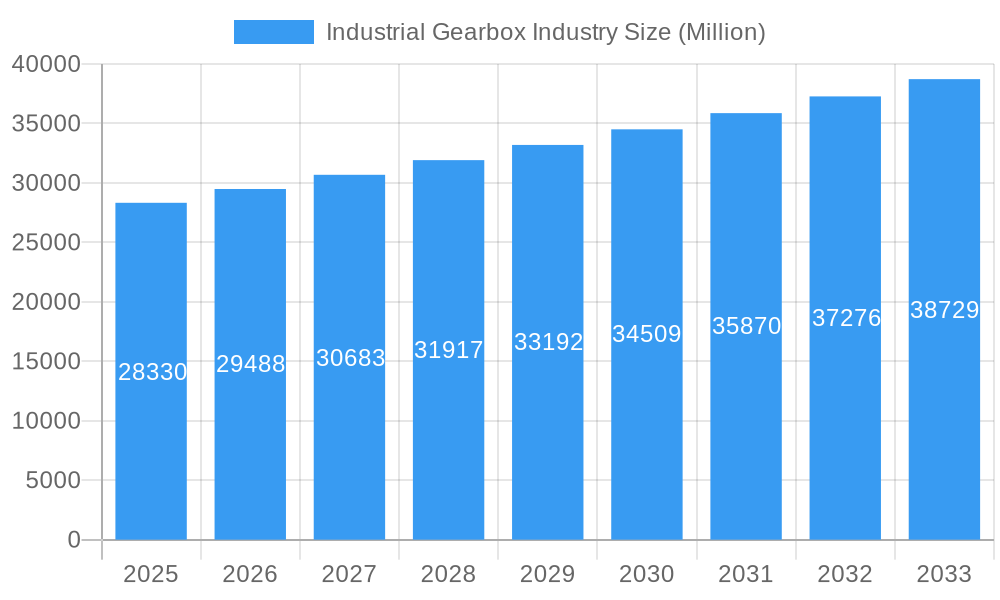
The global industrial gearbox market, valued at $28.33 billion in 2025, is projected to experience robust growth, driven by a Compound Annual Growth Rate (CAGR) of 4.20% from 2025 to 2033. This expansion is fueled by several key factors. The increasing automation across various industries, particularly manufacturing, power generation, and mining, necessitates the use of sophisticated gearboxes for efficient power transmission. Furthermore, the growing demand for energy-efficient solutions is driving the adoption of advanced gearbox technologies like planetary gearboxes and helical gearboxes, known for their high efficiency and durability. Government initiatives promoting industrial modernization and infrastructure development in emerging economies further contribute to market growth. The market is segmented by type (worm, helical, bevel helical, planetary, and others) and application (power, steel, mining, wastewater treatment, manufacturing, and others). While the dominance of established players like Flender, Sew-Eurodrive, and Bosch Rexroth is notable, the emergence of regional players presents opportunities for market diversification. However, challenges such as fluctuating raw material prices and intense competition among manufacturers could potentially moderate growth. The North American and European markets currently hold significant shares, but the Asia-Pacific region, particularly China and India, is poised for substantial growth due to rapid industrialization and infrastructure development.
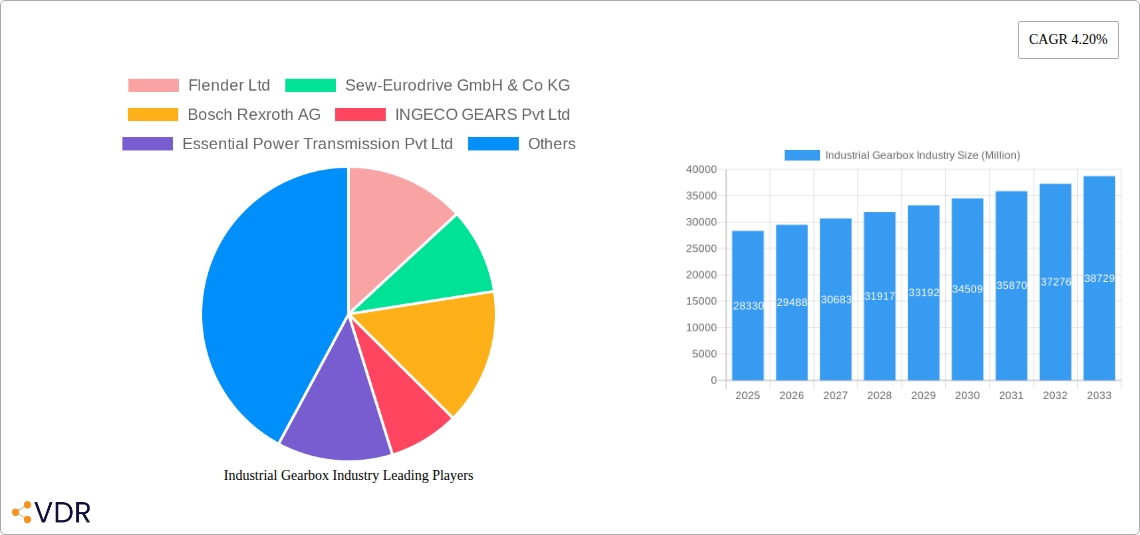
The forecast period (2025-2033) suggests a continued upward trajectory for the industrial gearbox market. The projected CAGR indicates a steady increase in market value, with specific segments like planetary gearboxes anticipated to experience faster growth due to their superior performance characteristics. The manufacturing industry will remain a key driver, alongside the growing adoption of gearboxes in renewable energy applications. Companies are increasingly focusing on innovation, developing energy-efficient and durable gearboxes, and investing in research and development to stay ahead of the competition. Geographical diversification and strategic partnerships will be crucial for companies seeking to expand their market reach and capitalize on growth opportunities in emerging markets. Effective supply chain management and overcoming challenges related to raw material costs and global economic fluctuations will be essential for sustained growth in the industrial gearbox market.

Industrial Gearbox Industry Research Report - Market Size, Growth & Forecast

Industrial Gearbox Industry Market Report: 2019-2033

This comprehensive report provides a detailed analysis of the global industrial gearbox market, encompassing market dynamics, growth trends, regional segmentation, product landscape, key players, and future outlook. The study period covers 2019-2033, with 2025 as the base and estimated year. The report caters to industry professionals, investors, and researchers seeking in-depth insights into this crucial sector. The market is segmented by type (Worm Gearbox, Helical Gearbox, Bevel Helical Gearbox, Planetary Gearbox, Other Types) and application (Power Industry, Steel Industry, Mines and Minerals Industry, Wastewater Treatment Industry, Manufacturing Industry, Other Applications). The total market size is predicted to reach xx Million units by 2033.

Industrial Gearbox Industry Market Dynamics & Structure

The industrial gearbox market, valued at xx Million units in 2024, is characterized by a moderately concentrated landscape with a few major players holding significant market share. Technological innovation, particularly in materials science and manufacturing processes, is a key driver, leading to improved efficiency, durability, and customized solutions. Stringent regulatory frameworks concerning safety and environmental compliance influence design and manufacturing practices. Competitive pressure from substitute technologies, like direct-drive systems, exists but remains niche in many applications. End-user demographics, particularly the manufacturing and power sectors, significantly influence market demand. M&A activity, as evidenced by recent acquisitions like Airbus Helicopters' purchase of ZF Luftfahrttechnik, signals consolidation and vertical integration within the supply chain.

  • Market Concentration: Moderately concentrated, with top 5 players holding approximately xx% market share.
  • Technological Innovation: Focus on energy efficiency, advanced materials (e.g., composites), and digitalization (predictive maintenance).
  • Regulatory Framework: Compliance with safety standards (e.g., ISO, CE) and environmental regulations (e.g., RoHS).
  • Competitive Substitutes: Direct-drive systems pose a limited threat, mainly in specific niche applications.
  • End-User Demographics: Strong demand from manufacturing, power generation, and mining sectors.
  • M&A Trends: Increasing consolidation through acquisitions and mergers to enhance market share and technological capabilities. Recent deals valued at approximately xx Million units.

Industrial Gearbox Industry Growth Trends & Insights

The industrial gearbox market exhibits steady growth, driven by increasing industrial automation, infrastructure development, and rising demand across various end-use sectors. The market witnessed a CAGR of xx% during the historical period (2019-2024) and is projected to maintain a CAGR of xx% during the forecast period (2025-2033), reaching xx Million units by 2033. Technological disruptions, including the adoption of smart sensors and predictive maintenance technologies, are transforming the industry. Consumer behavior shifts toward energy-efficient and reliable solutions fuel demand for advanced gearbox technologies. Market penetration of high-efficiency gearboxes is gradually increasing, driven by stringent environmental regulations and cost-saving incentives.

Industrial Gearbox Industry Growth

Dominant Regions, Countries, or Segments in Industrial Gearbox Industry

The Asia-Pacific region is currently the dominant market for industrial gearboxes, driven by rapid industrialization, infrastructure investments, and a growing manufacturing sector. Within this region, China and India are key contributors to market growth. In terms of segments, the Helical Gearbox segment holds the largest market share due to its versatility and adaptability across various applications. The Power Industry and Manufacturing Industry represent the largest application segments, showcasing strong growth potential across geographical regions.

  • Key Drivers (Asia-Pacific): Rapid industrialization, expanding manufacturing capacity, significant infrastructure projects.
  • Key Drivers (Helical Gearbox): High efficiency, versatility, suitability for various applications.
  • Key Drivers (Power & Manufacturing): High demand for automation, continuous process improvement, and increased energy efficiency.

Industrial Gearbox Industry Product Landscape

The industrial gearbox market offers a wide range of products tailored to specific applications. Innovations focus on enhanced efficiency, reduced noise levels, increased durability, and improved maintenance features. Technological advancements include the integration of smart sensors for predictive maintenance, advanced materials for improved strength and weight reduction, and modular designs for increased flexibility. Unique selling propositions often include customized solutions, extended warranties, and comprehensive after-sales support.

Key Drivers, Barriers & Challenges in Industrial Gearbox Industry

Key Drivers: Increasing automation in various industries, rising demand for energy-efficient solutions, infrastructure development projects globally, and government initiatives promoting industrial growth.

Challenges: Fluctuations in raw material prices, intense competition from established and emerging players, supply chain disruptions, and potential trade restrictions. These factors could lead to a xx% impact on market growth in the short term.

Emerging Opportunities in Industrial Gearbox Industry

The emergence of renewable energy sources, the growth of electric vehicles, and the increasing demand for automation in emerging markets present significant opportunities for industrial gearbox manufacturers. The development of specialized gearboxes for specific applications, such as robotics and aerospace, also offers lucrative growth prospects. Furthermore, the adoption of digital technologies, like Industry 4.0, presents opportunities for improved design, manufacturing, and maintenance processes.

Growth Accelerators in the Industrial Gearbox Industry Industry

Technological advancements in materials science and manufacturing processes are key catalysts for long-term growth. Strategic partnerships and collaborations across the value chain can enhance innovation and market penetration. Furthermore, expansion into new geographical markets and diversification into high-growth application segments can fuel future market expansion.

Key Players Shaping the Industrial Gearbox Industry Market

  • Flender Ltd
  • Sew-Eurodrive GmbH & Co KG
  • Bosch Rexroth AG
  • INGECO GEARS Pvt Ltd
  • Essential Power Transmission Pvt Ltd
  • Getriebebau NORD GmbH & Co KG
  • Nanjing High Accurate Drive Equipment Manufacturing Group Co Ltd
  • Zollern GmbH & Co KG
  • Lenze SE
  • Kngear
  • Elecon Engineering Company Limited
  • Bonfiglioli Drives Co Ltd

Notable Milestones in Industrial Gearbox Industry Sector

  • May 2023: Triumph Group secures a long-term agreement with General Electric for LEAP engine gearboxes, signifying a significant win in the aerospace sector.
  • January 2023: Airbus Helicopters acquires ZF Luftfahrttechnik, strengthening its position in the aerospace gearbox market.

In-Depth Industrial Gearbox Industry Market Outlook

The industrial gearbox market is poised for sustained growth, driven by continued technological advancements, strategic partnerships, and expansion into new markets. The focus on energy efficiency, enhanced durability, and smart technologies will further shape market dynamics. Companies that invest in innovation, adopt digitalization, and cater to specific end-user needs will be well-positioned to capture significant market share in the years to come.

Industrial Gearbox Industry Segmentation

  • 1. Type
    • 1.1. Worm Gearbox
    • 1.2. Helical Gearbox
    • 1.3. Bevel Helical Gearbox
    • 1.4. Planetary Gearbox
    • 1.5. Other Types
  • 2. Application
    • 2.1. Power Industry
    • 2.2. Steel Industry
    • 2.3. Mines and Minerals Industry
    • 2.4. Wastewater Treatment Industry
    • 2.5. Manufacturing Industry
    • 2.6. Other Applications

Industrial Gearbox Industry Segmentation By Geography

  • 1. North America
    • 1.1. United States
    • 1.2. Canada
    • 1.3. Rest of North America
  • 2. Europe
    • 2.1. Germany
    • 2.2. France
    • 2.3. United Kingdom
    • 2.4. Rest of Europe
  • 3. Asia Pacific
    • 3.1. China
    • 3.2. India
    • 3.3. Japan
    • 3.4. South Korea
    • 3.5. Rest of Asia Pacific
  • 4. South America
    • 4.1. Brazil
    • 4.2. Argentina
    • 4.3. Rest of South America
  • 5. Middle East and Africa
    • 5.1. Saudi Arabia
    • 5.2. United Arab Emirates
    • 5.3. South Africa
    • 5.4. Rest of Middle East and Africa
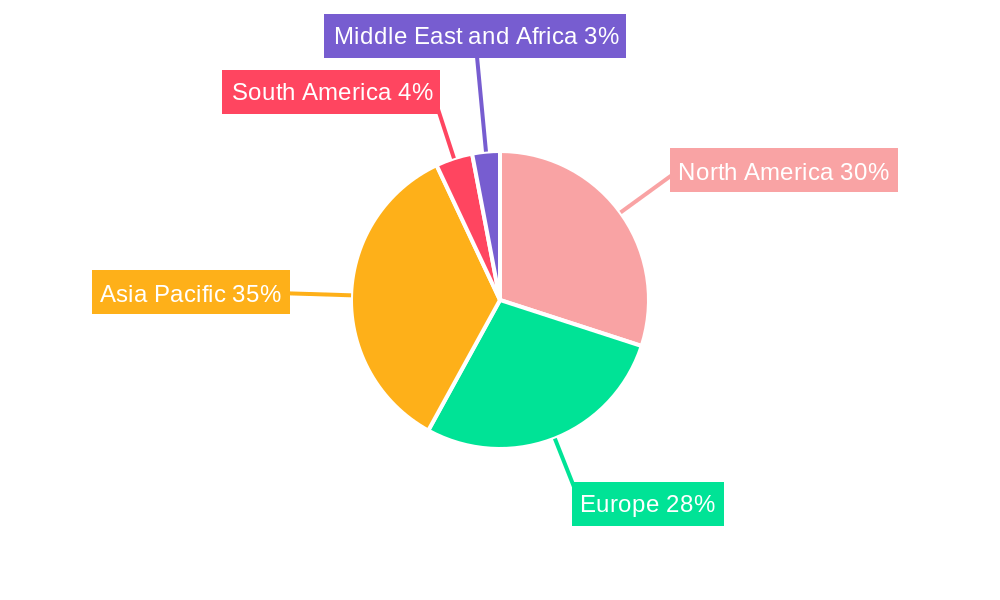
Industrial Gearbox Industry Regional Share


Industrial Gearbox Industry REPORT HIGHLIGHTS

AspectsDetails
Study Period 2019-2033
Base Year 2024
Estimated Year 2025
Forecast Period2025-2033
Historical Period2019-2024
Growth RateCAGR of 4.20% from 2019-2033
Segmentation
    • By Type
      • Worm Gearbox
      • Helical Gearbox
      • Bevel Helical Gearbox
      • Planetary Gearbox
      • Other Types
    • By Application
      • Power Industry
      • Steel Industry
      • Mines and Minerals Industry
      • Wastewater Treatment Industry
      • Manufacturing Industry
      • Other Applications
  • By Geography
    • North America
      • United States
      • Canada
      • Rest of North America
    • Europe
      • Germany
      • France
      • United Kingdom
      • Rest of Europe
    • Asia Pacific
      • China
      • India
      • Japan
      • South Korea
      • Rest of Asia Pacific
    • South America
      • Brazil
      • Argentina
      • Rest of South America
    • Middle East and Africa
      • Saudi Arabia
      • United Arab Emirates
      • South Africa
      • Rest of Middle East and Africa


Table of Contents

  1. 1. Introduction
    • 1.1. Research Scope
    • 1.2. Market Segmentation
    • 1.3. Research Methodology
    • 1.4. Definitions and Assumptions
  2. 2. Executive Summary
    • 2.1. Introduction
  3. 3. Market Dynamics
    • 3.1. Introduction
      • 3.2. Market Drivers
        • 3.2.1. 4.; Growing Adoption of Industrial Automation across Various Industrial Sectors4.; Rising Sales for Automobiles across the World
      • 3.3. Market Restrains
        • 3.3.1. 4.; Slow Down in Economic and Industrial Activities
      • 3.4. Market Trends
        • 3.4.1. Helical Gearbox Type Segment to Dominate the Market
  4. 4. Market Factor Analysis
    • 4.1. Porters Five Forces
    • 4.2. Supply/Value Chain
    • 4.3. PESTEL analysis
    • 4.4. Market Entropy
    • 4.5. Patent/Trademark Analysis
  5. 5. Global Industrial Gearbox Industry Analysis, Insights and Forecast, 2019-2031
    • 5.1. Market Analysis, Insights and Forecast - by Type
      • 5.1.1. Worm Gearbox
      • 5.1.2. Helical Gearbox
      • 5.1.3. Bevel Helical Gearbox
      • 5.1.4. Planetary Gearbox
      • 5.1.5. Other Types
    • 5.2. Market Analysis, Insights and Forecast - by Application
      • 5.2.1. Power Industry
      • 5.2.2. Steel Industry
      • 5.2.3. Mines and Minerals Industry
      • 5.2.4. Wastewater Treatment Industry
      • 5.2.5. Manufacturing Industry
      • 5.2.6. Other Applications
    • 5.3. Market Analysis, Insights and Forecast - by Region
      • 5.3.1. North America
      • 5.3.2. Europe
      • 5.3.3. Asia Pacific
      • 5.3.4. South America
      • 5.3.5. Middle East and Africa
  6. 6. North America Industrial Gearbox Industry Analysis, Insights and Forecast, 2019-2031
    • 6.1. Market Analysis, Insights and Forecast - by Type
      • 6.1.1. Worm Gearbox
      • 6.1.2. Helical Gearbox
      • 6.1.3. Bevel Helical Gearbox
      • 6.1.4. Planetary Gearbox
      • 6.1.5. Other Types
    • 6.2. Market Analysis, Insights and Forecast - by Application
      • 6.2.1. Power Industry
      • 6.2.2. Steel Industry
      • 6.2.3. Mines and Minerals Industry
      • 6.2.4. Wastewater Treatment Industry
      • 6.2.5. Manufacturing Industry
      • 6.2.6. Other Applications
  7. 7. Europe Industrial Gearbox Industry Analysis, Insights and Forecast, 2019-2031
    • 7.1. Market Analysis, Insights and Forecast - by Type
      • 7.1.1. Worm Gearbox
      • 7.1.2. Helical Gearbox
      • 7.1.3. Bevel Helical Gearbox
      • 7.1.4. Planetary Gearbox
      • 7.1.5. Other Types
    • 7.2. Market Analysis, Insights and Forecast - by Application
      • 7.2.1. Power Industry
      • 7.2.2. Steel Industry
      • 7.2.3. Mines and Minerals Industry
      • 7.2.4. Wastewater Treatment Industry
      • 7.2.5. Manufacturing Industry
      • 7.2.6. Other Applications
  8. 8. Asia Pacific Industrial Gearbox Industry Analysis, Insights and Forecast, 2019-2031
    • 8.1. Market Analysis, Insights and Forecast - by Type
      • 8.1.1. Worm Gearbox
      • 8.1.2. Helical Gearbox
      • 8.1.3. Bevel Helical Gearbox
      • 8.1.4. Planetary Gearbox
      • 8.1.5. Other Types
    • 8.2. Market Analysis, Insights and Forecast - by Application
      • 8.2.1. Power Industry
      • 8.2.2. Steel Industry
      • 8.2.3. Mines and Minerals Industry
      • 8.2.4. Wastewater Treatment Industry
      • 8.2.5. Manufacturing Industry
      • 8.2.6. Other Applications
  9. 9. South America Industrial Gearbox Industry Analysis, Insights and Forecast, 2019-2031
    • 9.1. Market Analysis, Insights and Forecast - by Type
      • 9.1.1. Worm Gearbox
      • 9.1.2. Helical Gearbox
      • 9.1.3. Bevel Helical Gearbox
      • 9.1.4. Planetary Gearbox
      • 9.1.5. Other Types
    • 9.2. Market Analysis, Insights and Forecast - by Application
      • 9.2.1. Power Industry
      • 9.2.2. Steel Industry
      • 9.2.3. Mines and Minerals Industry
      • 9.2.4. Wastewater Treatment Industry
      • 9.2.5. Manufacturing Industry
      • 9.2.6. Other Applications
  10. 10. Middle East and Africa Industrial Gearbox Industry Analysis, Insights and Forecast, 2019-2031
    • 10.1. Market Analysis, Insights and Forecast - by Type
      • 10.1.1. Worm Gearbox
      • 10.1.2. Helical Gearbox
      • 10.1.3. Bevel Helical Gearbox
      • 10.1.4. Planetary Gearbox
      • 10.1.5. Other Types
    • 10.2. Market Analysis, Insights and Forecast - by Application
      • 10.2.1. Power Industry
      • 10.2.2. Steel Industry
      • 10.2.3. Mines and Minerals Industry
      • 10.2.4. Wastewater Treatment Industry
      • 10.2.5. Manufacturing Industry
      • 10.2.6. Other Applications
  11. 11. North America Industrial Gearbox Industry Analysis, Insights and Forecast, 2019-2031
      • 11.1. Market Analysis, Insights and Forecast - By Country/Sub-region
        • 11.1.1 United States
        • 11.1.2 Canada
        • 11.1.3 Rest of North America
  12. 12. Europe Industrial Gearbox Industry Analysis, Insights and Forecast, 2019-2031
      • 12.1. Market Analysis, Insights and Forecast - By Country/Sub-region
        • 12.1.1 Germany
        • 12.1.2 France
        • 12.1.3 United Kingdom
        • 12.1.4 Rest of Europe
  13. 13. Asia Pacific Industrial Gearbox Industry Analysis, Insights and Forecast, 2019-2031
      • 13.1. Market Analysis, Insights and Forecast - By Country/Sub-region
        • 13.1.1 China
        • 13.1.2 India
        • 13.1.3 Japan
        • 13.1.4 South Korea
        • 13.1.5 Rest of Asia Pacific
  14. 14. South America Industrial Gearbox Industry Analysis, Insights and Forecast, 2019-2031
      • 14.1. Market Analysis, Insights and Forecast - By Country/Sub-region
        • 14.1.1 Brazil
        • 14.1.2 Argentina
        • 14.1.3 Rest of South America
  15. 15. Middle East and Africa Industrial Gearbox Industry Analysis, Insights and Forecast, 2019-2031
      • 15.1. Market Analysis, Insights and Forecast - By Country/Sub-region
        • 15.1.1 Saudi Arabia
        • 15.1.2 United Arab Emirates
        • 15.1.3 South Africa
        • 15.1.4 Rest of Middle East and Africa
  16. 16. Competitive Analysis
    • 16.1. Global Market Share Analysis 2024
      • 16.2. Company Profiles
        • 16.2.1 Flender Ltd
          • 16.2.1.1. Overview
          • 16.2.1.2. Products
          • 16.2.1.3. SWOT Analysis
          • 16.2.1.4. Recent Developments
          • 16.2.1.5. Financials (Based on Availability)
        • 16.2.2 Sew-Eurodrive GmbH & Co KG
          • 16.2.2.1. Overview
          • 16.2.2.2. Products
          • 16.2.2.3. SWOT Analysis
          • 16.2.2.4. Recent Developments
          • 16.2.2.5. Financials (Based on Availability)
        • 16.2.3 Bosch Rexroth AG
          • 16.2.3.1. Overview
          • 16.2.3.2. Products
          • 16.2.3.3. SWOT Analysis
          • 16.2.3.4. Recent Developments
          • 16.2.3.5. Financials (Based on Availability)
        • 16.2.4 INGECO GEARS Pvt Ltd
          • 16.2.4.1. Overview
          • 16.2.4.2. Products
          • 16.2.4.3. SWOT Analysis
          • 16.2.4.4. Recent Developments
          • 16.2.4.5. Financials (Based on Availability)
        • 16.2.5 Essential Power Transmission Pvt Ltd
          • 16.2.5.1. Overview
          • 16.2.5.2. Products
          • 16.2.5.3. SWOT Analysis
          • 16.2.5.4. Recent Developments
          • 16.2.5.5. Financials (Based on Availability)
        • 16.2.6 Getriebebau NORD GmbH & Co KG
          • 16.2.6.1. Overview
          • 16.2.6.2. Products
          • 16.2.6.3. SWOT Analysis
          • 16.2.6.4. Recent Developments
          • 16.2.6.5. Financials (Based on Availability)
        • 16.2.7 Nanjing High Accurate Drive Equipment Manufacturing Group Co Ltd
          • 16.2.7.1. Overview
          • 16.2.7.2. Products
          • 16.2.7.3. SWOT Analysis
          • 16.2.7.4. Recent Developments
          • 16.2.7.5. Financials (Based on Availability)
        • 16.2.8 Zollern GmbH & Co KG
          • 16.2.8.1. Overview
          • 16.2.8.2. Products
          • 16.2.8.3. SWOT Analysis
          • 16.2.8.4. Recent Developments
          • 16.2.8.5. Financials (Based on Availability)
        • 16.2.9 Lenze SE
          • 16.2.9.1. Overview
          • 16.2.9.2. Products
          • 16.2.9.3. SWOT Analysis
          • 16.2.9.4. Recent Developments
          • 16.2.9.5. Financials (Based on Availability)
        • 16.2.10 Kngear
          • 16.2.10.1. Overview
          • 16.2.10.2. Products
          • 16.2.10.3. SWOT Analysis
          • 16.2.10.4. Recent Developments
          • 16.2.10.5. Financials (Based on Availability)
        • 16.2.11 Elecon Engineering Company Limited
          • 16.2.11.1. Overview
          • 16.2.11.2. Products
          • 16.2.11.3. SWOT Analysis
          • 16.2.11.4. Recent Developments
          • 16.2.11.5. Financials (Based on Availability)
        • 16.2.12 Bonfiglioli Drives Co Ltd
          • 16.2.12.1. Overview
          • 16.2.12.2. Products
          • 16.2.12.3. SWOT Analysis
          • 16.2.12.4. Recent Developments
          • 16.2.12.5. Financials (Based on Availability)

List of Figures

  1. Figure 1: Global Industrial Gearbox Industry Revenue Breakdown (Million, %) by Region 2024 & 2032
  2. Figure 2: Global Industrial Gearbox Industry Volume Breakdown (K Unit, %) by Region 2024 & 2032
  3. Figure 3: North America Industrial Gearbox Industry Revenue (Million), by Country 2024 & 2032
  4. Figure 4: North America Industrial Gearbox Industry Volume (K Unit), by Country 2024 & 2032
  5. Figure 5: North America Industrial Gearbox Industry Revenue Share (%), by Country 2024 & 2032
  6. Figure 6: North America Industrial Gearbox Industry Volume Share (%), by Country 2024 & 2032
  7. Figure 7: Europe Industrial Gearbox Industry Revenue (Million), by Country 2024 & 2032
  8. Figure 8: Europe Industrial Gearbox Industry Volume (K Unit), by Country 2024 & 2032
  9. Figure 9: Europe Industrial Gearbox Industry Revenue Share (%), by Country 2024 & 2032
  10. Figure 10: Europe Industrial Gearbox Industry Volume Share (%), by Country 2024 & 2032
  11. Figure 11: Asia Pacific Industrial Gearbox Industry Revenue (Million), by Country 2024 & 2032
  12. Figure 12: Asia Pacific Industrial Gearbox Industry Volume (K Unit), by Country 2024 & 2032
  13. Figure 13: Asia Pacific Industrial Gearbox Industry Revenue Share (%), by Country 2024 & 2032
  14. Figure 14: Asia Pacific Industrial Gearbox Industry Volume Share (%), by Country 2024 & 2032
  15. Figure 15: South America Industrial Gearbox Industry Revenue (Million), by Country 2024 & 2032
  16. Figure 16: South America Industrial Gearbox Industry Volume (K Unit), by Country 2024 & 2032
  17. Figure 17: South America Industrial Gearbox Industry Revenue Share (%), by Country 2024 & 2032
  18. Figure 18: South America Industrial Gearbox Industry Volume Share (%), by Country 2024 & 2032
  19. Figure 19: Middle East and Africa Industrial Gearbox Industry Revenue (Million), by Country 2024 & 2032
  20. Figure 20: Middle East and Africa Industrial Gearbox Industry Volume (K Unit), by Country 2024 & 2032
  21. Figure 21: Middle East and Africa Industrial Gearbox Industry Revenue Share (%), by Country 2024 & 2032
  22. Figure 22: Middle East and Africa Industrial Gearbox Industry Volume Share (%), by Country 2024 & 2032
  23. Figure 23: North America Industrial Gearbox Industry Revenue (Million), by Type 2024 & 2032
  24. Figure 24: North America Industrial Gearbox Industry Volume (K Unit), by Type 2024 & 2032
  25. Figure 25: North America Industrial Gearbox Industry Revenue Share (%), by Type 2024 & 2032
  26. Figure 26: North America Industrial Gearbox Industry Volume Share (%), by Type 2024 & 2032
  27. Figure 27: North America Industrial Gearbox Industry Revenue (Million), by Application 2024 & 2032
  28. Figure 28: North America Industrial Gearbox Industry Volume (K Unit), by Application 2024 & 2032
  29. Figure 29: North America Industrial Gearbox Industry Revenue Share (%), by Application 2024 & 2032
  30. Figure 30: North America Industrial Gearbox Industry Volume Share (%), by Application 2024 & 2032
  31. Figure 31: North America Industrial Gearbox Industry Revenue (Million), by Country 2024 & 2032
  32. Figure 32: North America Industrial Gearbox Industry Volume (K Unit), by Country 2024 & 2032
  33. Figure 33: North America Industrial Gearbox Industry Revenue Share (%), by Country 2024 & 2032
  34. Figure 34: North America Industrial Gearbox Industry Volume Share (%), by Country 2024 & 2032
  35. Figure 35: Europe Industrial Gearbox Industry Revenue (Million), by Type 2024 & 2032
  36. Figure 36: Europe Industrial Gearbox Industry Volume (K Unit), by Type 2024 & 2032
  37. Figure 37: Europe Industrial Gearbox Industry Revenue Share (%), by Type 2024 & 2032
  38. Figure 38: Europe Industrial Gearbox Industry Volume Share (%), by Type 2024 & 2032
  39. Figure 39: Europe Industrial Gearbox Industry Revenue (Million), by Application 2024 & 2032
  40. Figure 40: Europe Industrial Gearbox Industry Volume (K Unit), by Application 2024 & 2032
  41. Figure 41: Europe Industrial Gearbox Industry Revenue Share (%), by Application 2024 & 2032
  42. Figure 42: Europe Industrial Gearbox Industry Volume Share (%), by Application 2024 & 2032
  43. Figure 43: Europe Industrial Gearbox Industry Revenue (Million), by Country 2024 & 2032
  44. Figure 44: Europe Industrial Gearbox Industry Volume (K Unit), by Country 2024 & 2032
  45. Figure 45: Europe Industrial Gearbox Industry Revenue Share (%), by Country 2024 & 2032
  46. Figure 46: Europe Industrial Gearbox Industry Volume Share (%), by Country 2024 & 2032
  47. Figure 47: Asia Pacific Industrial Gearbox Industry Revenue (Million), by Type 2024 & 2032
  48. Figure 48: Asia Pacific Industrial Gearbox Industry Volume (K Unit), by Type 2024 & 2032
  49. Figure 49: Asia Pacific Industrial Gearbox Industry Revenue Share (%), by Type 2024 & 2032
  50. Figure 50: Asia Pacific Industrial Gearbox Industry Volume Share (%), by Type 2024 & 2032
  51. Figure 51: Asia Pacific Industrial Gearbox Industry Revenue (Million), by Application 2024 & 2032
  52. Figure 52: Asia Pacific Industrial Gearbox Industry Volume (K Unit), by Application 2024 & 2032
  53. Figure 53: Asia Pacific Industrial Gearbox Industry Revenue Share (%), by Application 2024 & 2032
  54. Figure 54: Asia Pacific Industrial Gearbox Industry Volume Share (%), by Application 2024 & 2032
  55. Figure 55: Asia Pacific Industrial Gearbox Industry Revenue (Million), by Country 2024 & 2032
  56. Figure 56: Asia Pacific Industrial Gearbox Industry Volume (K Unit), by Country 2024 & 2032
  57. Figure 57: Asia Pacific Industrial Gearbox Industry Revenue Share (%), by Country 2024 & 2032
  58. Figure 58: Asia Pacific Industrial Gearbox Industry Volume Share (%), by Country 2024 & 2032
  59. Figure 59: South America Industrial Gearbox Industry Revenue (Million), by Type 2024 & 2032
  60. Figure 60: South America Industrial Gearbox Industry Volume (K Unit), by Type 2024 & 2032
  61. Figure 61: South America Industrial Gearbox Industry Revenue Share (%), by Type 2024 & 2032
  62. Figure 62: South America Industrial Gearbox Industry Volume Share (%), by Type 2024 & 2032
  63. Figure 63: South America Industrial Gearbox Industry Revenue (Million), by Application 2024 & 2032
  64. Figure 64: South America Industrial Gearbox Industry Volume (K Unit), by Application 2024 & 2032
  65. Figure 65: South America Industrial Gearbox Industry Revenue Share (%), by Application 2024 & 2032
  66. Figure 66: South America Industrial Gearbox Industry Volume Share (%), by Application 2024 & 2032
  67. Figure 67: South America Industrial Gearbox Industry Revenue (Million), by Country 2024 & 2032
  68. Figure 68: South America Industrial Gearbox Industry Volume (K Unit), by Country 2024 & 2032
  69. Figure 69: South America Industrial Gearbox Industry Revenue Share (%), by Country 2024 & 2032
  70. Figure 70: South America Industrial Gearbox Industry Volume Share (%), by Country 2024 & 2032
  71. Figure 71: Middle East and Africa Industrial Gearbox Industry Revenue (Million), by Type 2024 & 2032
  72. Figure 72: Middle East and Africa Industrial Gearbox Industry Volume (K Unit), by Type 2024 & 2032
  73. Figure 73: Middle East and Africa Industrial Gearbox Industry Revenue Share (%), by Type 2024 & 2032
  74. Figure 74: Middle East and Africa Industrial Gearbox Industry Volume Share (%), by Type 2024 & 2032
  75. Figure 75: Middle East and Africa Industrial Gearbox Industry Revenue (Million), by Application 2024 & 2032
  76. Figure 76: Middle East and Africa Industrial Gearbox Industry Volume (K Unit), by Application 2024 & 2032
  77. Figure 77: Middle East and Africa Industrial Gearbox Industry Revenue Share (%), by Application 2024 & 2032
  78. Figure 78: Middle East and Africa Industrial Gearbox Industry Volume Share (%), by Application 2024 & 2032
  79. Figure 79: Middle East and Africa Industrial Gearbox Industry Revenue (Million), by Country 2024 & 2032
  80. Figure 80: Middle East and Africa Industrial Gearbox Industry Volume (K Unit), by Country 2024 & 2032
  81. Figure 81: Middle East and Africa Industrial Gearbox Industry Revenue Share (%), by Country 2024 & 2032
  82. Figure 82: Middle East and Africa Industrial Gearbox Industry Volume Share (%), by Country 2024 & 2032

List of Tables

  1. Table 1: Global Industrial Gearbox Industry Revenue Million Forecast, by Region 2019 & 2032
  2. Table 2: Global Industrial Gearbox Industry Volume K Unit Forecast, by Region 2019 & 2032
  3. Table 3: Global Industrial Gearbox Industry Revenue Million Forecast, by Type 2019 & 2032
  4. Table 4: Global Industrial Gearbox Industry Volume K Unit Forecast, by Type 2019 & 2032
  5. Table 5: Global Industrial Gearbox Industry Revenue Million Forecast, by Application 2019 & 2032
  6. Table 6: Global Industrial Gearbox Industry Volume K Unit Forecast, by Application 2019 & 2032
  7. Table 7: Global Industrial Gearbox Industry Revenue Million Forecast, by Region 2019 & 2032
  8. Table 8: Global Industrial Gearbox Industry Volume K Unit Forecast, by Region 2019 & 2032
  9. Table 9: Global Industrial Gearbox Industry Revenue Million Forecast, by Country 2019 & 2032
  10. Table 10: Global Industrial Gearbox Industry Volume K Unit Forecast, by Country 2019 & 2032
  11. Table 11: United States Industrial Gearbox Industry Revenue (Million) Forecast, by Application 2019 & 2032
  12. Table 12: United States Industrial Gearbox Industry Volume (K Unit) Forecast, by Application 2019 & 2032
  13. Table 13: Canada Industrial Gearbox Industry Revenue (Million) Forecast, by Application 2019 & 2032
  14. Table 14: Canada Industrial Gearbox Industry Volume (K Unit) Forecast, by Application 2019 & 2032
  15. Table 15: Rest of North America Industrial Gearbox Industry Revenue (Million) Forecast, by Application 2019 & 2032
  16. Table 16: Rest of North America Industrial Gearbox Industry Volume (K Unit) Forecast, by Application 2019 & 2032
  17. Table 17: Global Industrial Gearbox Industry Revenue Million Forecast, by Country 2019 & 2032
  18. Table 18: Global Industrial Gearbox Industry Volume K Unit Forecast, by Country 2019 & 2032
  19. Table 19: Germany Industrial Gearbox Industry Revenue (Million) Forecast, by Application 2019 & 2032
  20. Table 20: Germany Industrial Gearbox Industry Volume (K Unit) Forecast, by Application 2019 & 2032
  21. Table 21: France Industrial Gearbox Industry Revenue (Million) Forecast, by Application 2019 & 2032
  22. Table 22: France Industrial Gearbox Industry Volume (K Unit) Forecast, by Application 2019 & 2032
  23. Table 23: United Kingdom Industrial Gearbox Industry Revenue (Million) Forecast, by Application 2019 & 2032
  24. Table 24: United Kingdom Industrial Gearbox Industry Volume (K Unit) Forecast, by Application 2019 & 2032
  25. Table 25: Rest of Europe Industrial Gearbox Industry Revenue (Million) Forecast, by Application 2019 & 2032
  26. Table 26: Rest of Europe Industrial Gearbox Industry Volume (K Unit) Forecast, by Application 2019 & 2032
  27. Table 27: Global Industrial Gearbox Industry Revenue Million Forecast, by Country 2019 & 2032
  28. Table 28: Global Industrial Gearbox Industry Volume K Unit Forecast, by Country 2019 & 2032
  29. Table 29: China Industrial Gearbox Industry Revenue (Million) Forecast, by Application 2019 & 2032
  30. Table 30: China Industrial Gearbox Industry Volume (K Unit) Forecast, by Application 2019 & 2032
  31. Table 31: India Industrial Gearbox Industry Revenue (Million) Forecast, by Application 2019 & 2032
  32. Table 32: India Industrial Gearbox Industry Volume (K Unit) Forecast, by Application 2019 & 2032
  33. Table 33: Japan Industrial Gearbox Industry Revenue (Million) Forecast, by Application 2019 & 2032
  34. Table 34: Japan Industrial Gearbox Industry Volume (K Unit) Forecast, by Application 2019 & 2032
  35. Table 35: South Korea Industrial Gearbox Industry Revenue (Million) Forecast, by Application 2019 & 2032
  36. Table 36: South Korea Industrial Gearbox Industry Volume (K Unit) Forecast, by Application 2019 & 2032
  37. Table 37: Rest of Asia Pacific Industrial Gearbox Industry Revenue (Million) Forecast, by Application 2019 & 2032
  38. Table 38: Rest of Asia Pacific Industrial Gearbox Industry Volume (K Unit) Forecast, by Application 2019 & 2032
  39. Table 39: Global Industrial Gearbox Industry Revenue Million Forecast, by Country 2019 & 2032
  40. Table 40: Global Industrial Gearbox Industry Volume K Unit Forecast, by Country 2019 & 2032
  41. Table 41: Brazil Industrial Gearbox Industry Revenue (Million) Forecast, by Application 2019 & 2032
  42. Table 42: Brazil Industrial Gearbox Industry Volume (K Unit) Forecast, by Application 2019 & 2032
  43. Table 43: Argentina Industrial Gearbox Industry Revenue (Million) Forecast, by Application 2019 & 2032
  44. Table 44: Argentina Industrial Gearbox Industry Volume (K Unit) Forecast, by Application 2019 & 2032
  45. Table 45: Rest of South America Industrial Gearbox Industry Revenue (Million) Forecast, by Application 2019 & 2032
  46. Table 46: Rest of South America Industrial Gearbox Industry Volume (K Unit) Forecast, by Application 2019 & 2032
  47. Table 47: Global Industrial Gearbox Industry Revenue Million Forecast, by Country 2019 & 2032
  48. Table 48: Global Industrial Gearbox Industry Volume K Unit Forecast, by Country 2019 & 2032
  49. Table 49: Saudi Arabia Industrial Gearbox Industry Revenue (Million) Forecast, by Application 2019 & 2032
  50. Table 50: Saudi Arabia Industrial Gearbox Industry Volume (K Unit) Forecast, by Application 2019 & 2032
  51. Table 51: United Arab Emirates Industrial Gearbox Industry Revenue (Million) Forecast, by Application 2019 & 2032
  52. Table 52: United Arab Emirates Industrial Gearbox Industry Volume (K Unit) Forecast, by Application 2019 & 2032
  53. Table 53: South Africa Industrial Gearbox Industry Revenue (Million) Forecast, by Application 2019 & 2032
  54. Table 54: South Africa Industrial Gearbox Industry Volume (K Unit) Forecast, by Application 2019 & 2032
  55. Table 55: Rest of Middle East and Africa Industrial Gearbox Industry Revenue (Million) Forecast, by Application 2019 & 2032
  56. Table 56: Rest of Middle East and Africa Industrial Gearbox Industry Volume (K Unit) Forecast, by Application 2019 & 2032
  57. Table 57: Global Industrial Gearbox Industry Revenue Million Forecast, by Type 2019 & 2032
  58. Table 58: Global Industrial Gearbox Industry Volume K Unit Forecast, by Type 2019 & 2032
  59. Table 59: Global Industrial Gearbox Industry Revenue Million Forecast, by Application 2019 & 2032
  60. Table 60: Global Industrial Gearbox Industry Volume K Unit Forecast, by Application 2019 & 2032
  61. Table 61: Global Industrial Gearbox Industry Revenue Million Forecast, by Country 2019 & 2032
  62. Table 62: Global Industrial Gearbox Industry Volume K Unit Forecast, by Country 2019 & 2032
  63. Table 63: United States Industrial Gearbox Industry Revenue (Million) Forecast, by Application 2019 & 2032
  64. Table 64: United States Industrial Gearbox Industry Volume (K Unit) Forecast, by Application 2019 & 2032
  65. Table 65: Canada Industrial Gearbox Industry Revenue (Million) Forecast, by Application 2019 & 2032
  66. Table 66: Canada Industrial Gearbox Industry Volume (K Unit) Forecast, by Application 2019 & 2032
  67. Table 67: Rest of North America Industrial Gearbox Industry Revenue (Million) Forecast, by Application 2019 & 2032
  68. Table 68: Rest of North America Industrial Gearbox Industry Volume (K Unit) Forecast, by Application 2019 & 2032
  69. Table 69: Global Industrial Gearbox Industry Revenue Million Forecast, by Type 2019 & 2032
  70. Table 70: Global Industrial Gearbox Industry Volume K Unit Forecast, by Type 2019 & 2032
  71. Table 71: Global Industrial Gearbox Industry Revenue Million Forecast, by Application 2019 & 2032
  72. Table 72: Global Industrial Gearbox Industry Volume K Unit Forecast, by Application 2019 & 2032
  73. Table 73: Global Industrial Gearbox Industry Revenue Million Forecast, by Country 2019 & 2032
  74. Table 74: Global Industrial Gearbox Industry Volume K Unit Forecast, by Country 2019 & 2032
  75. Table 75: Germany Industrial Gearbox Industry Revenue (Million) Forecast, by Application 2019 & 2032
  76. Table 76: Germany Industrial Gearbox Industry Volume (K Unit) Forecast, by Application 2019 & 2032
  77. Table 77: France Industrial Gearbox Industry Revenue (Million) Forecast, by Application 2019 & 2032
  78. Table 78: France Industrial Gearbox Industry Volume (K Unit) Forecast, by Application 2019 & 2032
  79. Table 79: United Kingdom Industrial Gearbox Industry Revenue (Million) Forecast, by Application 2019 & 2032
  80. Table 80: United Kingdom Industrial Gearbox Industry Volume (K Unit) Forecast, by Application 2019 & 2032
  81. Table 81: Rest of Europe Industrial Gearbox Industry Revenue (Million) Forecast, by Application 2019 & 2032
  82. Table 82: Rest of Europe Industrial Gearbox Industry Volume (K Unit) Forecast, by Application 2019 & 2032
  83. Table 83: Global Industrial Gearbox Industry Revenue Million Forecast, by Type 2019 & 2032
  84. Table 84: Global Industrial Gearbox Industry Volume K Unit Forecast, by Type 2019 & 2032
  85. Table 85: Global Industrial Gearbox Industry Revenue Million Forecast, by Application 2019 & 2032
  86. Table 86: Global Industrial Gearbox Industry Volume K Unit Forecast, by Application 2019 & 2032
  87. Table 87: Global Industrial Gearbox Industry Revenue Million Forecast, by Country 2019 & 2032
  88. Table 88: Global Industrial Gearbox Industry Volume K Unit Forecast, by Country 2019 & 2032
  89. Table 89: China Industrial Gearbox Industry Revenue (Million) Forecast, by Application 2019 & 2032
  90. Table 90: China Industrial Gearbox Industry Volume (K Unit) Forecast, by Application 2019 & 2032
  91. Table 91: India Industrial Gearbox Industry Revenue (Million) Forecast, by Application 2019 & 2032
  92. Table 92: India Industrial Gearbox Industry Volume (K Unit) Forecast, by Application 2019 & 2032
  93. Table 93: Japan Industrial Gearbox Industry Revenue (Million) Forecast, by Application 2019 & 2032
  94. Table 94: Japan Industrial Gearbox Industry Volume (K Unit) Forecast, by Application 2019 & 2032
  95. Table 95: South Korea Industrial Gearbox Industry Revenue (Million) Forecast, by Application 2019 & 2032
  96. Table 96: South Korea Industrial Gearbox Industry Volume (K Unit) Forecast, by Application 2019 & 2032
  97. Table 97: Rest of Asia Pacific Industrial Gearbox Industry Revenue (Million) Forecast, by Application 2019 & 2032
  98. Table 98: Rest of Asia Pacific Industrial Gearbox Industry Volume (K Unit) Forecast, by Application 2019 & 2032
  99. Table 99: Global Industrial Gearbox Industry Revenue Million Forecast, by Type 2019 & 2032
  100. Table 100: Global Industrial Gearbox Industry Volume K Unit Forecast, by Type 2019 & 2032
  101. Table 101: Global Industrial Gearbox Industry Revenue Million Forecast, by Application 2019 & 2032
  102. Table 102: Global Industrial Gearbox Industry Volume K Unit Forecast, by Application 2019 & 2032
  103. Table 103: Global Industrial Gearbox Industry Revenue Million Forecast, by Country 2019 & 2032
  104. Table 104: Global Industrial Gearbox Industry Volume K Unit Forecast, by Country 2019 & 2032
  105. Table 105: Brazil Industrial Gearbox Industry Revenue (Million) Forecast, by Application 2019 & 2032
  106. Table 106: Brazil Industrial Gearbox Industry Volume (K Unit) Forecast, by Application 2019 & 2032
  107. Table 107: Argentina Industrial Gearbox Industry Revenue (Million) Forecast, by Application 2019 & 2032
  108. Table 108: Argentina Industrial Gearbox Industry Volume (K Unit) Forecast, by Application 2019 & 2032
  109. Table 109: Rest of South America Industrial Gearbox Industry Revenue (Million) Forecast, by Application 2019 & 2032
  110. Table 110: Rest of South America Industrial Gearbox Industry Volume (K Unit) Forecast, by Application 2019 & 2032
  111. Table 111: Global Industrial Gearbox Industry Revenue Million Forecast, by Type 2019 & 2032
  112. Table 112: Global Industrial Gearbox Industry Volume K Unit Forecast, by Type 2019 & 2032
  113. Table 113: Global Industrial Gearbox Industry Revenue Million Forecast, by Application 2019 & 2032
  114. Table 114: Global Industrial Gearbox Industry Volume K Unit Forecast, by Application 2019 & 2032
  115. Table 115: Global Industrial Gearbox Industry Revenue Million Forecast, by Country 2019 & 2032
  116. Table 116: Global Industrial Gearbox Industry Volume K Unit Forecast, by Country 2019 & 2032
  117. Table 117: Saudi Arabia Industrial Gearbox Industry Revenue (Million) Forecast, by Application 2019 & 2032
  118. Table 118: Saudi Arabia Industrial Gearbox Industry Volume (K Unit) Forecast, by Application 2019 & 2032
  119. Table 119: United Arab Emirates Industrial Gearbox Industry Revenue (Million) Forecast, by Application 2019 & 2032
  120. Table 120: United Arab Emirates Industrial Gearbox Industry Volume (K Unit) Forecast, by Application 2019 & 2032
  121. Table 121: South Africa Industrial Gearbox Industry Revenue (Million) Forecast, by Application 2019 & 2032
  122. Table 122: South Africa Industrial Gearbox Industry Volume (K Unit) Forecast, by Application 2019 & 2032
  123. Table 123: Rest of Middle East and Africa Industrial Gearbox Industry Revenue (Million) Forecast, by Application 2019 & 2032
  124. Table 124: Rest of Middle East and Africa Industrial Gearbox Industry Volume (K Unit) Forecast, by Application 2019 & 2032


Frequently Asked Questions

1. What is the projected Compound Annual Growth Rate (CAGR) of the Industrial Gearbox Industry?

The projected CAGR is approximately 4.20%.

2. Which companies are prominent players in the Industrial Gearbox Industry?

Key companies in the market include Flender Ltd, Sew-Eurodrive GmbH & Co KG, Bosch Rexroth AG, INGECO GEARS Pvt Ltd, Essential Power Transmission Pvt Ltd, Getriebebau NORD GmbH & Co KG, Nanjing High Accurate Drive Equipment Manufacturing Group Co Ltd, Zollern GmbH & Co KG, Lenze SE, Kngear, Elecon Engineering Company Limited, Bonfiglioli Drives Co Ltd.

3. What are the main segments of the Industrial Gearbox Industry?

The market segments include Type, Application.

4. Can you provide details about the market size?

The market size is estimated to be USD 28.33 Million as of 2022.

5. What are some drivers contributing to market growth?

4.; Growing Adoption of Industrial Automation across Various Industrial Sectors4.; Rising Sales for Automobiles across the World.

6. What are the notable trends driving market growth?

Helical Gearbox Type Segment to Dominate the Market.

7. Are there any restraints impacting market growth?

4.; Slow Down in Economic and Industrial Activities.

8. Can you provide examples of recent developments in the market?

May 2023: Triumph Group, Inc. announced that it had been awarded a long-term agreement from General Electric (GE) through its Geared Solutions business for LEAP-1A, LEAP-1B, and LEAP-1C programs. TRIUMPH has collaborated with GE on LEAP and CFM56 IGBs for over 35 years, shipping over 25,000 gearboxes till now. TRIUMPH will supply thousands of IGBs annually to GE into the next decade with this contract extension.

9. What pricing options are available for accessing the report?

Pricing options include single-user, multi-user, and enterprise licenses priced at USD 4750, USD 5250, and USD 8750 respectively.

10. Is the market size provided in terms of value or volume?

The market size is provided in terms of value, measured in Million and volume, measured in K Unit.

11. Are there any specific market keywords associated with the report?

Yes, the market keyword associated with the report is "Industrial Gearbox Industry," which aids in identifying and referencing the specific market segment covered.

12. How do I determine which pricing option suits my needs best?

The pricing options vary based on user requirements and access needs. Individual users may opt for single-user licenses, while businesses requiring broader access may choose multi-user or enterprise licenses for cost-effective access to the report.

13. Are there any additional resources or data provided in the Industrial Gearbox Industry report?

While the report offers comprehensive insights, it's advisable to review the specific contents or supplementary materials provided to ascertain if additional resources or data are available.

14. How can I stay updated on further developments or reports in the Industrial Gearbox Industry?

To stay informed about further developments, trends, and reports in the Industrial Gearbox Industry, consider subscribing to industry newsletters, following relevant companies and organizations, or regularly checking reputable industry news sources and publications.


Methodology

Step 1 - Identification of Relevant Samples Size from Population Database

Step Chart
Bar Chart
Method Chart

Step 2 - Approaches for Defining Global Market Size (Value, Volume* & Price*)

Approach Chart
Top-down and bottom-up approaches are used to validate the global market size and estimate the market size for manufactures, regional segments, product, and application.

Note*: In applicable scenarios

Step 3 - Data Sources

Primary Research

  • Web Analytics
  • Survey Reports
  • Research Institute
  • Latest Research Reports
  • Opinion Leaders

Secondary Research

  • Annual Reports
  • White Paper
  • Latest Press Release
  • Industry Association
  • Paid Database
  • Investor Presentations
Analyst Chart

Step 4 - Data Triangulation

Involves using different sources of information in order to increase the validity of a study

These sources are likely to be stakeholders in a program - participants, other researchers, program staff, other community members, and so on.

Then we put all data in single framework & apply various statistical tools to find out the dynamic on the market.

During the analysis stage, feedback from the stakeholder groups would be compared to determine areas of agreement as well as areas of divergence

Additionally, after gathering mixed and scattered data from a wide range of sources, data is triangulated and correlated to come up with estimated figures which are further validated through primary mediums or industry experts, opinion leaders.

About Visionary Data Reports

Visionary Data Reports provides future-focused market research, advanced analytics, and strategic insights for technology, healthcare, green energy, and finance. Our reports help you anticipate trends, innovate, and lead in your industry. Our expert team combines primary research, data science, and industry knowledge to deliver actionable intelligence. We offer syndicated reports, custom analytics, and consulting services tailored to your business needs. At Visionary Data Reports, we are committed to quality, transparency, and client satisfaction. Every report is rigorously validated to ensure accuracy and relevance. Our global perspective and forward-thinking approach help you understand both current and emerging market dynamics.

Stay ahead with Visionary Data Reports. Subscribe to our newsletter for the latest insights and research highlights, and follow us on social media for real-time updates. Visionary Data Reports – Your Guide to Tomorrow’s Opportunities.

artwork spiralartwork spiralRelated Reports
artwork underline

Strategizing Growth: Asia Pacific Liquid Hydrogen Market Market’s Decade Ahead 2025-2033

The Asia-Pacific liquid hydrogen market is booming, projected to reach [Value from chart_data for 2033] million by 2033, driven by automotive, chemical, and aerospace sectors. Explore key trends, drivers, restraints, and leading companies in this rapidly expanding market.

August 2025
Base Year: 2024
No Of Pages: 234
Price: $4750

Energy Storage in United Kingdom Market Market Dynamics: Drivers and Barriers to Growth 2025-2033

Discover the booming UK energy storage market! This in-depth analysis reveals key trends, growth drivers, market size projections (2025-2033), leading companies, and regional insights. Learn about battery storage, pumped hydro, and other technologies shaping the UK's energy future.

August 2025
Base Year: 2024
No Of Pages: 197
Price: $3800

South America Intelligent Pigging Market Market’s Evolution: Key Growth Drivers 2025-2033

Discover the booming South American intelligent pigging market! This in-depth analysis reveals a CAGR exceeding 4%, driven by aging pipelines and stringent safety regulations. Learn about market trends, key players (Baker Hughes, Rosen Group), and future growth projections for oil & gas pipeline inspection.

August 2025
Base Year: 2024
No Of Pages: 234
Price: $4750

Solar Energy Market in Romania 2025-2033: Preparing for Growth and Change

Discover the booming Romanian solar energy market! This in-depth analysis reveals a CAGR of 18.50%, driven by government incentives, falling costs, and growing demand. Explore market size, key segments (residential, commercial, utility-scale), leading companies, and future trends until 2033.

August 2025
Base Year: 2024
No Of Pages: 197
Price: $3800

Oman Oil and Gas Pipeline Market Unlocking Growth Potential: 2025-2033 Analysis and Forecasts

Discover the booming Oman oil and gas pipeline market, projected to exceed $2.57 billion by 2033. Explore market drivers, trends, and key players shaping this dynamic sector's future. Learn about onshore vs. offshore segments, crude oil vs. gas pipelines, and investment opportunities in this high-growth region.

August 2025
Base Year: 2024
No Of Pages: 197
Price: $3800

Wind Turbine Refurbishment Industry Market Demand and Consumption Trends: Outlook 2025-2033

Booming wind turbine refurbishment market analysis reveals a CAGR exceeding 3.53%, driven by aging infrastructure and cost-effective maintenance. Explore key trends, regional insights, and leading companies shaping this multi-billion dollar industry's future in our comprehensive report.

August 2025
Base Year: 2024
No Of Pages: 234
Price: $4750

Power Quality Meter Industry Growth Forecast and Consumer Insights

Discover the booming power quality meter market! This comprehensive analysis reveals a CAGR of 7.40% through 2033, driven by industrial automation and renewable energy. Explore key players, regional trends, and market segmentation for informed business decisions.

August 2025
Base Year: 2024
No Of Pages: 234
Price: $4750

North America Distribution Transformer Industry Market Drivers and Challenges: Trends 2025-2033

The North American distribution transformer market is booming, projected to reach \$[insert projected 2033 value based on chart data] billion by 2033, driven by grid modernization, renewable energy integration, and smart grid technologies. Discover key trends, market segmentation, and leading players in this dynamic industry.

August 2025
Base Year: 2024
No Of Pages: 234
Price: $4750

France Nuclear Power Reactor Decommissioning Market Trends and Forecast 2025-2033

The France Nuclear Power Reactor Decommissioning market is experiencing robust growth (CAGR >4%), driven by aging reactors and stringent regulations. Explore market size, trends, key players (Orano SA, EDF), and future projections (2025-2033) in this comprehensive analysis.

August 2025
Base Year: 2024
No Of Pages: 197
Price: $3800

Brazil Oil and Gas Downstream Market Consumer Behavior Dynamics: Key Trends 2025-2033

Discover the booming Brazil oil and gas downstream market! Our in-depth analysis reveals a CAGR exceeding 5.13% through 2033, driven by automotive growth and biofuel initiatives. Explore market size, key players (Petrobras, Shell, ExxonMobil), and regional trends. Invest wisely in this dynamic sector.

August 2025
Base Year: 2024
No Of Pages: 197
Price: $3800

Japan Nuclear Power Reactor Decommissioning Market Analysis Uncovered: Market Drivers and Forecasts 2025-2033

Discover the booming Japan Nuclear Power Reactor Decommissioning market. Explore market size, CAGR, key drivers, trends, and challenges impacting this $1.5B+ sector, with insights into leading companies and regional analysis (2019-2033).

August 2025
Base Year: 2024
No Of Pages: 197
Price: $3800

North America Artificial Lift Systems Market Market’s Evolution: Key Growth Drivers 2025-2033

The North American Artificial Lift Systems market is booming, projected to exceed $3.8 billion by 2033, driven by surging oil & gas production and technological advancements in ESPs, PCPs, and gas lift systems. Learn about key market trends, leading companies, and regional insights in this comprehensive analysis.

August 2025
Base Year: 2024
No Of Pages: 234
Price: $4750

North America AI-Powered Energy Storage Market Unlocking Growth Potential: Analysis and Forecasts 2025-2033

Discover the explosive growth of the North American AI-powered energy storage market. This in-depth analysis reveals a CAGR of 46.35%, driven by renewable energy adoption, AI optimization, and key players like Tesla and BYD. Explore market trends, segmentation, and future projections for 2025-2033.

August 2025
Base Year: 2024
No Of Pages: 234
Price: $4750

Navigating India Petrol Station Market Market Trends: Competitor Analysis and Growth 2025-2033

Discover the booming India petrol station market! This comprehensive analysis reveals a ₹250 billion (USD 30 billion) market growing at a CAGR exceeding 5% until 2033, driven by rising vehicle ownership and economic growth. Learn about key players, regional trends, and future projections.

August 2025
Base Year: 2024
No Of Pages: 197
Price: $3800

France Wind Energy Market Growth Opportunities: Market Size Forecast to 2033

Discover the booming France wind energy market forecast to 2033! This in-depth analysis reveals a CAGR of 7.43%, driven by government initiatives and technological advancements. Explore key players, market segments (onshore & offshore), and growth challenges.

August 2025
Base Year: 2024
No Of Pages: 197
Price: $3800

APAC Offshore Support Market CAGR Trends: Growth Outlook 2025-2033

Discover the booming APAC offshore support vessel market, projected to exceed a massive valuation by 2033. Explore key drivers like renewable energy growth, regional economic expansion, and leading companies shaping this dynamic sector. Analyze market trends and future forecasts in this in-depth analysis.

August 2025
Base Year: 2024
No Of Pages: 234
Price: $4750

East Asia Battery Market Market’s Tech Revolution: Projections to 2033

Discover the explosive growth of the East Asia battery market! This comprehensive analysis reveals key trends, driving forces, and leading players shaping the future of EV, energy storage, and data center technologies in China, Japan, South Korea and beyond. Project your market strategies with our insightful forecast through 2033.

August 2025
Base Year: 2024
No Of Pages: 234
Price: $4750

Drill Pipe Industry Report Probes the XXX Million Size, Share, Growth Report and Future Analysis by 2033

Discover the booming drill pipe market! Explore its $XX million valuation, 4.5%+ CAGR, key drivers, regional insights (North America, Europe, Asia-Pacific), top players (NOV, TMK, Tenaris), and future trends in this comprehensive market analysis covering 2019-2033. Learn about onshore vs. offshore deployment and the impact of technological advancements.

August 2025
Base Year: 2024
No Of Pages: 234
Price: $4750

Renewable Energy Market in Germany Market Disruption: Competitor Insights and Trends 2025-2033

Discover the booming German renewable energy market! This in-depth analysis reveals a €5 billion (2025 estimate) market with a 7.27% CAGR, driven by strong government policies and technological advancements. Explore key players, regional trends, and growth projections for solar, wind, hydro, and bioenergy sectors until 2033.

August 2025
Base Year: 2024
No Of Pages: 197
Price: $3800

MEA Power Rental Industry Report Probes the XXX Million Size, Share, Growth Report and Future Analysis by 2033

Discover the booming MEA power rental market! Our analysis reveals a CAGR exceeding 9.68%, driven by infrastructure growth & energy demands. Explore key trends, segments (prime power, peak shaving, emergency standby), and leading companies shaping this dynamic industry. Learn more about market size, regional breakdown, and future projections.

August 2025
Base Year: 2024
No Of Pages: 234
Price: $4750

Thailand Oil and Gas Industry Market Report: Strategic Insights

Discover the future of Thailand's oil and gas industry. This in-depth market analysis reveals a steady growth trajectory (CAGR 2.33%), driven by industrial and transportation demands, while outlining challenges such as price volatility and the global shift towards renewables. Learn about key players, market segmentation, and regional trends.

August 2025
Base Year: 2024
No Of Pages: 197
Price: $3800

LNG as a Fuel Industry Strategic Insights: Analysis 2025 and Forecasts 2033

Discover the booming LNG as fuel market! This comprehensive analysis reveals key trends, drivers, and restraints, projecting a CAGR >8% through 2033. Explore regional market shares, leading companies, and the future of LNG in transportation and power generation.

August 2025
Base Year: 2024
No Of Pages: 234
Price: $4750

Exploring Opportunities in North Sea Offshore Helicopter Services Market Sector

Discover the booming North Sea Offshore Helicopter Services market. This in-depth analysis reveals key trends, growth drivers (offshore wind, oil & gas), and challenges for 2025-2033, including regional market share and leading companies like Airbus and Bristow. Explore market size, CAGR, and future projections for this vital sector.

August 2025
Base Year: 2024
No Of Pages: 234
Price: $4750

Polymer Photovoltaic Cell Market Market Expansion: Growth Outlook 2025-2033

The Polymer Photovoltaic Cell market is booming, with a projected CAGR of 21.40% to 2033. Discover key trends, drivers, and restraints shaping this dynamic sector, including insights into organic vs. inorganic materials, flexible vs. rigid form factors, and leading companies. Explore regional market shares and growth projections.

August 2025
Base Year: 2024
No Of Pages: 234
Price: $4750

Future Forecasts for Chile Renewable Energy Industry Industry Growth

Discover the booming Chilean renewable energy market! Explore its 9%+ CAGR, key drivers, leading companies (JinkoSolar, First Solar, Vestas), and segment analysis (solar, wind, hydro). Learn about market forecasts and investment opportunities in this rapidly expanding sector.

August 2025
Base Year: 2024
No Of Pages: 197
Price: $3800

North West Europe Diesel Generator Market Future-proof Strategies: Trends, Competitor Dynamics, and Opportunities 2025-2033

The North West Europe diesel generator market is booming, driven by industrial growth and the need for reliable backup power. Discover key trends, market size projections (2025-2033), leading companies, and regional breakdowns in this comprehensive market analysis. Explore growth drivers, restraints, and segment analysis (capacity, end-user, application) for this dynamic sector.

August 2025
Base Year: 2024
No Of Pages: 234
Price: $4750

Open Hole Logging Services Market Market Dynamics: Drivers and Barriers to Growth 2025-2033

The Open Hole Logging Services market is booming, projected to exceed $XX million by 2033 with a CAGR above 2%. Driven by technological advancements and rising demand for efficient subsurface data acquisition, this report analyzes market trends, key players (Schlumberger, Baker Hughes, Halliburton), regional growth, and future projections. Learn more about this lucrative sector.

August 2025
Base Year: 2024
No Of Pages: 234
Price: $4750

Strategic Analysis of United States Turbine Control Systems Market Industry Opportunities

Discover the booming US Turbine Control Systems market! This in-depth analysis reveals a CAGR exceeding 3.59%, driven by renewable energy integration and smart grid technologies. Learn about key players, market segments, and future growth projections for 2025-2033.

August 2025
Base Year: 2024
No Of Pages: 197
Price: $3800

Europe High Voltage Switchgear Market Industry’s Growth Dynamics and Insights

The European High Voltage Switchgear Market is booming, projected to reach €7.24 billion by 2033 with a CAGR of 8.71%. Driven by renewable energy integration and grid modernization, this market analysis reveals key trends, leading players (ABB, Siemens, Hitachi), and regional breakdowns. Learn more about this high-growth sector.

August 2025
Base Year: 2024
No Of Pages: 234
Price: $4750

UAE Power Market Growth Pathways: Strategic Analysis and Forecasts 2025-2033

Discover the booming UAE power market forecast to 2033! This comprehensive analysis reveals a CAGR of 4.20%, driven by renewable energy investments, economic diversification, and key players like DEWA and TAQA. Explore market size, segmentation, and future trends.

August 2025
Base Year: 2024
No Of Pages: 197
Price: $3800

United Arab Emirates Solar Photovoltaic (PV) Market Projected to Grow at XX CAGR: Insights and Forecasts 2025-2033

Discover the booming UAE solar PV market! Our analysis reveals impressive growth projections exceeding 12% CAGR, driven by government initiatives and rising sustainability concerns. Explore market size, segmentation, key players, and future trends in this in-depth report.

August 2025
Base Year: 2024
No Of Pages: 197
Price: $3800

Understanding Canada Waste to Energy Market Trends and Growth Dynamics

Discover the booming Canadian waste-to-energy market. This comprehensive analysis reveals key trends, technologies (incineration, gasification, pyrolysis), regional growth projections (Eastern, Western, Central Canada), and top companies driving innovation from 2025-2033. Learn about the market size, CAGR, and investment opportunities.

August 2025
Base Year: 2024
No Of Pages: 197
Price: $3800

Electricity Market in Spain Growth Opportunities and Market Forecast 2025-2033: A Strategic Analysis

Discover the booming Spanish electricity market! This in-depth analysis reveals a CAGR of 12.89%, driven by renewable energy adoption and surging demand. Learn about key players, market segments, and future growth projections to 2033. Explore the opportunities and challenges facing this dynamic sector.

August 2025
Base Year: 2024
No Of Pages: 197
Price: $3800

Europe Low Voltage Switchgear Market Charting Growth Trajectories: Analysis and Forecasts 2025-2033

The European low-voltage switchgear market is booming, driven by smart grid modernization, renewable energy integration, and industrial automation. Discover key market trends, growth projections (CAGR >6%), major players (ABB, Siemens, Schneider Electric), and regional insights in our comprehensive analysis.

August 2025
Base Year: 2024
No Of Pages: 234
Price: $4750

North America Gas Insulated Switchgear Market Report: Trends and Forecasts 2025-2033

The North American Gas Insulated Switchgear (GIS) market is booming, with a CAGR exceeding 6%! This comprehensive analysis explores market size, key drivers (renewable energy, smart grids), trends, restraints, and leading companies like Siemens, Schneider Electric, and GE. Discover growth projections to 2033 and regional breakdowns.

August 2025
Base Year: 2024
No Of Pages: 197
Price: $3800

Europe Solar PV Inverters Market Unlocking Growth Potential: Analysis and Forecasts 2025-2033

The European solar PV inverter market is booming, with a CAGR exceeding 6%! Discover key trends, growth drivers, leading companies, and regional insights in this comprehensive market analysis covering residential, commercial, and utility-scale applications. Learn about the rise of microinverters and the future of solar energy in Europe.

August 2025
Base Year: 2024
No Of Pages: 234
Price: $4750

China Bunker Fuel Market Market Demand Dynamics: Insights 2025-2033

Discover the booming China bunker fuel market forecast to 2033! This comprehensive analysis reveals market size, CAGR, key drivers (maritime trade, environmental regulations), restraints (oil price volatility, economic fluctuations), and leading companies. Explore market segmentation by fuel type (HSFO, VLSFO, MGO) and vessel type.

August 2025
Base Year: 2024
No Of Pages: 197
Price: $3800

United Kingdom Midstream Oil and Gas Software Industry XX CAGR Growth to Drive Market Size to XXX Million by 2033

Discover the booming UK midstream oil & gas software market! Our analysis reveals a projected £500 million market by 2033, driven by digitalization and regulatory compliance. Learn about market size, growth trends, and key drivers shaping this dynamic sector.

August 2025
Base Year: 2024
No Of Pages: 197
Price: $3800

China Electric Vehicle Battery Materials Market Future Forecasts: Insights and Trends to 2033

China's electric vehicle battery materials market is booming, projected to reach $37.85 billion by 2033, driven by soaring EV sales and government support. Learn about key market trends, leading companies like CATL and BYD, and the challenges facing this rapidly expanding sector.

August 2025
Base Year: 2024
No Of Pages: 197
Price: $3800

MEA Combined Heat & Power Industry Comprehensive Market Study: Trends and Predictions 2025-2033

The MEA Combined Heat & Power (CHP) market is booming, projected to exceed a 5.10% CAGR through 2033. Driven by industrialization, government policies, and rising energy costs, this market offers significant opportunities across the UAE, Saudi Arabia, and South Africa. Discover key trends, regional breakdowns, and leading companies shaping this dynamic sector.

August 2025
Base Year: 2024
No Of Pages: 234
Price: $4750

Market Deep Dive: Exploring North America Drilling Market Trends 2025-2033

Discover the booming North American microgrid market! This in-depth analysis reveals key trends, drivers, and restraints impacting the growth of custom microgrids, remote power systems, and more, with a focus on institutional, commercial, and off-grid applications. Explore market size projections, leading companies, and regional insights through 2033.

August 2025
Base Year: 2024
No Of Pages: 234
Price: $4750

Malaysia Refined Petroleum Products Market 2025-2033 Analysis: Trends, Competitor Dynamics, and Growth Opportunities

Discover the booming Malaysia Refined Petroleum Products Market, projected to reach \$24 billion by 2033 with a 5.9% CAGR. This in-depth analysis covers market drivers, trends, restraints, key players (Petronas, Shell, Chevron), and regional insights. Learn how transportation, industrial, and power generation fuel demand shapes this dynamic market.

August 2025
Base Year: 2024
No Of Pages: 197
Price: $3800

North America Industrial Centrifuge Market Unlocking Growth Potential: Analysis and Forecasts 2025-2033

Discover the booming North America industrial centrifuge market! This comprehensive analysis reveals key trends, growth drivers (food & beverage, pharma, wastewater), leading companies (GEA, Alfa Laval, Flottweg), and projected market size to 2033. Learn about segmentation by operation mode, industry, and design.

August 2025
Base Year: 2024
No Of Pages: 234
Price: $4750

US Natural Gas Market Soars to XXX Million, witnessing a CAGR of XX during the forecast period 2025-2033

The US natural gas market is booming, projected to exceed a CAGR of 5% through 2033. This comprehensive analysis explores market drivers, trends, restraints, key players (Occidental Petroleum, Shell, ExxonMobil, etc.), and regional breakdowns (Northeast, Southeast, etc.), providing insights for investors and industry professionals. Discover future growth projections and understand the evolving landscape of this vital energy sector.

August 2025
Base Year: 2024
No Of Pages: 197
Price: $3800

Strategic Growth Drivers for Europe Advanced Biofuel Market Market

Discover the booming Europe advanced biofuel market! This in-depth analysis reveals key trends, drivers, and restraints shaping this dynamic sector, including leading companies, regional growth forecasts, and market size projections through 2033. Learn about the impact of sustainable transportation policies and technological advancements on the future of biofuels in Europe.

August 2025
Base Year: 2024
No Of Pages: 234
Price: $4750

Exploring Key Trends in Top Drive Drilling Industry Market

The Top Drive Drilling market is booming, with a CAGR exceeding 4.5%! This comprehensive analysis explores market size, key players (Aker Solutions, CNPC, Nabors Industries), regional trends (North America, Asia Pacific), and future growth projections for electric and hydraulic top drives in onshore and offshore drilling. Discover the latest insights and forecasts for 2025-2033.

August 2025
Base Year: 2024
No Of Pages: 234
Price: $4750

Power Plant Control System Market Market’s Consumer Insights and Trends

The Power Plant Control System market is booming, projected to reach $XX million by 2033, driven by renewable energy adoption, aging infrastructure upgrades, and smart grid integration. Learn about key market trends, leading companies (Rockwell Automation, Honeywell, ABB), and regional growth forecasts in this comprehensive analysis.

August 2025
Base Year: 2024
No Of Pages: 234
Price: $4750

Unlocking the Future of Lithium-Air Battery Industry: Growth and Trends 2025-2033

Discover the booming lithium-air battery market! This in-depth analysis reveals a CAGR exceeding 5.50%, driven by EV adoption and consumer electronics. Explore market size, trends, key players (Tesla, Lithium Air Industries), and regional insights for 2025-2033. Invest wisely in this high-growth sector.

August 2025
Base Year: 2024
No Of Pages: 234
Price: $4750

North America Battery Manufacturing Equipment Market Decoded: Comprehensive Analysis and Forecasts 2025-2033

The North American battery manufacturing equipment market is booming, projected to reach $2.15 billion by 2033 with a 20% CAGR. Driven by EV adoption and government incentives, this report analyzes market size, key players (Dürr AG, Hitachi Ltd., etc.), and segment trends for coating, calendaring, and more. Learn more!

August 2025
Base Year: 2024
No Of Pages: 180
Price: $4750

South America Oil And Gas Hoses And Coupling Market 2025-2033 Overview: Trends, Competitor Dynamics, and Opportunities

Discover the booming South American oil and gas hoses and couplings market. Learn about its impressive CAGR, key drivers, major players (Trelleborg, Parker Hannifin, etc.), and regional insights (Brazil, Argentina). Explore market forecasts and trends until 2033.

August 2025
Base Year: 2024
No Of Pages: 180
Price: $4750
  • Home
  • About Us
  • Industries
    • Aerospace & Defense
    • Agriculture
    • Animal Nutrition & Wellness
    • Automotive
    • Chemicals & Materials
    • Consumer Goods and Services
    • Energy & Power
    • Financial Services and Investment Intelligence
    • Food & Beverage
    • Home and Property Improvement
    • Hospitality and Tourism
    • Logistics
    • Manufacturing Products and Services
    • Packaging
    • Professional and Commercial Services
    • Real Estate and Construction
    • Retail
    • Technology, Media and Telecom
    • Healthcare
  • Services
  • Contact
Main Logo
  • Home
  • About Us
  • Industries
    • Aerospace & Defense
    • Agriculture
    • Animal Nutrition & Wellness
    • Automotive
    • Chemicals & Materials
    • Consumer Goods and Services
    • Energy & Power
    • Financial Services and Investment Intelligence
    • Food & Beverage
    • Home and Property Improvement
    • Hospitality and Tourism
    • Logistics
    • Manufacturing Products and Services
    • Packaging
    • Professional and Commercial Services
    • Real Estate and Construction
    • Retail
    • Technology, Media and Telecom
    • Healthcare
  • Services
  • Contact
+17162654855
[email protected]

+17162654855

[email protected]

Business Address

Head Office

Ansec House 3 rd floor Tank Road, Yerwada, Pune, Maharashtra 411014

Contact Information

Craig Francis

Business Development Head

+17162654855

[email protected]

Secure Payment Partners

payment image
RetailLogisticsPackagingAutomotiveHealthcareAgricultureEnergy & PowerFood & BeverageAerospace & DefenseChemicals & MaterialsHospitality and TourismAnimal Nutrition & WellnessConsumer Goods and ServicesReal Estate and ConstructionHome and Property ImprovementTechnology, Media and TelecomManufacturing Products and ServicesFinancial Services and Investment Intelligence

© 2025 PRDUA Research & Media Private Limited, All rights reserved

Privacy Policy
Terms and Conditions
FAQ