Industrial Demand Response Management Systems Market 2025-2033 Overview: Trends, Competitor Dynamics, and Opportunities

Industrial Demand Response Management Systems Market by Type (Conventional Demand Response, Automated Demand Response), by North America (United States, Canada, Rest of North America), by Asia Pacific (China, India, Japan, Australia, Malaysia, Thailand, Indonesia, Vietnam, Rest of Asia pacific), by Europe (Germany, France, United Kingdom, Italy, Spain, Nordic, Turkey, Russia, Rest of Europe), by South America (Brazil, Argentina, Chile, Colombia, Rest of South America), by Middle East and Africa (Saudi Arabia, United Arab Emirates, South Africa, Qatar, Egypt, Nigeria, Rest of Middle East) Forecast 2025-2033

Jul 2 2025
Base Year: 2024

234 Pages
Main Logo

Industrial Demand Response Management Systems Market 2025-2033 Overview: Trends, Competitor Dynamics, and Opportunities


Home
Industries
Energy & Power
sponsor image
sponsor image
sponsor image
sponsor image
sponsor image

Tailored for you

  • In-depth Analysis Tailored to Specified Regions or Segments
  • Company Profiles Customized to User Preferences
  • Comprehensive Insights Focused on Specific Segments or Regions
  • Customized Evaluation of Competitive Landscape to Meet Your Needs
  • Tailored Customization to Address Other Specific Requirements
Ask for customization


Key Insights

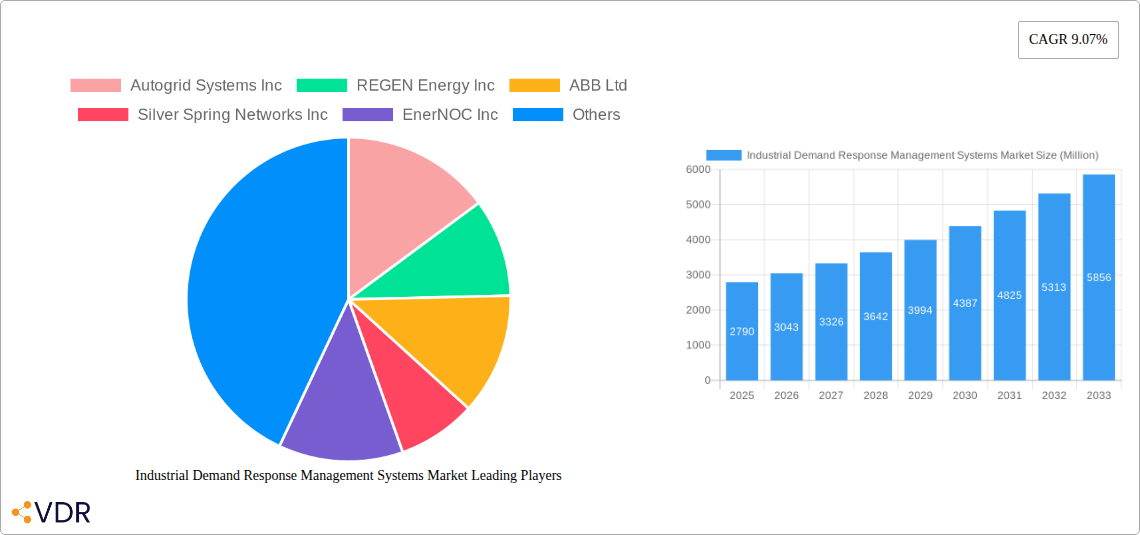
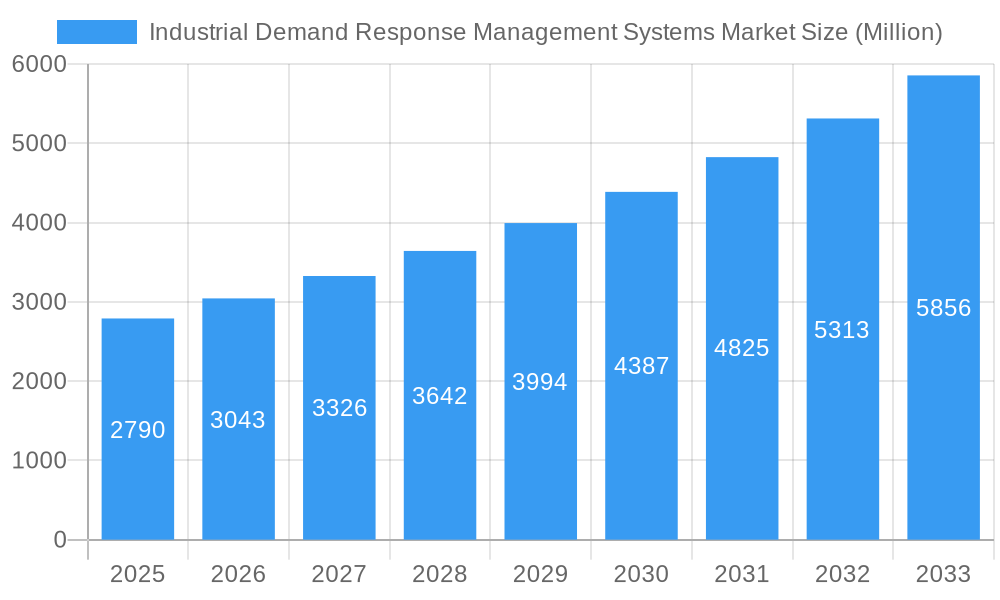
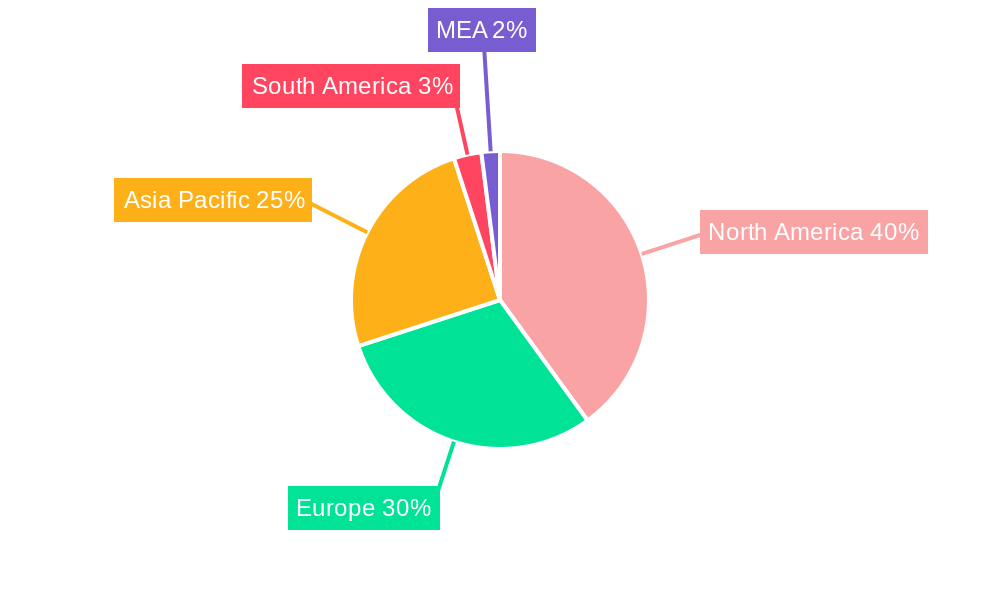
The Industrial Demand Response Management Systems (IDRMS) market is experiencing robust growth, projected to reach \$2.79 billion in 2025 and exhibiting a Compound Annual Growth Rate (CAGR) of 9.07% from 2025 to 2033. This expansion is driven by several key factors. Increasing energy costs and the growing need for energy efficiency within industrial settings are primary motivators. Furthermore, the rising adoption of smart grids and the integration of advanced technologies like artificial intelligence (AI) and machine learning (ML) in IDRMS are significantly boosting market growth. Stringent government regulations aimed at reducing carbon emissions and promoting sustainable energy practices are also creating a favorable regulatory environment for IDRMS adoption. The market is segmented into conventional and automated demand response systems, with the latter witnessing faster growth due to its enhanced capabilities in optimizing energy consumption and reducing operational costs. North America currently holds a significant market share, driven by early adoption and strong technological advancements. However, Asia-Pacific is expected to show substantial growth in the coming years, fueled by rapid industrialization and increasing energy demands in countries like China and India.

The competitive landscape is marked by the presence of both established players like ABB, Siemens, and Schneider Electric, and emerging technology providers like Autogrid Systems and REGEN Energy. These companies are constantly innovating to offer advanced solutions that cater to the diverse needs of industrial sectors, including manufacturing, data centers, and heavy industries. Competition is intensifying as companies strive to enhance their product offerings through strategic partnerships, mergers, and acquisitions. Future growth will be influenced by advancements in energy storage technologies, the development of more sophisticated analytics capabilities for predictive energy management, and the increasing integration of IDRMS with other industrial automation systems. Challenges remain, however, including the high initial investment cost associated with implementing IDRMS and the need for robust cybersecurity measures to protect sensitive industrial data.

Industrial Demand Response Management Systems Market Research Report - Market Size, Growth & Forecast

Industrial Demand Response Management Systems Market: A Comprehensive Report (2019-2033)

This in-depth report provides a comprehensive analysis of the Industrial Demand Response Management Systems market, encompassing market dynamics, growth trends, regional analysis, product landscape, key drivers and challenges, emerging opportunities, growth accelerators, key players, notable milestones, and future outlook. The report covers the period from 2019 to 2033, with 2025 as the base year and forecast period spanning 2025-2033. The parent market is the broader Energy Management Systems market, while the child market is specifically Industrial Demand Response Management Systems. Market values are presented in million units.

Industrial Demand Response Management Systems Market Market Dynamics & Structure

The Industrial Demand Response Management Systems market is experiencing significant growth driven by increasing energy costs, stringent environmental regulations, and the need for enhanced grid stability. Market concentration is moderately high, with a few major players holding significant market share, but with a landscape increasingly populated by smaller, specialized firms. Technological innovation, particularly in areas like AI-driven optimization and IoT integration, is a key driver. Regulatory frameworks, including government incentives and mandates for energy efficiency, play a crucial role in shaping market adoption. Competitive substitutes include traditional energy management approaches, but the benefits of demand response are increasingly favored. End-user demographics are diverse, encompassing manufacturing, data centers, and other energy-intensive industries. The market has seen several M&A activities in recent years, resulting in consolidation and technological advancements.

  • Market Concentration: Moderately high, with top 5 players holding approximately xx% market share (2024).
  • Technological Innovation: Rapid advancements in AI, machine learning, and IoT are driving the development of sophisticated demand response solutions.
  • Regulatory Framework: Stringent environmental regulations and government incentives are boosting market growth.
  • Competitive Substitutes: Traditional energy management practices are facing increasing competition from intelligent demand response solutions.
  • End-User Demographics: Manufacturing, data centers, and other energy-intensive industries are key end-users.
  • M&A Trends: xx M&A deals were recorded in the period 2019-2024, primarily driven by technology integration and market expansion strategies.

Industrial Demand Response Management Systems Market Growth Trends & Insights

The Industrial Demand Response Management Systems market is projected to exhibit a robust Compound Annual Growth Rate (CAGR) of xx% during the forecast period (2025-2033). Market size is expected to reach xx million units by 2033, driven by factors including rising energy prices, the increasing integration of renewable energy sources (requiring grid stability solutions), and growing awareness of sustainability among businesses. Adoption rates are accelerating, especially in developed regions with advanced infrastructure and supportive regulatory frameworks. Technological disruptions, including the advent of advanced analytics and cloud-based platforms, are further enhancing the efficiency and effectiveness of demand response systems. Consumer behavior is shifting towards greater energy consciousness, which is encouraging adoption of energy-saving technologies, including demand response management systems. Market penetration is expected to increase significantly in emerging economies with developing industrial sectors.

Industrial Demand Response Management Systems Market Growth

Dominant Regions, Countries, or Segments in Industrial Demand Response Management Systems Market

North America currently holds the largest market share, primarily due to strong government support, advanced infrastructure, and high adoption rates in energy-intensive industries. Europe follows closely, with substantial growth anticipated in Asia-Pacific. Within the segments, the Automated Demand Response segment is experiencing faster growth compared to the Conventional Demand Response segment, attributed to its increased efficiency and ability to optimize energy consumption in real-time.

  • North America: High adoption rates driven by supportive government policies and energy-intensive industries.
  • Europe: Strong growth expected due to increasing energy prices and environmental regulations.
  • Asia-Pacific: Rapid industrialization and rising energy demand are driving market expansion.
  • Automated Demand Response: Faster growth driven by advanced features and real-time optimization capabilities.
  • Conventional Demand Response: Significant market share, but slower growth compared to automated solutions.

Industrial Demand Response Management Systems Market Product Landscape

The Industrial Demand Response Management Systems market offers a range of products, including hardware (sensors, controllers, communication gateways), software (monitoring and control platforms, analytics tools), and services (installation, integration, and maintenance). Product innovations focus on enhancing energy efficiency, improving grid stability, and enabling seamless integration with existing infrastructure. Key performance metrics include energy savings, grid stability improvements, and return on investment (ROI). Unique selling propositions frequently center around ease of implementation, advanced analytics capabilities, and integration with other energy management systems. Technological advancements include AI-powered predictive analytics and improved communication protocols for enhanced system performance.

Key Drivers, Barriers & Challenges in Industrial Demand Response Management Systems Market

Key Drivers:

  • Rising energy costs and increasing energy security concerns.
  • Growing adoption of renewable energy sources that require better grid management.
  • Stringent environmental regulations and government incentives for energy efficiency.

Challenges and Restraints:

  • High initial investment costs can hinder adoption, especially among smaller businesses.
  • Lack of awareness and understanding of demand response technology among some industrial stakeholders.
  • Cybersecurity risks associated with the interconnected nature of these systems. Approximately xx% of deployments have experienced minor security breaches in 2024.

Emerging Opportunities in Industrial Demand Response Management Systems Market

  • Expanding into developing economies with rapidly growing industrial sectors.
  • Integrating demand response systems with other energy management solutions for comprehensive energy optimization.
  • Developing customized solutions tailored to the specific needs of different industrial sectors.

Growth Accelerators in the Industrial Demand Response Management Systems Market Industry

Technological advancements, including the development of advanced analytics and machine learning algorithms, are significant growth catalysts. Strategic partnerships between energy providers and technology companies are driving innovation and market penetration. Expansion into new markets and applications, particularly in sectors with high energy consumption, will contribute to significant growth.

Key Players Shaping the Industrial Demand Response Management Systems Market Market

  • Autogrid Systems Inc
  • REGEN Energy Inc
  • ABB Ltd
  • Silver Spring Networks Inc
  • EnerNOC Inc
  • Hitachi Ltd
  • Mitsubishi Electric Corporation
  • Siemens AG
  • Alstom SA
  • Schneider Electric SE
  • Eaton Corporation PLC
  • General Electric Company

Notable Milestones in Industrial Demand Response Management Systems Market Sector

  • June 2023: Vertiv launched its Vertiv EnerSav service, offering cost savings through targeted energy reduction and avoiding infrastructure investments via on-site assessments and gap analyses. Their EDD-RT technology further optimizes consumption dynamically.
  • July 2023: CPower Energy and OBM partnered to integrate CPower's EnerWise into Foreman's mining platform, enhancing demand response functionality and maximizing revenue for Foreman's customers.
  • October 2023: Google tested a demand-response system for data centers in Taiwan, Oregon, and Europe, aiming to reduce electricity consumption during grid stress by shifting non-urgent tasks.

In-Depth Industrial Demand Response Management Systems Market Market Outlook

The Industrial Demand Response Management Systems market is poised for significant expansion, driven by technological advancements, growing environmental awareness, and supportive government policies. Strategic partnerships and market expansion into new sectors present considerable opportunities for growth. The long-term outlook is positive, indicating a substantial increase in market size and penetration over the next decade.

Industrial Demand Response Management Systems Market Segmentation

  • 1. Type
    • 1.1. Conventional Demand Response
    • 1.2. Automated Demand Response

Industrial Demand Response Management Systems Market Segmentation By Geography

  • 1. North America
    • 1.1. United States
    • 1.2. Canada
    • 1.3. Rest of North America
  • 2. Asia Pacific
    • 2.1. China
    • 2.2. India
    • 2.3. Japan
    • 2.4. Australia
    • 2.5. Malaysia
    • 2.6. Thailand
    • 2.7. Indonesia
    • 2.8. Vietnam
    • 2.9. Rest of Asia pacific
  • 3. Europe
    • 3.1. Germany
    • 3.2. France
    • 3.3. United Kingdom
    • 3.4. Italy
    • 3.5. Spain
    • 3.6. Nordic
    • 3.7. Turkey
    • 3.8. Russia
    • 3.9. Rest of Europe
  • 4. South America
    • 4.1. Brazil
    • 4.2. Argentina
    • 4.3. Chile
    • 4.4. Colombia
    • 4.5. Rest of South America
  • 5. Middle East and Africa
    • 5.1. Saudi Arabia
    • 5.2. United Arab Emirates
    • 5.3. South Africa
    • 5.4. Qatar
    • 5.5. Egypt
    • 5.6. Nigeria
    • 5.7. Rest of Middle East
Industrial Demand Response Management Systems Market Regional Share


Industrial Demand Response Management Systems Market REPORT HIGHLIGHTS

AspectsDetails
Study Period 2019-2033
Base Year 2024
Estimated Year 2025
Forecast Period2025-2033
Historical Period2019-2024
Growth RateCAGR of 9.07% from 2019-2033
Segmentation
    • By Type
      • Conventional Demand Response
      • Automated Demand Response
  • By Geography
    • North America
      • United States
      • Canada
      • Rest of North America
    • Asia Pacific
      • China
      • India
      • Japan
      • Australia
      • Malaysia
      • Thailand
      • Indonesia
      • Vietnam
      • Rest of Asia pacific
    • Europe
      • Germany
      • France
      • United Kingdom
      • Italy
      • Spain
      • Nordic
      • Turkey
      • Russia
      • Rest of Europe
    • South America
      • Brazil
      • Argentina
      • Chile
      • Colombia
      • Rest of South America
    • Middle East and Africa
      • Saudi Arabia
      • United Arab Emirates
      • South Africa
      • Qatar
      • Egypt
      • Nigeria
      • Rest of Middle East


Table of Contents

  1. 1. Introduction
    • 1.1. Research Scope
    • 1.2. Market Segmentation
    • 1.3. Research Methodology
    • 1.4. Definitions and Assumptions
  2. 2. Executive Summary
    • 2.1. Introduction
  3. 3. Market Dynamics
    • 3.1. Introduction
      • 3.2. Market Drivers
        • 3.2.1. 4.; Need for Efficient Energy Management Systems4.; Growing Penetration of Renewable Energy Sources
      • 3.3. Market Restrains
        • 3.3.1. 4.; Privacy Concerns on the Industrial Demand Response Management Systems
      • 3.4. Market Trends
        • 3.4.1. Growing Penetration of Renewable Energy Sources to Drive the Market
  4. 4. Market Factor Analysis
    • 4.1. Porters Five Forces
    • 4.2. Supply/Value Chain
    • 4.3. PESTEL analysis
    • 4.4. Market Entropy
    • 4.5. Patent/Trademark Analysis
  5. 5. Global Industrial Demand Response Management Systems Market Analysis, Insights and Forecast, 2019-2031
    • 5.1. Market Analysis, Insights and Forecast - by Type
      • 5.1.1. Conventional Demand Response
      • 5.1.2. Automated Demand Response
    • 5.2. Market Analysis, Insights and Forecast - by Region
      • 5.2.1. North America
      • 5.2.2. Asia Pacific
      • 5.2.3. Europe
      • 5.2.4. South America
      • 5.2.5. Middle East and Africa
  6. 6. North America Industrial Demand Response Management Systems Market Analysis, Insights and Forecast, 2019-2031
    • 6.1. Market Analysis, Insights and Forecast - by Type
      • 6.1.1. Conventional Demand Response
      • 6.1.2. Automated Demand Response
  7. 7. Asia Pacific Industrial Demand Response Management Systems Market Analysis, Insights and Forecast, 2019-2031
    • 7.1. Market Analysis, Insights and Forecast - by Type
      • 7.1.1. Conventional Demand Response
      • 7.1.2. Automated Demand Response
  8. 8. Europe Industrial Demand Response Management Systems Market Analysis, Insights and Forecast, 2019-2031
    • 8.1. Market Analysis, Insights and Forecast - by Type
      • 8.1.1. Conventional Demand Response
      • 8.1.2. Automated Demand Response
  9. 9. South America Industrial Demand Response Management Systems Market Analysis, Insights and Forecast, 2019-2031
    • 9.1. Market Analysis, Insights and Forecast - by Type
      • 9.1.1. Conventional Demand Response
      • 9.1.2. Automated Demand Response
  10. 10. Middle East and Africa Industrial Demand Response Management Systems Market Analysis, Insights and Forecast, 2019-2031
    • 10.1. Market Analysis, Insights and Forecast - by Type
      • 10.1.1. Conventional Demand Response
      • 10.1.2. Automated Demand Response
  11. 11. North America Industrial Demand Response Management Systems Market Analysis, Insights and Forecast, 2019-2031
      • 11.1. Market Analysis, Insights and Forecast - By Country/Sub-region
        • 11.1.1 United States
        • 11.1.2 Canada
        • 11.1.3 Mexico
  12. 12. Europe Industrial Demand Response Management Systems Market Analysis, Insights and Forecast, 2019-2031
      • 12.1. Market Analysis, Insights and Forecast - By Country/Sub-region
        • 12.1.1 Germany
        • 12.1.2 United Kingdom
        • 12.1.3 France
        • 12.1.4 Spain
        • 12.1.5 Italy
        • 12.1.6 Spain
        • 12.1.7 Belgium
        • 12.1.8 Netherland
        • 12.1.9 Nordics
        • 12.1.10 Rest of Europe
  13. 13. Asia Pacific Industrial Demand Response Management Systems Market Analysis, Insights and Forecast, 2019-2031
      • 13.1. Market Analysis, Insights and Forecast - By Country/Sub-region
        • 13.1.1 China
        • 13.1.2 Japan
        • 13.1.3 India
        • 13.1.4 South Korea
        • 13.1.5 Southeast Asia
        • 13.1.6 Australia
        • 13.1.7 Indonesia
        • 13.1.8 Phillipes
        • 13.1.9 Singapore
        • 13.1.10 Thailandc
        • 13.1.11 Rest of Asia Pacific
  14. 14. South America Industrial Demand Response Management Systems Market Analysis, Insights and Forecast, 2019-2031
      • 14.1. Market Analysis, Insights and Forecast - By Country/Sub-region
        • 14.1.1 Brazil
        • 14.1.2 Argentina
        • 14.1.3 Peru
        • 14.1.4 Chile
        • 14.1.5 Colombia
        • 14.1.6 Ecuador
        • 14.1.7 Venezuela
        • 14.1.8 Rest of South America
  15. 15. MEA Industrial Demand Response Management Systems Market Analysis, Insights and Forecast, 2019-2031
      • 15.1. Market Analysis, Insights and Forecast - By Country/Sub-region
        • 15.1.1 United Arab Emirates
        • 15.1.2 Saudi Arabia
        • 15.1.3 South Africa
        • 15.1.4 Rest of Middle East and Africa
  16. 16. Competitive Analysis
    • 16.1. Global Market Share Analysis 2024
      • 16.2. Company Profiles
        • 16.2.1 Autogrid Systems Inc
          • 16.2.1.1. Overview
          • 16.2.1.2. Products
          • 16.2.1.3. SWOT Analysis
          • 16.2.1.4. Recent Developments
          • 16.2.1.5. Financials (Based on Availability)
        • 16.2.2 REGEN Energy Inc
          • 16.2.2.1. Overview
          • 16.2.2.2. Products
          • 16.2.2.3. SWOT Analysis
          • 16.2.2.4. Recent Developments
          • 16.2.2.5. Financials (Based on Availability)
        • 16.2.3 ABB Ltd
          • 16.2.3.1. Overview
          • 16.2.3.2. Products
          • 16.2.3.3. SWOT Analysis
          • 16.2.3.4. Recent Developments
          • 16.2.3.5. Financials (Based on Availability)
        • 16.2.4 Silver Spring Networks Inc
          • 16.2.4.1. Overview
          • 16.2.4.2. Products
          • 16.2.4.3. SWOT Analysis
          • 16.2.4.4. Recent Developments
          • 16.2.4.5. Financials (Based on Availability)
        • 16.2.5 EnerNOC Inc
          • 16.2.5.1. Overview
          • 16.2.5.2. Products
          • 16.2.5.3. SWOT Analysis
          • 16.2.5.4. Recent Developments
          • 16.2.5.5. Financials (Based on Availability)
        • 16.2.6 Hitachi Ltd
          • 16.2.6.1. Overview
          • 16.2.6.2. Products
          • 16.2.6.3. SWOT Analysis
          • 16.2.6.4. Recent Developments
          • 16.2.6.5. Financials (Based on Availability)
        • 16.2.7 Mitsubishi Electric Corporation
          • 16.2.7.1. Overview
          • 16.2.7.2. Products
          • 16.2.7.3. SWOT Analysis
          • 16.2.7.4. Recent Developments
          • 16.2.7.5. Financials (Based on Availability)
        • 16.2.8 Siemens AG
          • 16.2.8.1. Overview
          • 16.2.8.2. Products
          • 16.2.8.3. SWOT Analysis
          • 16.2.8.4. Recent Developments
          • 16.2.8.5. Financials (Based on Availability)
        • 16.2.9 Alstom SA
          • 16.2.9.1. Overview
          • 16.2.9.2. Products
          • 16.2.9.3. SWOT Analysis
          • 16.2.9.4. Recent Developments
          • 16.2.9.5. Financials (Based on Availability)
        • 16.2.10 Schneider Electric SE
          • 16.2.10.1. Overview
          • 16.2.10.2. Products
          • 16.2.10.3. SWOT Analysis
          • 16.2.10.4. Recent Developments
          • 16.2.10.5. Financials (Based on Availability)
        • 16.2.11 Eaton Corporation PLC
          • 16.2.11.1. Overview
          • 16.2.11.2. Products
          • 16.2.11.3. SWOT Analysis
          • 16.2.11.4. Recent Developments
          • 16.2.11.5. Financials (Based on Availability)
        • 16.2.12 General Electric Company
          • 16.2.12.1. Overview
          • 16.2.12.2. Products
          • 16.2.12.3. SWOT Analysis
          • 16.2.12.4. Recent Developments
          • 16.2.12.5. Financials (Based on Availability)

List of Figures

  1. Figure 1: Global Industrial Demand Response Management Systems Market Revenue Breakdown (Million, %) by Region 2024 & 2032
  2. Figure 2: North America Industrial Demand Response Management Systems Market Revenue (Million), by Country 2024 & 2032
  3. Figure 3: North America Industrial Demand Response Management Systems Market Revenue Share (%), by Country 2024 & 2032
  4. Figure 4: Europe Industrial Demand Response Management Systems Market Revenue (Million), by Country 2024 & 2032
  5. Figure 5: Europe Industrial Demand Response Management Systems Market Revenue Share (%), by Country 2024 & 2032
  6. Figure 6: Asia Pacific Industrial Demand Response Management Systems Market Revenue (Million), by Country 2024 & 2032
  7. Figure 7: Asia Pacific Industrial Demand Response Management Systems Market Revenue Share (%), by Country 2024 & 2032
  8. Figure 8: South America Industrial Demand Response Management Systems Market Revenue (Million), by Country 2024 & 2032
  9. Figure 9: South America Industrial Demand Response Management Systems Market Revenue Share (%), by Country 2024 & 2032
  10. Figure 10: MEA Industrial Demand Response Management Systems Market Revenue (Million), by Country 2024 & 2032
  11. Figure 11: MEA Industrial Demand Response Management Systems Market Revenue Share (%), by Country 2024 & 2032
  12. Figure 12: North America Industrial Demand Response Management Systems Market Revenue (Million), by Type 2024 & 2032
  13. Figure 13: North America Industrial Demand Response Management Systems Market Revenue Share (%), by Type 2024 & 2032
  14. Figure 14: North America Industrial Demand Response Management Systems Market Revenue (Million), by Country 2024 & 2032
  15. Figure 15: North America Industrial Demand Response Management Systems Market Revenue Share (%), by Country 2024 & 2032
  16. Figure 16: Asia Pacific Industrial Demand Response Management Systems Market Revenue (Million), by Type 2024 & 2032
  17. Figure 17: Asia Pacific Industrial Demand Response Management Systems Market Revenue Share (%), by Type 2024 & 2032
  18. Figure 18: Asia Pacific Industrial Demand Response Management Systems Market Revenue (Million), by Country 2024 & 2032
  19. Figure 19: Asia Pacific Industrial Demand Response Management Systems Market Revenue Share (%), by Country 2024 & 2032
  20. Figure 20: Europe Industrial Demand Response Management Systems Market Revenue (Million), by Type 2024 & 2032
  21. Figure 21: Europe Industrial Demand Response Management Systems Market Revenue Share (%), by Type 2024 & 2032
  22. Figure 22: Europe Industrial Demand Response Management Systems Market Revenue (Million), by Country 2024 & 2032
  23. Figure 23: Europe Industrial Demand Response Management Systems Market Revenue Share (%), by Country 2024 & 2032
  24. Figure 24: South America Industrial Demand Response Management Systems Market Revenue (Million), by Type 2024 & 2032
  25. Figure 25: South America Industrial Demand Response Management Systems Market Revenue Share (%), by Type 2024 & 2032
  26. Figure 26: South America Industrial Demand Response Management Systems Market Revenue (Million), by Country 2024 & 2032
  27. Figure 27: South America Industrial Demand Response Management Systems Market Revenue Share (%), by Country 2024 & 2032
  28. Figure 28: Middle East and Africa Industrial Demand Response Management Systems Market Revenue (Million), by Type 2024 & 2032
  29. Figure 29: Middle East and Africa Industrial Demand Response Management Systems Market Revenue Share (%), by Type 2024 & 2032
  30. Figure 30: Middle East and Africa Industrial Demand Response Management Systems Market Revenue (Million), by Country 2024 & 2032
  31. Figure 31: Middle East and Africa Industrial Demand Response Management Systems Market Revenue Share (%), by Country 2024 & 2032

List of Tables

  1. Table 1: Global Industrial Demand Response Management Systems Market Revenue Million Forecast, by Region 2019 & 2032
  2. Table 2: Global Industrial Demand Response Management Systems Market Revenue Million Forecast, by Type 2019 & 2032
  3. Table 3: Global Industrial Demand Response Management Systems Market Revenue Million Forecast, by Region 2019 & 2032
  4. Table 4: Global Industrial Demand Response Management Systems Market Revenue Million Forecast, by Country 2019 & 2032
  5. Table 5: United States Industrial Demand Response Management Systems Market Revenue (Million) Forecast, by Application 2019 & 2032
  6. Table 6: Canada Industrial Demand Response Management Systems Market Revenue (Million) Forecast, by Application 2019 & 2032
  7. Table 7: Mexico Industrial Demand Response Management Systems Market Revenue (Million) Forecast, by Application 2019 & 2032
  8. Table 8: Global Industrial Demand Response Management Systems Market Revenue Million Forecast, by Country 2019 & 2032
  9. Table 9: Germany Industrial Demand Response Management Systems Market Revenue (Million) Forecast, by Application 2019 & 2032
  10. Table 10: United Kingdom Industrial Demand Response Management Systems Market Revenue (Million) Forecast, by Application 2019 & 2032
  11. Table 11: France Industrial Demand Response Management Systems Market Revenue (Million) Forecast, by Application 2019 & 2032
  12. Table 12: Spain Industrial Demand Response Management Systems Market Revenue (Million) Forecast, by Application 2019 & 2032
  13. Table 13: Italy Industrial Demand Response Management Systems Market Revenue (Million) Forecast, by Application 2019 & 2032
  14. Table 14: Spain Industrial Demand Response Management Systems Market Revenue (Million) Forecast, by Application 2019 & 2032
  15. Table 15: Belgium Industrial Demand Response Management Systems Market Revenue (Million) Forecast, by Application 2019 & 2032
  16. Table 16: Netherland Industrial Demand Response Management Systems Market Revenue (Million) Forecast, by Application 2019 & 2032
  17. Table 17: Nordics Industrial Demand Response Management Systems Market Revenue (Million) Forecast, by Application 2019 & 2032
  18. Table 18: Rest of Europe Industrial Demand Response Management Systems Market Revenue (Million) Forecast, by Application 2019 & 2032
  19. Table 19: Global Industrial Demand Response Management Systems Market Revenue Million Forecast, by Country 2019 & 2032
  20. Table 20: China Industrial Demand Response Management Systems Market Revenue (Million) Forecast, by Application 2019 & 2032
  21. Table 21: Japan Industrial Demand Response Management Systems Market Revenue (Million) Forecast, by Application 2019 & 2032
  22. Table 22: India Industrial Demand Response Management Systems Market Revenue (Million) Forecast, by Application 2019 & 2032
  23. Table 23: South Korea Industrial Demand Response Management Systems Market Revenue (Million) Forecast, by Application 2019 & 2032
  24. Table 24: Southeast Asia Industrial Demand Response Management Systems Market Revenue (Million) Forecast, by Application 2019 & 2032
  25. Table 25: Australia Industrial Demand Response Management Systems Market Revenue (Million) Forecast, by Application 2019 & 2032
  26. Table 26: Indonesia Industrial Demand Response Management Systems Market Revenue (Million) Forecast, by Application 2019 & 2032
  27. Table 27: Phillipes Industrial Demand Response Management Systems Market Revenue (Million) Forecast, by Application 2019 & 2032
  28. Table 28: Singapore Industrial Demand Response Management Systems Market Revenue (Million) Forecast, by Application 2019 & 2032
  29. Table 29: Thailandc Industrial Demand Response Management Systems Market Revenue (Million) Forecast, by Application 2019 & 2032
  30. Table 30: Rest of Asia Pacific Industrial Demand Response Management Systems Market Revenue (Million) Forecast, by Application 2019 & 2032
  31. Table 31: Global Industrial Demand Response Management Systems Market Revenue Million Forecast, by Country 2019 & 2032
  32. Table 32: Brazil Industrial Demand Response Management Systems Market Revenue (Million) Forecast, by Application 2019 & 2032
  33. Table 33: Argentina Industrial Demand Response Management Systems Market Revenue (Million) Forecast, by Application 2019 & 2032
  34. Table 34: Peru Industrial Demand Response Management Systems Market Revenue (Million) Forecast, by Application 2019 & 2032
  35. Table 35: Chile Industrial Demand Response Management Systems Market Revenue (Million) Forecast, by Application 2019 & 2032
  36. Table 36: Colombia Industrial Demand Response Management Systems Market Revenue (Million) Forecast, by Application 2019 & 2032
  37. Table 37: Ecuador Industrial Demand Response Management Systems Market Revenue (Million) Forecast, by Application 2019 & 2032
  38. Table 38: Venezuela Industrial Demand Response Management Systems Market Revenue (Million) Forecast, by Application 2019 & 2032
  39. Table 39: Rest of South America Industrial Demand Response Management Systems Market Revenue (Million) Forecast, by Application 2019 & 2032
  40. Table 40: Global Industrial Demand Response Management Systems Market Revenue Million Forecast, by Country 2019 & 2032
  41. Table 41: United Arab Emirates Industrial Demand Response Management Systems Market Revenue (Million) Forecast, by Application 2019 & 2032
  42. Table 42: Saudi Arabia Industrial Demand Response Management Systems Market Revenue (Million) Forecast, by Application 2019 & 2032
  43. Table 43: South Africa Industrial Demand Response Management Systems Market Revenue (Million) Forecast, by Application 2019 & 2032
  44. Table 44: Rest of Middle East and Africa Industrial Demand Response Management Systems Market Revenue (Million) Forecast, by Application 2019 & 2032
  45. Table 45: Global Industrial Demand Response Management Systems Market Revenue Million Forecast, by Type 2019 & 2032
  46. Table 46: Global Industrial Demand Response Management Systems Market Revenue Million Forecast, by Country 2019 & 2032
  47. Table 47: United States Industrial Demand Response Management Systems Market Revenue (Million) Forecast, by Application 2019 & 2032
  48. Table 48: Canada Industrial Demand Response Management Systems Market Revenue (Million) Forecast, by Application 2019 & 2032
  49. Table 49: Rest of North America Industrial Demand Response Management Systems Market Revenue (Million) Forecast, by Application 2019 & 2032
  50. Table 50: Global Industrial Demand Response Management Systems Market Revenue Million Forecast, by Type 2019 & 2032
  51. Table 51: Global Industrial Demand Response Management Systems Market Revenue Million Forecast, by Country 2019 & 2032
  52. Table 52: China Industrial Demand Response Management Systems Market Revenue (Million) Forecast, by Application 2019 & 2032
  53. Table 53: India Industrial Demand Response Management Systems Market Revenue (Million) Forecast, by Application 2019 & 2032
  54. Table 54: Japan Industrial Demand Response Management Systems Market Revenue (Million) Forecast, by Application 2019 & 2032
  55. Table 55: Australia Industrial Demand Response Management Systems Market Revenue (Million) Forecast, by Application 2019 & 2032
  56. Table 56: Malaysia Industrial Demand Response Management Systems Market Revenue (Million) Forecast, by Application 2019 & 2032
  57. Table 57: Thailand Industrial Demand Response Management Systems Market Revenue (Million) Forecast, by Application 2019 & 2032
  58. Table 58: Indonesia Industrial Demand Response Management Systems Market Revenue (Million) Forecast, by Application 2019 & 2032
  59. Table 59: Vietnam Industrial Demand Response Management Systems Market Revenue (Million) Forecast, by Application 2019 & 2032
  60. Table 60: Rest of Asia pacific Industrial Demand Response Management Systems Market Revenue (Million) Forecast, by Application 2019 & 2032
  61. Table 61: Global Industrial Demand Response Management Systems Market Revenue Million Forecast, by Type 2019 & 2032
  62. Table 62: Global Industrial Demand Response Management Systems Market Revenue Million Forecast, by Country 2019 & 2032
  63. Table 63: Germany Industrial Demand Response Management Systems Market Revenue (Million) Forecast, by Application 2019 & 2032
  64. Table 64: France Industrial Demand Response Management Systems Market Revenue (Million) Forecast, by Application 2019 & 2032
  65. Table 65: United Kingdom Industrial Demand Response Management Systems Market Revenue (Million) Forecast, by Application 2019 & 2032
  66. Table 66: Italy Industrial Demand Response Management Systems Market Revenue (Million) Forecast, by Application 2019 & 2032
  67. Table 67: Spain Industrial Demand Response Management Systems Market Revenue (Million) Forecast, by Application 2019 & 2032
  68. Table 68: Nordic Industrial Demand Response Management Systems Market Revenue (Million) Forecast, by Application 2019 & 2032
  69. Table 69: Turkey Industrial Demand Response Management Systems Market Revenue (Million) Forecast, by Application 2019 & 2032
  70. Table 70: Russia Industrial Demand Response Management Systems Market Revenue (Million) Forecast, by Application 2019 & 2032
  71. Table 71: Rest of Europe Industrial Demand Response Management Systems Market Revenue (Million) Forecast, by Application 2019 & 2032
  72. Table 72: Global Industrial Demand Response Management Systems Market Revenue Million Forecast, by Type 2019 & 2032
  73. Table 73: Global Industrial Demand Response Management Systems Market Revenue Million Forecast, by Country 2019 & 2032
  74. Table 74: Brazil Industrial Demand Response Management Systems Market Revenue (Million) Forecast, by Application 2019 & 2032
  75. Table 75: Argentina Industrial Demand Response Management Systems Market Revenue (Million) Forecast, by Application 2019 & 2032
  76. Table 76: Chile Industrial Demand Response Management Systems Market Revenue (Million) Forecast, by Application 2019 & 2032
  77. Table 77: Colombia Industrial Demand Response Management Systems Market Revenue (Million) Forecast, by Application 2019 & 2032
  78. Table 78: Rest of South America Industrial Demand Response Management Systems Market Revenue (Million) Forecast, by Application 2019 & 2032
  79. Table 79: Global Industrial Demand Response Management Systems Market Revenue Million Forecast, by Type 2019 & 2032
  80. Table 80: Global Industrial Demand Response Management Systems Market Revenue Million Forecast, by Country 2019 & 2032
  81. Table 81: Saudi Arabia Industrial Demand Response Management Systems Market Revenue (Million) Forecast, by Application 2019 & 2032
  82. Table 82: United Arab Emirates Industrial Demand Response Management Systems Market Revenue (Million) Forecast, by Application 2019 & 2032
  83. Table 83: South Africa Industrial Demand Response Management Systems Market Revenue (Million) Forecast, by Application 2019 & 2032
  84. Table 84: Qatar Industrial Demand Response Management Systems Market Revenue (Million) Forecast, by Application 2019 & 2032
  85. Table 85: Egypt Industrial Demand Response Management Systems Market Revenue (Million) Forecast, by Application 2019 & 2032
  86. Table 86: Nigeria Industrial Demand Response Management Systems Market Revenue (Million) Forecast, by Application 2019 & 2032
  87. Table 87: Rest of Middle East Industrial Demand Response Management Systems Market Revenue (Million) Forecast, by Application 2019 & 2032


Frequently Asked Questions

1. What is the projected Compound Annual Growth Rate (CAGR) of the Industrial Demand Response Management Systems Market?

The projected CAGR is approximately 9.07%.

2. Which companies are prominent players in the Industrial Demand Response Management Systems Market?

Key companies in the market include Autogrid Systems Inc, REGEN Energy Inc, ABB Ltd, Silver Spring Networks Inc, EnerNOC Inc, Hitachi Ltd, Mitsubishi Electric Corporation, Siemens AG, Alstom SA, Schneider Electric SE, Eaton Corporation PLC, General Electric Company.

3. What are the main segments of the Industrial Demand Response Management Systems Market?

The market segments include Type.

4. Can you provide details about the market size?

The market size is estimated to be USD 2.79 Million as of 2022.

5. What are some drivers contributing to market growth?

4.; Need for Efficient Energy Management Systems4.; Growing Penetration of Renewable Energy Sources.

6. What are the notable trends driving market growth?

Growing Penetration of Renewable Energy Sources to Drive the Market.

7. Are there any restraints impacting market growth?

4.; Privacy Concerns on the Industrial Demand Response Management Systems.

8. Can you provide examples of recent developments in the market?

June 2023: Vertiv launched its Vertiv EnerSav service, helping critical facility operators unlock cost savings through targeted energy reduction. This service avoided substantial infrastructure investments by conducting rigorous on-site assessments and gap analyses. Vertiv's innovative External Digital Demand Response Technology (EDD-RT) further optimizes energy consumption by dynamically adapting manufacturer settings based on live consumption patterns.

9. What pricing options are available for accessing the report?

Pricing options include single-user, multi-user, and enterprise licenses priced at USD 4750, USD 5250, and USD 8750 respectively.

10. Is the market size provided in terms of value or volume?

The market size is provided in terms of value, measured in Million.

11. Are there any specific market keywords associated with the report?

Yes, the market keyword associated with the report is "Industrial Demand Response Management Systems Market," which aids in identifying and referencing the specific market segment covered.

12. How do I determine which pricing option suits my needs best?

The pricing options vary based on user requirements and access needs. Individual users may opt for single-user licenses, while businesses requiring broader access may choose multi-user or enterprise licenses for cost-effective access to the report.

13. Are there any additional resources or data provided in the Industrial Demand Response Management Systems Market report?

While the report offers comprehensive insights, it's advisable to review the specific contents or supplementary materials provided to ascertain if additional resources or data are available.

14. How can I stay updated on further developments or reports in the Industrial Demand Response Management Systems Market?

To stay informed about further developments, trends, and reports in the Industrial Demand Response Management Systems Market, consider subscribing to industry newsletters, following relevant companies and organizations, or regularly checking reputable industry news sources and publications.


Methodology

Step 1 - Identification of Relevant Samples Size from Population Database

Step Chart
Bar Chart
Method Chart

Step 2 - Approaches for Defining Global Market Size (Value, Volume* & Price*)

Approach Chart
Top-down and bottom-up approaches are used to validate the global market size and estimate the market size for manufactures, regional segments, product, and application.

Note*: In applicable scenarios

Step 3 - Data Sources

Primary Research

  • Web Analytics
  • Survey Reports
  • Research Institute
  • Latest Research Reports
  • Opinion Leaders

Secondary Research

  • Annual Reports
  • White Paper
  • Latest Press Release
  • Industry Association
  • Paid Database
  • Investor Presentations
Analyst Chart

Step 4 - Data Triangulation

Involves using different sources of information in order to increase the validity of a study

These sources are likely to be stakeholders in a program - participants, other researchers, program staff, other community members, and so on.

Then we put all data in single framework & apply various statistical tools to find out the dynamic on the market.

During the analysis stage, feedback from the stakeholder groups would be compared to determine areas of agreement as well as areas of divergence

Additionally, after gathering mixed and scattered data from a wide range of sources, data is triangulated and correlated to come up with estimated figures which are further validated through primary mediums or industry experts, opinion leaders.

About Visionary Data Reports

Visionary Data Reports provides future-focused market research, advanced analytics, and strategic insights for technology, healthcare, green energy, and finance. Our reports help you anticipate trends, innovate, and lead in your industry. Our expert team combines primary research, data science, and industry knowledge to deliver actionable intelligence. We offer syndicated reports, custom analytics, and consulting services tailored to your business needs. At Visionary Data Reports, we are committed to quality, transparency, and client satisfaction. Every report is rigorously validated to ensure accuracy and relevance. Our global perspective and forward-thinking approach help you understand both current and emerging market dynamics.

Stay ahead with Visionary Data Reports. Subscribe to our newsletter for the latest insights and research highlights, and follow us on social media for real-time updates. Visionary Data Reports – Your Guide to Tomorrow’s Opportunities.

artwork spiralartwork spiralRelated Reports
artwork underline

China Nuclear Power Plant Equipment Market Unlocking Growth Opportunities: Analysis and Forecast 2025-2033

Explore the China Nuclear Power Plant Equipment Market analysis, CAGR > 6.00%, drivers, restraints, and key segments. Discover market trends for Pressurized Water Reactor, Island Equipment, and major companies.

December 2025
Base Year: 2024
No Of Pages: 197
Price: $3800

Exploring Key Trends in Saudi Arabia Drilling Rigs Market Market

Explore the Saudi Arabia Drilling Rigs Market analysis, including market size, CAGR of 4.80%, key drivers, trends, and major companies. Get insights into the onshore deployment segment and regional focus on Saudi Arabia.

December 2025
Base Year: 2024
No Of Pages: 197
Price: $3800

Consumer Trends Driving Industrial Centrifuge Industry Market Growth

Explore the booming Industrial Centrifuge Market, projected to reach $8.47 billion with a 4.51% CAGR. Discover key growth drivers, emerging trends, and regional market dominance in water treatment, pharmaceuticals, and food & beverages.

December 2025
Base Year: 2024
No Of Pages: 234
Price: $4750

Japan Power EPC Market Growth Projections: Trends to Watch

Explore the dynamic Japan Power EPC Market, analyzing key drivers like renewable energy expansion and infrastructure upgrades. Discover market size, CAGR, trends, restraints, and leading companies shaping the future of power generation in Japan through 2033.

December 2025
Base Year: 2024
No Of Pages: 197
Price: $3800

Equatorial Guinea Power Industry Insights: Market Size Analysis to 2033

Explore the burgeoning Equatorial Guinea power industry market with insights on growth drivers, key trends, and segmental analysis. Discover forecasts for electricity transmission, generation, and renewable energy equipment.

November 2025
Base Year: 2024
No Of Pages: 197
Price: $3800

Exploring Innovations in Africa Thermal Energy Storage Industry: Market Dynamics 2025-2033

Explore the booming African Thermal Energy Storage market, driven by renewable energy integration and power generation needs. Discover key growth drivers, market size projections, and leading companies shaping the future of energy in Africa.

November 2025
Base Year: 2024
No Of Pages: 234
Price: $4750

Decoding Market Trends in Oil and Gas Industry in Malaysia: 2025-2033 Analysis

Explore Malaysia's Oil and Gas Industry market size, CAGR, key drivers, trends, and restraints. Get in-depth analysis and future projections for this vital energy sector.

November 2025
Base Year: 2024
No Of Pages: 197
Price: $3800

Strategic Growth Drivers for Portugal Gas Generator Market Market

Explore the Portugal Gas Generator Market analysis, including market size, CAGR, drivers, trends, restraints, and key players. Discover growth opportunities and insights for the 2019-2033 period.

November 2025
Base Year: 2024
No Of Pages: 197
Price: $3800

FPSO Market Market Size and Trends 2025-2033: Comprehensive Outlook

Explore the dynamic FPSO market forecast, driven by deepwater exploration and technological innovation. Discover market size, CAGR, key drivers, restraints, and regional growth trends.

November 2025
Base Year: 2024
No Of Pages: 234
Price: $4750

Exploring Consumer Shifts in North America Oil & Gas Line Pipe Market Market 2025-2033

The size of the North America Oil & Gas Line Pipe Market market was valued at USD XX Million in 2024 and is projected to reach USD XXX Million by 2033, with an expected CAGR of 2.00">> 2.00% during the forecast period.

November 2025
Base Year: 2024
No Of Pages: 234
Price: $4750

Future Prospects for North America Smart Meters Market Growth

Explore the booming North America smart meters market forecast, driven by smart grid adoption and energy efficiency initiatives. Discover key insights, growth drivers, and leading companies shaping the future of utility management.

November 2025
Base Year: 2024
No Of Pages: 234
Price: $4750

Strategic Growth Drivers for Steam Turbine MRO Market Market

Explore the booming Steam Turbine MRO market forecast (2025-2033) with insights on drivers, trends, and segments for power, oil & gas. Get CAGR analysis.

November 2025
Base Year: 2024
No Of Pages: 234
Price: $4750

Exploring Asia-Pacific Solar PV Module Market’s Market Size Dynamics 2025-2033

Explore the booming Asia-Pacific Solar PV Module Market, driven by robust CAGR and government initiatives. Discover key drivers, trends, restraints, and growth opportunities across product types, end-users, and leading regions.

November 2025
Base Year: 2024
No Of Pages: 234
Price: $4750

Bulgaria Solar Energy Market XX CAGR Growth Analysis 2025-2033

Explore the dynamic Bulgarian solar energy market forecast, market size, CAGR, drivers, trends, restraints, and key players. Discover growth opportunities in clean energy.

November 2025
Base Year: 2024
No Of Pages: 197
Price: $3800

Europe Power to Gas Market Market Disruption and Future Trends

Explore the booming Europe Power to Gas market, driven by renewable energy integration and decarbonization efforts. Discover market size, growth drivers, and key segments for 2025-2033.

November 2025
Base Year: 2024
No Of Pages: 234
Price: $4750

Southeast Asia Power Transmission and Distribution Market Growth Pathways: Strategic Analysis and Forecasts 2025-2033

Explore the dynamic Southeast Asia Power Transmission and Distribution market, driven by robust economic growth and smart grid adoption. Discover key insights, CAGR trends, and market forecasts up to 2033 for Vietnam, Indonesia, Malaysia, and Thailand.

November 2025
Base Year: 2024
No Of Pages: 234
Price: $4750

Navigating South America Lithium-ion Battery For Electric Vehicle Market Market Growth 2025-2033

Explore the burgeoning South America lithium-ion battery market for electric vehicles, driven by robust growth and adoption. Discover key trends, market size, and leading companies shaping the future of EV mobility in the region.

November 2025
Base Year: 2024
No Of Pages: 234
Price: $4750

Growth Strategies in Middle East and Africa Solar Panel Recycling Market Market: 2025-2033 Outlook

Explore the booming Middle East and Africa Solar Panel Recycling Market, driven by rapid solar adoption and circular economy initiatives. Discover key drivers, trends, and growth forecasts for this essential sector.

November 2025
Base Year: 2024
No Of Pages: 234
Price: $4750

Peru Oil & Gas Downstream Industry Market Predictions and Opportunities 2025-2033

The size of the Peru Oil & Gas Downstream Industry market was valued at USD XX Million in 2024 and is projected to reach USD XXX Million by 2033, with an expected CAGR of 1.61">> 1.61% during the forecast period.

November 2025
Base Year: 2024
No Of Pages: 197
Price: $3800

Regional Trends and Opportunities for China Oil & Gas Upstream Industry Market

Explore the China Oil & Gas Upstream Industry market analysis, including key drivers, trends, restraints, and growth forecasts up to 2033. Discover insights into onshore and offshore exploration and production.

November 2025
Base Year: 2024
No Of Pages: 197
Price: $3800

Exploring Regional Dynamics of Power Transmission Tower Market Market 2025-2033

The size of the Power Transmission Tower Market market was valued at USD XX Million in 2024 and is projected to reach USD XXX Million by 2033, with an expected CAGR of 6.00">> 6.00% during the forecast period.

November 2025
Base Year: 2024
No Of Pages: 234
Price: $4750

North America Natural Gas Market Market Demand Dynamics: Insights 2025-2033

Explore the dynamic North America natural gas market analysis, forecasting robust growth driven by power generation, industrial fuel, and automotive applications. Discover key trends, drivers, and restraints shaping the region through 2033.

November 2025
Base Year: 2024
No Of Pages: 197
Price: $3800

Denmark Oil And Gas Midstream Market CAGR Growth Drivers and Trends: Forecasts 2025-2033

Explore the robust growth of the Denmark Oil and Gas Midstream market, driven by infrastructure development and energy security needs. Discover key insights, market drivers, and emerging trends shaping the sector through 2033.

October 2025
Base Year: 2024
No Of Pages: 197
Price: $3800

Netherlands Combined Heat and Power Market Analysis 2025 and Forecasts 2033: Unveiling Growth Opportunities

The size of the Netherlands Combined Heat and Power Market market was valued at USD XX Million in 2024 and is projected to reach USD XXX Million by 2033, with an expected CAGR of 1.34% during the forecast period.

October 2025
Base Year: 2024
No Of Pages: 197
Price: $3800

Thermal Power Industry Growth Opportunities and Market Forecast 2025-2033: A Strategic Analysis

Explore the Thermal Power Industry's market size, CAGR of 3%, and key drivers. Understand trends, restraints, fuel types (Coal, Gas, Nuclear), and leading companies from 2019-2033.

October 2025
Base Year: 2024
No Of Pages: 180
Price: $4750

North America Directional Drilling Industry Future-proof Strategies: Trends, Competitor Dynamics, and Opportunities 2025-2033

Explore the booming North America directional drilling market, driven by advanced technologies like RSS and growing oil/gas demand. Get key insights, market size, CAGR, and growth drivers for 2025-2033.

October 2025
Base Year: 2024
No Of Pages: 234
Price: $4750

Exploring Opportunities in Asia-Pacific Gas Generator Market Sector

The size of the Asia-Pacific Gas Generator Market market was valued at USD XX Million in 2024 and is projected to reach USD XXX Million by 2033, with an expected CAGR of 6.38">> 6.38% during the forecast period.

October 2025
Base Year: 2024
No Of Pages: 234
Price: $4750

Challenges to Overcome in Saudi Arabia Land-Based Fuel Transportation Market Market Growth: Analysis 2025-2033

Explore the dynamic Saudi Arabia Land-Based Fuel Transportation Market, driven by robust demand, infrastructure growth, and strategic energy initiatives. Discover key segments, trends, and leading companies shaping this vital sector's future.

October 2025
Base Year: 2024
No Of Pages: 197
Price: $3800

Laminated Busbar Industry Competitive Strategies: Trends and Forecasts 2025-2033

The size of the Laminated Busbar Industry market was valued at USD 0.78 USD Billion in 2024 and is projected to reach USD 1.17 USD Billion by 2033, with an expected CAGR of 6.02% during the forecast period.

October 2025
Base Year: 2024
No Of Pages: 180
Price: $4750

North America Nuclear Power Plant and Equipment Market Industry Overview and Projections

Explore the robust growth and key drivers of the North America Nuclear Power Plant and Equipment Market, from PWRs to BWRs, and understand future trends and opportunities through 2033.

October 2025
Base Year: 2024
No Of Pages: 234
Price: $4750

Consumer Trends Driving Brazil ROV Market Market Growth

The size of the Brazil ROV Market market was valued at USD XX Million in 2024 and is projected to reach USD XXX Million by 2033, with an expected CAGR of 6.00">> 6.00% during the forecast period.

October 2025
Base Year: 2024
No Of Pages: 197
Price: $3800

Emerging Growth Patterns in Algeria Oil and Gas Upstream Industry Market

Explore the burgeoning Algeria Oil and Gas Upstream Industry with our in-depth analysis. Discover market size, CAGR, key drivers like onshore and offshore projects, influential companies, and future trends shaping Algeria's energy landscape.

October 2025
Base Year: 2024
No Of Pages: 197
Price: $3800

Exploring Venezuela Energy Industry Market Disruption and Innovation

Explore the Venezuela Energy Industry's robust growth forecast, driven by hydrocarbon reserves and renewable integration. Discover key trends, restraints, and major players shaping the market's future from 2019-2033.

October 2025
Base Year: 2024
No Of Pages: 180
Price: $3800

Regional Growth Projections for Canada Renewable Energy Market Industry

Explore the dynamic Canadian renewable energy market, driven by robust growth, supportive policies, and technological innovation. Discover key drivers, trends, and segments shaping the future of sustainable power in Canada.

October 2025
Base Year: 2024
No Of Pages: 197
Price: $3800

Romania Wind Energy Market Market’s Consumer Landscape: Insights and Trends 2025-2033

Explore the booming Romanian wind energy market! Discover market size, CAGR, key drivers like renewable energy policies, and segments (onshore/offshore). Leading companies and future trends for 2025-2033.

October 2025
Base Year: 2024
No Of Pages: 197
Price: $3800

Consumer Trends Driving South America Medium Voltage Switchgear Market Market Growth

Explore the booming South America Medium Voltage Switchgear Market, driven by smart grids, renewable energy, and infrastructure upgrades. Get key insights, CAGR, market size, and top companies.

October 2025
Base Year: 2024
No Of Pages: 234
Price: $4750

Strategic Insights into South America High Voltage Switchgear Market Market Trends

Explore the dynamic South America High Voltage Switchgear Market, forecasting significant growth driven by renewable energy, infrastructure upgrades, and smart grid adoption. Discover key trends, drivers, and restraints impacting Brazil, Argentina, Colombia, and beyond.

October 2025
Base Year: 2024
No Of Pages: 234
Price: $4750

North America Wind Power Market Charting Growth Trajectories 2025-2033: Strategic Insights and Forecasts

The size of the North America Wind Power Market market was valued at USD XX Million in 2024 and is projected to reach USD XXX Million by 2033, with an expected CAGR of 7.34% during the forecast period.

October 2025
Base Year: 2024
No Of Pages: 234
Price: $4750

Sudan Power Industry Trends and Opportunities for Growth

Explore the evolving Sudan power industry market. Discover key drivers, emerging trends, and restraints shaping the energy landscape from 2019-2033.

October 2025
Base Year: 2024
No Of Pages: 197
Price: $3800

Emerging Opportunities in Alkaline Battery Market Market

Explore the dynamic Alkaline Battery Market forecast, driven by robust CAGR, consumer electronics demand, and emerging rechargeable trends. Discover market size, growth drivers, restraints, key players, and regional analysis up to 2033.

October 2025
Base Year: 2024
No Of Pages: 180
Price: $4750

Nigeria Solar EPC Market 2025-2033 Overview: Trends, Dynamics, and Growth Opportunities

Explore the booming Nigeria Solar EPC Market, projected to reach $1.22 Billion by 2025 with a strong CAGR. Discover market drivers, trends, and key players shaping Nigeria's renewable energy future.

October 2025
Base Year: 2024
No Of Pages: 197
Price: $3800

Oil and Gas Nuclear Magnetic Resonance Industry Future-proof Strategies: Trends, Competitor Dynamics, and Opportunities 2025-2033

Explore the booming Oil and Gas Nuclear Magnetic Resonance (NMR) market, driven by advanced reservoir characterization and EOR techniques. Discover key growth drivers, market trends, and regional insights from 2025-2033 with a CAGR over 5.00%.

October 2025
Base Year: 2024
No Of Pages: 234
Price: $4750

South America Nuclear Reactor Construction Market Analysis Report 2025: Market to Grow by a CAGR of XX to 2033, Driven by Government Incentives, Popularity of Virtual Assistants, and Strategic Partnerships

Explore the South America nuclear reactor construction market analysis, including drivers, restraints, trends, and regional insights for Brazil, Argentina, and beyond. Understand market size and CAGR from 2019-2033.

October 2025
Base Year: 2024
No Of Pages: 234
Price: $4750

Solid Oxide Fuel Cells Market Strategic Market Roadmap: Analysis and Forecasts 2025-2033

The size of the Solid Oxide Fuel Cells Market market was valued at USD 1670 Million in 2024 and is projected to reach USD XXX Million by 2033, with an expected CAGR of 49.00">> 49.00% during the forecast period.

October 2025
Base Year: 2024
No Of Pages: 180
Price: $4750

Oil & Gas Pump Market Report: Trends and Forecasts 2025-2033

Explore the dynamic Oil & Gas Pump Market. Discover key growth drivers, segment analysis (Dynamic & Positive Displacement Pumps), application insights (Upstream, Midstream, Downstream), market trends, restraints, and leading companies. Get insights into market size and CAGR projections for 2025-2033.

October 2025
Base Year: 2024
No Of Pages: 234
Price: $4750

Electrical Bushing Market 2025-2033 Market Analysis: Trends, Dynamics, and Growth Opportunities

The size of the Electrical Bushing Market market was valued at USD XX Million in 2024 and is projected to reach USD XXX Million by 2033, with an expected CAGR of 5.60">> 5.60% during the forecast period.

October 2025
Base Year: 2024
No Of Pages: 234
Price: $4750

Future Trends Shaping East Europe Battery Industry Growth

Explore the dynamic East Europe battery market, driven by automotive electrification & industrial energy storage. Discover key trends, growth drivers, and leading companies shaping this expanding industry through 2033.

October 2025
Base Year: 2024
No Of Pages: 234
Price: $4750

Asia-Pacific Low Voltage Switchgear Market Industry Overview and Projections

Explore the Asia-Pacific Low Voltage Switchgear Market analysis, uncovering drivers, trends, and projections for market growth up to 2033. Essential for understanding future opportunities in electrical infrastructure.

October 2025
Base Year: 2024
No Of Pages: 234
Price: $4750

Parallel Shaft Geared Motors Market Strategic Roadmap: Analysis and Forecasts 2025-2033

The size of the Parallel Shaft Geared Motors Market market was valued at USD XX Million in 2024 and is projected to reach USD XXX Million by 2033, with an expected CAGR of 15.00% during the forecast period.

October 2025
Base Year: 2024
No Of Pages: 234
Price: $4750

Asia Pacific Smart Transformers Market Market’s Consumer Preferences: Trends and Analysis 2025-2033

Explore the booming Asia Pacific Smart Transformers Market, projected to exceed $13 billion by 2033. Discover key drivers, growth trends, and leading companies shaping the future of smart grid technology in the region.

October 2025
Base Year: 2024
No Of Pages: 234
Price: $4750
  • Home
  • About Us
  • Industries
    • Packaging
    • Automotive
    • Home and Property Improvement
    • Retail
    • Energy & Power
    • Food & Beverage
    • Real Estate and Construction
    • Hospitality and Tourism
    • Agriculture
    • Manufacturing Products and Services
    • Healthcare
    • Logistics
    • Aerospace & Defense
    • Chemicals & Materials
    • Professional and Commercial Services
    • Financial Services and Investment Intelligence
    • Consumer Goods and Services
    • Animal Nutrition & Wellness
    • Technology, Media and Telecom
  • Services
  • Contact
Main Logo
  • Home
  • About Us
  • Industries
    • Packaging
    • Automotive
    • Home and Property Improvement
    • Retail
    • Energy & Power
    • Food & Beverage
    • Real Estate and Construction
    • Hospitality and Tourism
    • Agriculture
    • Manufacturing Products and Services
    • Healthcare
    • Logistics
    • Aerospace & Defense
    • Chemicals & Materials
    • Professional and Commercial Services
    • Financial Services and Investment Intelligence
    • Consumer Goods and Services
    • Animal Nutrition & Wellness
    • Technology, Media and Telecom
  • Services
  • Contact
+17162654855
[email protected]

+17162654855

[email protected]

Business Address

Head Office

Ansec House 3 rd floor Tank Road, Yerwada, Pune, Maharashtra 411014

Contact Information

Craig Francis

Business Development Head

+17162654855

[email protected]

Secure Payment Partners

payment image
RetailPackagingLogisticsAutomotiveHealthcareAgricultureEnergy & PowerFood & BeverageAerospace & DefenseChemicals & MaterialsHospitality and TourismConsumer Goods and ServicesAnimal Nutrition & WellnessReal Estate and ConstructionHome and Property ImprovementTechnology, Media and TelecomManufacturing Products and ServicesFinancial Services and Investment Intelligence

© 2025 PRDUA Research & Media Private Limited, All rights reserved

Privacy Policy
Terms and Conditions
FAQ