


Key Insights
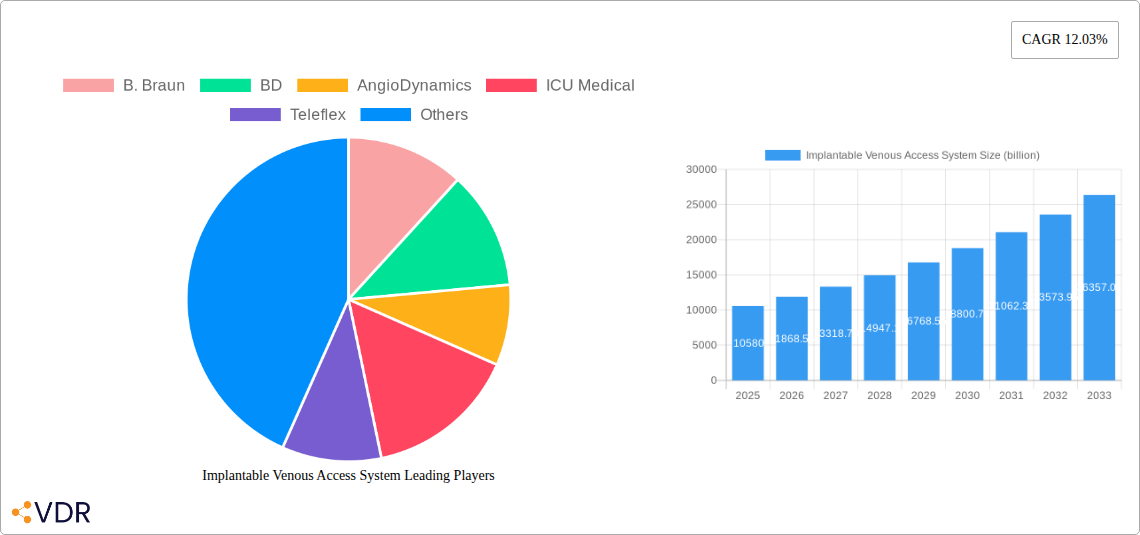
The global Implantable Venous Access System market is poised for significant expansion, projected to reach $10.58 billion by 2025, with a robust Compound Annual Growth Rate (CAGR) of 12.03% during the forecast period. This substantial growth is primarily propelled by the escalating prevalence of chronic diseases, particularly cancer, which necessitates long-term chemotherapy administration. The increasing adoption of advanced medical devices for patient comfort and improved treatment outcomes further fuels demand. Nutritional support therapy, especially for patients with malabsorption issues or severe illnesses, also contributes to market expansion, as these systems offer a reliable and convenient route for parenteral nutrition. Key market drivers include the rising incidence of cancer globally, advancements in medical technology leading to more sophisticated and user-friendly port systems, and a growing emphasis on home-based healthcare solutions where these devices play a crucial role.
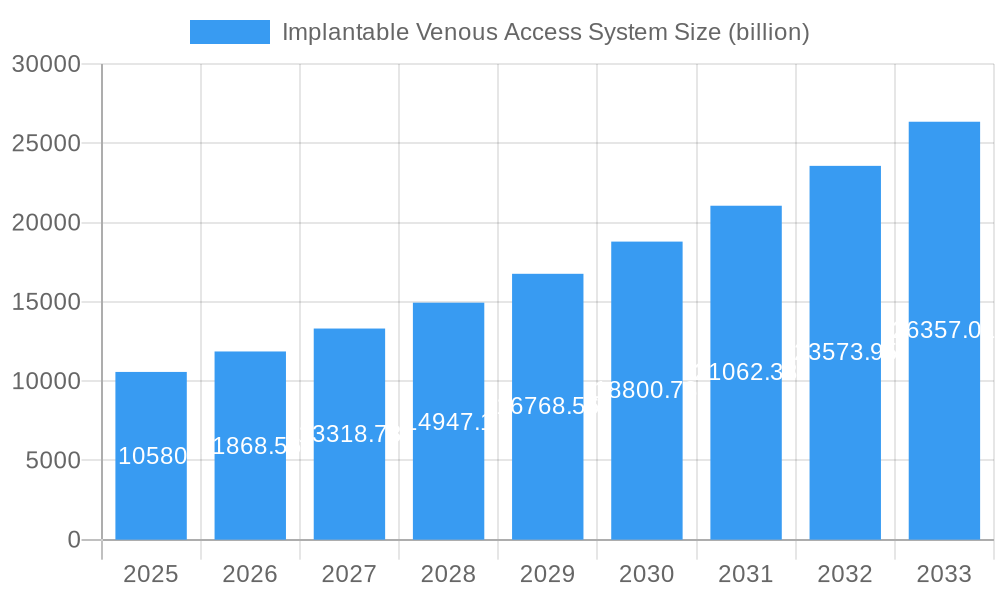
Implantable Venous Access System Market Size (In Billion)

The market is segmented by application into Cancer Chemotherapy and Nutritional Support Therapy, with Cancer Chemotherapy being the dominant segment due to the widespread need for prolonged venous access during treatment. By type, the market comprises Single Lumen Implantable Ports and Double Lumen Implantable Ports, with a discernible trend towards dual-lumen systems offering greater flexibility in treatment protocols and drug administration. Geographically, North America is anticipated to lead the market, driven by a well-established healthcare infrastructure, high patient awareness, and significant investment in medical research and development. Asia Pacific is expected to witness the fastest growth, propelled by a rapidly expanding healthcare sector, increasing disposable incomes, and a rising burden of chronic diseases. Restraints, such as the potential for complications like infection and thrombosis, and the high cost of implantation procedures, are being addressed through technological innovations aimed at minimizing risks and improving patient safety.
Implantable Venous Access System Company Market Share
Implantable Venous Access System Market Analysis: Driving Patient Care Through Advanced Technology
This comprehensive report provides an in-depth analysis of the global Implantable Venous Access System market. Spanning from 2019 to 2033, with a base year of 2025, the report delves into market dynamics, growth trends, regional dominance, product landscape, key drivers, emerging opportunities, and the competitive strategies of leading players. Leveraging extensive data and expert insights, this analysis is essential for stakeholders seeking to understand the evolving needs of healthcare providers and patients in this critical medical device sector.
Implantable Venous Access System Market Dynamics & Structure
The Implantable Venous Access System market is characterized by a moderate level of concentration, with key players like B. Braun, BD, AngioDynamics, ICU Medical, and Teleflex holding significant market shares. Technological innovation is a primary driver, fueled by the increasing demand for minimally invasive procedures and improved patient outcomes in chronic disease management. Robust regulatory frameworks, primarily governed by agencies like the FDA and EMA, ensure product safety and efficacy, albeit sometimes introducing lengthy approval processes. Competitive product substitutes, such as peripherally inserted central catheters (PICCs) and external infusion pumps, present ongoing challenges, requiring manufacturers to emphasize the long-term benefits and reduced complication rates of implantable ports. End-user demographics are shifting towards an aging global population with a higher prevalence of chronic conditions like cancer, necessitating reliable and long-term venous access solutions. Mergers and acquisitions (M&A) activity, while not as intense as in some other medtech sectors, plays a role in market consolidation and the expansion of product portfolios.
- Market Concentration: Moderate, with a few key global players dominating the landscape.
- Technological Innovation Drivers: Demand for minimally invasive procedures, improved patient comfort, and reduced infection rates.
- Regulatory Frameworks: Stringent approval processes by bodies like the FDA and EMA, emphasizing safety and efficacy.
- Competitive Product Substitutes: PICCs, external infusion pumps, and other temporary venous access devices.
- End-User Demographics: Aging population, increasing incidence of cancer and chronic diseases, growing home healthcare market.
- M&A Trends: Strategic acquisitions aimed at expanding product offerings and market reach.
Implantable Venous Access System Growth Trends & Insights
The Implantable Venous Access System market is poised for robust growth, projected to expand significantly from its current valuation. This expansion is underpinned by a confluence of factors including the escalating global burden of chronic diseases, particularly cancer, which necessitates long-term and reliable venous access for treatments like chemotherapy. The increasing preference for outpatient procedures and home-based care further bolsters demand for implantable solutions that offer enhanced patient convenience and reduced hospital stays. Technological advancements are continuously refining the design and functionality of these systems, leading to improved biocompatibility, ease of insertion, and reduced risks of infection and thrombosis. The market penetration of implantable venous access devices is steadily increasing as healthcare professionals and patients recognize their superior long-term efficacy and safety profiles compared to external or temporary access methods. This evolution in consumer behavior, driven by a desire for improved quality of life during treatment, coupled with favorable healthcare policies promoting chronic disease management, is creating a fertile ground for sustained market expansion. The anticipated Compound Annual Growth Rate (CAGR) for the forecast period (2025–2033) reflects this optimistic outlook, signaling substantial revenue growth and an expanding addressable market.
Dominant Regions, Countries, or Segments in Implantable Venous Access System
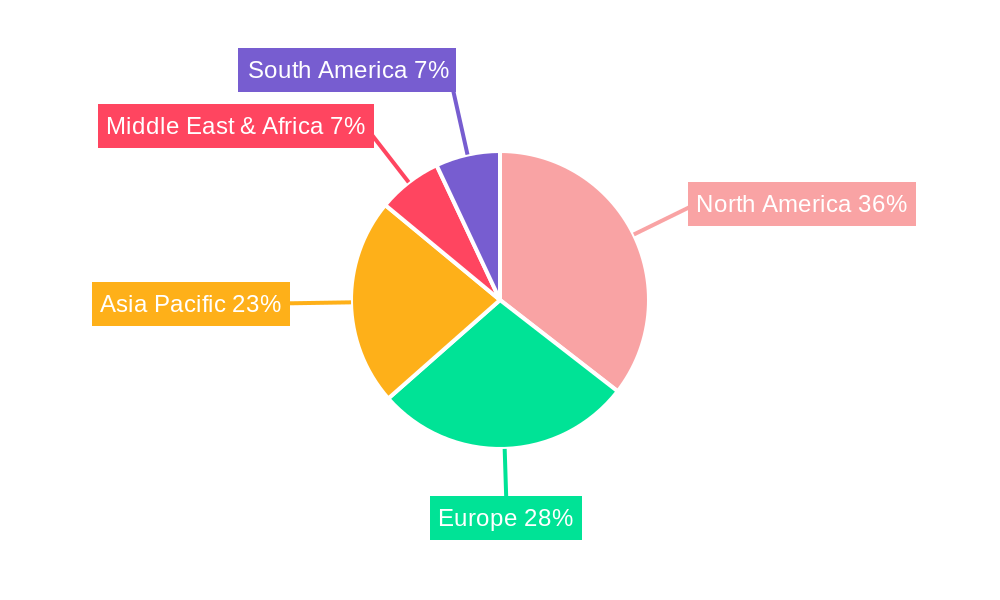
The global Implantable Venous Access System market is experiencing significant growth across various regions and segments, with North America currently holding a dominant position, driven by its advanced healthcare infrastructure, high prevalence of cancer, and significant research and development activities. The United States, in particular, contributes substantially to this dominance due to its large patient population requiring chemotherapy and nutritional support therapies.
Within the Application segment, Cancer Chemotherapy is the primary growth driver. The increasing incidence of various cancers globally, coupled with the continuous development of new chemotherapeutic agents requiring consistent and reliable venous access, fuels the demand for implantable ports. This segment is projected to continue its lead throughout the forecast period. Nutritional Support Therapy, while a smaller segment, is also experiencing steady growth, particularly in cases of long-term parenteral nutrition for patients with gastrointestinal disorders or critical illnesses.
In terms of Type, the Single Lumen Implantable Port segment currently dominates the market due to its cost-effectiveness and suitability for a broad range of applications, especially in chemotherapy administration. However, the Double Lumen Implantable Port segment is witnessing a notable surge in demand. This is attributable to its versatility in simultaneously administering multiple medications, facilitating infusions and withdrawals, or enabling simultaneous chemotherapy and parenteral nutrition, thereby enhancing treatment efficiency and patient convenience. The growing complexity of treatment regimens for chronic diseases is a key factor propelling the adoption of double lumen ports.
- Dominant Region: North America, led by the United States, due to high healthcare expenditure and cancer prevalence.
- Leading Application: Cancer Chemotherapy, driven by increasing cancer incidence and treatment duration.
- Growing Application: Nutritional Support Therapy, supported by the rise in chronic conditions requiring long-term feeding.
- Dominant Type: Single Lumen Implantable Port, owing to its widespread use and cost-effectiveness.
- High Growth Type: Double Lumen Implantable Port, driven by the need for simultaneous infusions and complex treatment regimens.
Implantable Venous Access System Product Landscape
The product landscape of Implantable Venous Access Systems is marked by continuous innovation focused on enhancing patient safety, simplifying insertion procedures, and improving long-term device performance. Manufacturers are developing ports with advanced materials offering superior biocompatibility and reduced risk of infection, as well as novel septum designs for prolonged needle punctures. Innovations also include integrated power-injectable capabilities for enhanced diagnostic imaging compatibility and the development of smaller, more discreet port designs for improved patient comfort and aesthetics. The focus is on creating integrated systems that minimize complications like thrombosis and infection, thereby optimizing treatment delivery and patient experience.
Key Drivers, Barriers & Challenges in Implantable Venous Access System
The Implantable Venous Access System market is propelled by several key drivers. The escalating global incidence of cancer and other chronic diseases necessitating long-term venous access is a primary growth accelerator. Advancements in medical technology leading to more sophisticated, safer, and user-friendly implantable port designs further fuel market expansion. Furthermore, the increasing trend towards outpatient and home-based care favors devices that offer greater patient independence and convenience.
However, the market faces significant barriers and challenges. High initial costs associated with implantable ports and their surgical implantation can be a restraint, particularly in resource-limited settings. Stringent regulatory approval processes and the need for physician training to ensure proper implantation and management also present hurdles. Moreover, the availability of alternative venous access devices, such as PICCs, provides a competitive pressure that manufacturers must continually address through product differentiation and demonstration of superior long-term benefits. Supply chain disruptions and the risk of device-related infections, though minimized through advanced designs, remain ongoing concerns requiring diligent management.
Emerging Opportunities in Implantable Venous Access System
Emerging opportunities in the Implantable Venous Access System market lie in expanding applications beyond traditional oncology and chemotherapy. The growing elderly population and the increasing prevalence of chronic conditions requiring long-term medication administration, such as autoimmune diseases and chronic kidney disease, present a significant untapped market. Furthermore, the development of smart implantable ports with integrated sensors for real-time monitoring of venous pressure and flow could revolutionize patient management and early detection of complications. The expansion of home healthcare services globally also creates a demand for more patient-friendly and easily managed venous access solutions.
Growth Accelerators in the Implantable Venous Access System Industry
Several catalysts are accelerating growth within the Implantable Venous Access System industry. Technological breakthroughs in antimicrobial coatings and novel materials are significantly reducing the incidence of catheter-related bloodstream infections, a major concern for long-term venous access. Strategic partnerships between device manufacturers and pharmaceutical companies are also playing a crucial role, leading to the development of integrated solutions for targeted drug delivery. Furthermore, increased health awareness and proactive disease management strategies are encouraging earlier adoption of reliable venous access devices for chronic conditions, thus expanding the addressable market and driving sustained growth.
Key Players Shaping the Implantable Venous Access System Market
- B. Braun
- BD
- AngioDynamics
- ICU Medical
- Teleflex
- Cook Medical
- Fresenius
- Vygon
- PFM Medical
- Linhua
Notable Milestones in Implantable Venous Access System Sector
- 2019: Introduction of next-generation power-injectable ports with enhanced imaging compatibility.
- 2020: Increased adoption of antimicrobial-coated ports to combat rising infection rates.
- 2021: Development of thinner and more flexible port designs for improved patient comfort.
- 2022: Launch of novel insertion kits aimed at simplifying and accelerating port implantation procedures.
- 2023: Focus on miniaturization of port components to reduce invasiveness.
- 2024: Advancements in materials science leading to improved long-term biocompatibility and reduced thrombogenicity.
In-Depth Implantable Venous Access System Market Outlook
The future outlook for the Implantable Venous Access System market is exceptionally positive, driven by a convergence of demographic shifts, technological advancements, and evolving healthcare delivery models. The anticipated growth is sustained by the relentless increase in chronic disease prevalence, particularly cancer, which ensures a continuous and substantial demand for reliable, long-term venous access. Innovations in smart port technology, offering real-time patient monitoring capabilities, present a significant opportunity for improved clinical outcomes and personalized treatment. Strategic collaborations and market expansion initiatives by leading players will further solidify the market’s growth trajectory, positioning implantable venous access systems as indispensable tools in modern patient care.
Implantable Venous Access System Segmentation
-
1. Application
- 1.1. Cancer Chemotherapy
- 1.2. Nutritional Support Therapy
-
2. Type
- 2.1. Single Lumen Implantable Port
- 2.2. Double Lumen Implantable Port
Implantable Venous Access System Segmentation By Geography
-
1. North America
- 1.1. United States
- 1.2. Canada
- 1.3. Mexico
-
2. South America
- 2.1. Brazil
- 2.2. Argentina
- 2.3. Rest of South America
-
3. Europe
- 3.1. United Kingdom
- 3.2. Germany
- 3.3. France
- 3.4. Italy
- 3.5. Spain
- 3.6. Russia
- 3.7. Benelux
- 3.8. Nordics
- 3.9. Rest of Europe
-
4. Middle East & Africa
- 4.1. Turkey
- 4.2. Israel
- 4.3. GCC
- 4.4. North Africa
- 4.5. South Africa
- 4.6. Rest of Middle East & Africa
-
5. Asia Pacific
- 5.1. China
- 5.2. India
- 5.3. Japan
- 5.4. South Korea
- 5.5. ASEAN
- 5.6. Oceania
- 5.7. Rest of Asia Pacific
Implantable Venous Access System Regional Market Share
Geographic Coverage of Implantable Venous Access System
Implantable Venous Access System REPORT HIGHLIGHTS
| Aspects | Details |
|---|---|
| Study Period | 2020-2034 |
| Base Year | 2025 |
| Estimated Year | 2026 |
| Forecast Period | 2026-2034 |
| Historical Period | 2020-2025 |
| Growth Rate | CAGR of 12.03% from 2020-2034 |
| Segmentation |
|
Table of Contents
- 1. Introduction
- 1.1. Research Scope
- 1.2. Market Segmentation
- 1.3. Research Methodology
- 1.4. Definitions and Assumptions
- 2. Executive Summary
- 2.1. Introduction
- 3. Market Dynamics
- 3.1. Introduction
- 3.2. Market Drivers
- 3.3. Market Restrains
- 3.4. Market Trends
- 4. Market Factor Analysis
- 4.1. Porters Five Forces
- 4.2. Supply/Value Chain
- 4.3. PESTEL analysis
- 4.4. Market Entropy
- 4.5. Patent/Trademark Analysis
- 5. Global Implantable Venous Access System Analysis, Insights and Forecast, 2020-2032
- 5.1. Market Analysis, Insights and Forecast - by Application
- 5.1.1. Cancer Chemotherapy
- 5.1.2. Nutritional Support Therapy
- 5.2. Market Analysis, Insights and Forecast - by Type
- 5.2.1. Single Lumen Implantable Port
- 5.2.2. Double Lumen Implantable Port
- 5.3. Market Analysis, Insights and Forecast - by Region
- 5.3.1. North America
- 5.3.2. South America
- 5.3.3. Europe
- 5.3.4. Middle East & Africa
- 5.3.5. Asia Pacific
- 5.1. Market Analysis, Insights and Forecast - by Application
- 6. North America Implantable Venous Access System Analysis, Insights and Forecast, 2020-2032
- 6.1. Market Analysis, Insights and Forecast - by Application
- 6.1.1. Cancer Chemotherapy
- 6.1.2. Nutritional Support Therapy
- 6.2. Market Analysis, Insights and Forecast - by Type
- 6.2.1. Single Lumen Implantable Port
- 6.2.2. Double Lumen Implantable Port
- 6.1. Market Analysis, Insights and Forecast - by Application
- 7. South America Implantable Venous Access System Analysis, Insights and Forecast, 2020-2032
- 7.1. Market Analysis, Insights and Forecast - by Application
- 7.1.1. Cancer Chemotherapy
- 7.1.2. Nutritional Support Therapy
- 7.2. Market Analysis, Insights and Forecast - by Type
- 7.2.1. Single Lumen Implantable Port
- 7.2.2. Double Lumen Implantable Port
- 7.1. Market Analysis, Insights and Forecast - by Application
- 8. Europe Implantable Venous Access System Analysis, Insights and Forecast, 2020-2032
- 8.1. Market Analysis, Insights and Forecast - by Application
- 8.1.1. Cancer Chemotherapy
- 8.1.2. Nutritional Support Therapy
- 8.2. Market Analysis, Insights and Forecast - by Type
- 8.2.1. Single Lumen Implantable Port
- 8.2.2. Double Lumen Implantable Port
- 8.1. Market Analysis, Insights and Forecast - by Application
- 9. Middle East & Africa Implantable Venous Access System Analysis, Insights and Forecast, 2020-2032
- 9.1. Market Analysis, Insights and Forecast - by Application
- 9.1.1. Cancer Chemotherapy
- 9.1.2. Nutritional Support Therapy
- 9.2. Market Analysis, Insights and Forecast - by Type
- 9.2.1. Single Lumen Implantable Port
- 9.2.2. Double Lumen Implantable Port
- 9.1. Market Analysis, Insights and Forecast - by Application
- 10. Asia Pacific Implantable Venous Access System Analysis, Insights and Forecast, 2020-2032
- 10.1. Market Analysis, Insights and Forecast - by Application
- 10.1.1. Cancer Chemotherapy
- 10.1.2. Nutritional Support Therapy
- 10.2. Market Analysis, Insights and Forecast - by Type
- 10.2.1. Single Lumen Implantable Port
- 10.2.2. Double Lumen Implantable Port
- 10.1. Market Analysis, Insights and Forecast - by Application
- 11. Competitive Analysis
- 11.1. Global Market Share Analysis 2025
- 11.2. Company Profiles
- 11.2.1 B. Braun
- 11.2.1.1. Overview
- 11.2.1.2. Products
- 11.2.1.3. SWOT Analysis
- 11.2.1.4. Recent Developments
- 11.2.1.5. Financials (Based on Availability)
- 11.2.2 BD
- 11.2.2.1. Overview
- 11.2.2.2. Products
- 11.2.2.3. SWOT Analysis
- 11.2.2.4. Recent Developments
- 11.2.2.5. Financials (Based on Availability)
- 11.2.3 AngioDynamics
- 11.2.3.1. Overview
- 11.2.3.2. Products
- 11.2.3.3. SWOT Analysis
- 11.2.3.4. Recent Developments
- 11.2.3.5. Financials (Based on Availability)
- 11.2.4 ICU Medical
- 11.2.4.1. Overview
- 11.2.4.2. Products
- 11.2.4.3. SWOT Analysis
- 11.2.4.4. Recent Developments
- 11.2.4.5. Financials (Based on Availability)
- 11.2.5 Teleflex
- 11.2.5.1. Overview
- 11.2.5.2. Products
- 11.2.5.3. SWOT Analysis
- 11.2.5.4. Recent Developments
- 11.2.5.5. Financials (Based on Availability)
- 11.2.6 Cook Medical
- 11.2.6.1. Overview
- 11.2.6.2. Products
- 11.2.6.3. SWOT Analysis
- 11.2.6.4. Recent Developments
- 11.2.6.5. Financials (Based on Availability)
- 11.2.7 Fresenius
- 11.2.7.1. Overview
- 11.2.7.2. Products
- 11.2.7.3. SWOT Analysis
- 11.2.7.4. Recent Developments
- 11.2.7.5. Financials (Based on Availability)
- 11.2.8 Vygon
- 11.2.8.1. Overview
- 11.2.8.2. Products
- 11.2.8.3. SWOT Analysis
- 11.2.8.4. Recent Developments
- 11.2.8.5. Financials (Based on Availability)
- 11.2.9 PFM Medical
- 11.2.9.1. Overview
- 11.2.9.2. Products
- 11.2.9.3. SWOT Analysis
- 11.2.9.4. Recent Developments
- 11.2.9.5. Financials (Based on Availability)
- 11.2.10 Linhua
- 11.2.10.1. Overview
- 11.2.10.2. Products
- 11.2.10.3. SWOT Analysis
- 11.2.10.4. Recent Developments
- 11.2.10.5. Financials (Based on Availability)
- 11.2.1 B. Braun
List of Figures
- Figure 1: Global Implantable Venous Access System Revenue Breakdown (billion, %) by Region 2025 & 2033
- Figure 2: Global Implantable Venous Access System Volume Breakdown (K, %) by Region 2025 & 2033
- Figure 3: North America Implantable Venous Access System Revenue (billion), by Application 2025 & 2033
- Figure 4: North America Implantable Venous Access System Volume (K), by Application 2025 & 2033
- Figure 5: North America Implantable Venous Access System Revenue Share (%), by Application 2025 & 2033
- Figure 6: North America Implantable Venous Access System Volume Share (%), by Application 2025 & 2033
- Figure 7: North America Implantable Venous Access System Revenue (billion), by Type 2025 & 2033
- Figure 8: North America Implantable Venous Access System Volume (K), by Type 2025 & 2033
- Figure 9: North America Implantable Venous Access System Revenue Share (%), by Type 2025 & 2033
- Figure 10: North America Implantable Venous Access System Volume Share (%), by Type 2025 & 2033
- Figure 11: North America Implantable Venous Access System Revenue (billion), by Country 2025 & 2033
- Figure 12: North America Implantable Venous Access System Volume (K), by Country 2025 & 2033
- Figure 13: North America Implantable Venous Access System Revenue Share (%), by Country 2025 & 2033
- Figure 14: North America Implantable Venous Access System Volume Share (%), by Country 2025 & 2033
- Figure 15: South America Implantable Venous Access System Revenue (billion), by Application 2025 & 2033
- Figure 16: South America Implantable Venous Access System Volume (K), by Application 2025 & 2033
- Figure 17: South America Implantable Venous Access System Revenue Share (%), by Application 2025 & 2033
- Figure 18: South America Implantable Venous Access System Volume Share (%), by Application 2025 & 2033
- Figure 19: South America Implantable Venous Access System Revenue (billion), by Type 2025 & 2033
- Figure 20: South America Implantable Venous Access System Volume (K), by Type 2025 & 2033
- Figure 21: South America Implantable Venous Access System Revenue Share (%), by Type 2025 & 2033
- Figure 22: South America Implantable Venous Access System Volume Share (%), by Type 2025 & 2033
- Figure 23: South America Implantable Venous Access System Revenue (billion), by Country 2025 & 2033
- Figure 24: South America Implantable Venous Access System Volume (K), by Country 2025 & 2033
- Figure 25: South America Implantable Venous Access System Revenue Share (%), by Country 2025 & 2033
- Figure 26: South America Implantable Venous Access System Volume Share (%), by Country 2025 & 2033
- Figure 27: Europe Implantable Venous Access System Revenue (billion), by Application 2025 & 2033
- Figure 28: Europe Implantable Venous Access System Volume (K), by Application 2025 & 2033
- Figure 29: Europe Implantable Venous Access System Revenue Share (%), by Application 2025 & 2033
- Figure 30: Europe Implantable Venous Access System Volume Share (%), by Application 2025 & 2033
- Figure 31: Europe Implantable Venous Access System Revenue (billion), by Type 2025 & 2033
- Figure 32: Europe Implantable Venous Access System Volume (K), by Type 2025 & 2033
- Figure 33: Europe Implantable Venous Access System Revenue Share (%), by Type 2025 & 2033
- Figure 34: Europe Implantable Venous Access System Volume Share (%), by Type 2025 & 2033
- Figure 35: Europe Implantable Venous Access System Revenue (billion), by Country 2025 & 2033
- Figure 36: Europe Implantable Venous Access System Volume (K), by Country 2025 & 2033
- Figure 37: Europe Implantable Venous Access System Revenue Share (%), by Country 2025 & 2033
- Figure 38: Europe Implantable Venous Access System Volume Share (%), by Country 2025 & 2033
- Figure 39: Middle East & Africa Implantable Venous Access System Revenue (billion), by Application 2025 & 2033
- Figure 40: Middle East & Africa Implantable Venous Access System Volume (K), by Application 2025 & 2033
- Figure 41: Middle East & Africa Implantable Venous Access System Revenue Share (%), by Application 2025 & 2033
- Figure 42: Middle East & Africa Implantable Venous Access System Volume Share (%), by Application 2025 & 2033
- Figure 43: Middle East & Africa Implantable Venous Access System Revenue (billion), by Type 2025 & 2033
- Figure 44: Middle East & Africa Implantable Venous Access System Volume (K), by Type 2025 & 2033
- Figure 45: Middle East & Africa Implantable Venous Access System Revenue Share (%), by Type 2025 & 2033
- Figure 46: Middle East & Africa Implantable Venous Access System Volume Share (%), by Type 2025 & 2033
- Figure 47: Middle East & Africa Implantable Venous Access System Revenue (billion), by Country 2025 & 2033
- Figure 48: Middle East & Africa Implantable Venous Access System Volume (K), by Country 2025 & 2033
- Figure 49: Middle East & Africa Implantable Venous Access System Revenue Share (%), by Country 2025 & 2033
- Figure 50: Middle East & Africa Implantable Venous Access System Volume Share (%), by Country 2025 & 2033
- Figure 51: Asia Pacific Implantable Venous Access System Revenue (billion), by Application 2025 & 2033
- Figure 52: Asia Pacific Implantable Venous Access System Volume (K), by Application 2025 & 2033
- Figure 53: Asia Pacific Implantable Venous Access System Revenue Share (%), by Application 2025 & 2033
- Figure 54: Asia Pacific Implantable Venous Access System Volume Share (%), by Application 2025 & 2033
- Figure 55: Asia Pacific Implantable Venous Access System Revenue (billion), by Type 2025 & 2033
- Figure 56: Asia Pacific Implantable Venous Access System Volume (K), by Type 2025 & 2033
- Figure 57: Asia Pacific Implantable Venous Access System Revenue Share (%), by Type 2025 & 2033
- Figure 58: Asia Pacific Implantable Venous Access System Volume Share (%), by Type 2025 & 2033
- Figure 59: Asia Pacific Implantable Venous Access System Revenue (billion), by Country 2025 & 2033
- Figure 60: Asia Pacific Implantable Venous Access System Volume (K), by Country 2025 & 2033
- Figure 61: Asia Pacific Implantable Venous Access System Revenue Share (%), by Country 2025 & 2033
- Figure 62: Asia Pacific Implantable Venous Access System Volume Share (%), by Country 2025 & 2033
List of Tables
- Table 1: Global Implantable Venous Access System Revenue billion Forecast, by Application 2020 & 2033
- Table 2: Global Implantable Venous Access System Volume K Forecast, by Application 2020 & 2033
- Table 3: Global Implantable Venous Access System Revenue billion Forecast, by Type 2020 & 2033
- Table 4: Global Implantable Venous Access System Volume K Forecast, by Type 2020 & 2033
- Table 5: Global Implantable Venous Access System Revenue billion Forecast, by Region 2020 & 2033
- Table 6: Global Implantable Venous Access System Volume K Forecast, by Region 2020 & 2033
- Table 7: Global Implantable Venous Access System Revenue billion Forecast, by Application 2020 & 2033
- Table 8: Global Implantable Venous Access System Volume K Forecast, by Application 2020 & 2033
- Table 9: Global Implantable Venous Access System Revenue billion Forecast, by Type 2020 & 2033
- Table 10: Global Implantable Venous Access System Volume K Forecast, by Type 2020 & 2033
- Table 11: Global Implantable Venous Access System Revenue billion Forecast, by Country 2020 & 2033
- Table 12: Global Implantable Venous Access System Volume K Forecast, by Country 2020 & 2033
- Table 13: United States Implantable Venous Access System Revenue (billion) Forecast, by Application 2020 & 2033
- Table 14: United States Implantable Venous Access System Volume (K) Forecast, by Application 2020 & 2033
- Table 15: Canada Implantable Venous Access System Revenue (billion) Forecast, by Application 2020 & 2033
- Table 16: Canada Implantable Venous Access System Volume (K) Forecast, by Application 2020 & 2033
- Table 17: Mexico Implantable Venous Access System Revenue (billion) Forecast, by Application 2020 & 2033
- Table 18: Mexico Implantable Venous Access System Volume (K) Forecast, by Application 2020 & 2033
- Table 19: Global Implantable Venous Access System Revenue billion Forecast, by Application 2020 & 2033
- Table 20: Global Implantable Venous Access System Volume K Forecast, by Application 2020 & 2033
- Table 21: Global Implantable Venous Access System Revenue billion Forecast, by Type 2020 & 2033
- Table 22: Global Implantable Venous Access System Volume K Forecast, by Type 2020 & 2033
- Table 23: Global Implantable Venous Access System Revenue billion Forecast, by Country 2020 & 2033
- Table 24: Global Implantable Venous Access System Volume K Forecast, by Country 2020 & 2033
- Table 25: Brazil Implantable Venous Access System Revenue (billion) Forecast, by Application 2020 & 2033
- Table 26: Brazil Implantable Venous Access System Volume (K) Forecast, by Application 2020 & 2033
- Table 27: Argentina Implantable Venous Access System Revenue (billion) Forecast, by Application 2020 & 2033
- Table 28: Argentina Implantable Venous Access System Volume (K) Forecast, by Application 2020 & 2033
- Table 29: Rest of South America Implantable Venous Access System Revenue (billion) Forecast, by Application 2020 & 2033
- Table 30: Rest of South America Implantable Venous Access System Volume (K) Forecast, by Application 2020 & 2033
- Table 31: Global Implantable Venous Access System Revenue billion Forecast, by Application 2020 & 2033
- Table 32: Global Implantable Venous Access System Volume K Forecast, by Application 2020 & 2033
- Table 33: Global Implantable Venous Access System Revenue billion Forecast, by Type 2020 & 2033
- Table 34: Global Implantable Venous Access System Volume K Forecast, by Type 2020 & 2033
- Table 35: Global Implantable Venous Access System Revenue billion Forecast, by Country 2020 & 2033
- Table 36: Global Implantable Venous Access System Volume K Forecast, by Country 2020 & 2033
- Table 37: United Kingdom Implantable Venous Access System Revenue (billion) Forecast, by Application 2020 & 2033
- Table 38: United Kingdom Implantable Venous Access System Volume (K) Forecast, by Application 2020 & 2033
- Table 39: Germany Implantable Venous Access System Revenue (billion) Forecast, by Application 2020 & 2033
- Table 40: Germany Implantable Venous Access System Volume (K) Forecast, by Application 2020 & 2033
- Table 41: France Implantable Venous Access System Revenue (billion) Forecast, by Application 2020 & 2033
- Table 42: France Implantable Venous Access System Volume (K) Forecast, by Application 2020 & 2033
- Table 43: Italy Implantable Venous Access System Revenue (billion) Forecast, by Application 2020 & 2033
- Table 44: Italy Implantable Venous Access System Volume (K) Forecast, by Application 2020 & 2033
- Table 45: Spain Implantable Venous Access System Revenue (billion) Forecast, by Application 2020 & 2033
- Table 46: Spain Implantable Venous Access System Volume (K) Forecast, by Application 2020 & 2033
- Table 47: Russia Implantable Venous Access System Revenue (billion) Forecast, by Application 2020 & 2033
- Table 48: Russia Implantable Venous Access System Volume (K) Forecast, by Application 2020 & 2033
- Table 49: Benelux Implantable Venous Access System Revenue (billion) Forecast, by Application 2020 & 2033
- Table 50: Benelux Implantable Venous Access System Volume (K) Forecast, by Application 2020 & 2033
- Table 51: Nordics Implantable Venous Access System Revenue (billion) Forecast, by Application 2020 & 2033
- Table 52: Nordics Implantable Venous Access System Volume (K) Forecast, by Application 2020 & 2033
- Table 53: Rest of Europe Implantable Venous Access System Revenue (billion) Forecast, by Application 2020 & 2033
- Table 54: Rest of Europe Implantable Venous Access System Volume (K) Forecast, by Application 2020 & 2033
- Table 55: Global Implantable Venous Access System Revenue billion Forecast, by Application 2020 & 2033
- Table 56: Global Implantable Venous Access System Volume K Forecast, by Application 2020 & 2033
- Table 57: Global Implantable Venous Access System Revenue billion Forecast, by Type 2020 & 2033
- Table 58: Global Implantable Venous Access System Volume K Forecast, by Type 2020 & 2033
- Table 59: Global Implantable Venous Access System Revenue billion Forecast, by Country 2020 & 2033
- Table 60: Global Implantable Venous Access System Volume K Forecast, by Country 2020 & 2033
- Table 61: Turkey Implantable Venous Access System Revenue (billion) Forecast, by Application 2020 & 2033
- Table 62: Turkey Implantable Venous Access System Volume (K) Forecast, by Application 2020 & 2033
- Table 63: Israel Implantable Venous Access System Revenue (billion) Forecast, by Application 2020 & 2033
- Table 64: Israel Implantable Venous Access System Volume (K) Forecast, by Application 2020 & 2033
- Table 65: GCC Implantable Venous Access System Revenue (billion) Forecast, by Application 2020 & 2033
- Table 66: GCC Implantable Venous Access System Volume (K) Forecast, by Application 2020 & 2033
- Table 67: North Africa Implantable Venous Access System Revenue (billion) Forecast, by Application 2020 & 2033
- Table 68: North Africa Implantable Venous Access System Volume (K) Forecast, by Application 2020 & 2033
- Table 69: South Africa Implantable Venous Access System Revenue (billion) Forecast, by Application 2020 & 2033
- Table 70: South Africa Implantable Venous Access System Volume (K) Forecast, by Application 2020 & 2033
- Table 71: Rest of Middle East & Africa Implantable Venous Access System Revenue (billion) Forecast, by Application 2020 & 2033
- Table 72: Rest of Middle East & Africa Implantable Venous Access System Volume (K) Forecast, by Application 2020 & 2033
- Table 73: Global Implantable Venous Access System Revenue billion Forecast, by Application 2020 & 2033
- Table 74: Global Implantable Venous Access System Volume K Forecast, by Application 2020 & 2033
- Table 75: Global Implantable Venous Access System Revenue billion Forecast, by Type 2020 & 2033
- Table 76: Global Implantable Venous Access System Volume K Forecast, by Type 2020 & 2033
- Table 77: Global Implantable Venous Access System Revenue billion Forecast, by Country 2020 & 2033
- Table 78: Global Implantable Venous Access System Volume K Forecast, by Country 2020 & 2033
- Table 79: China Implantable Venous Access System Revenue (billion) Forecast, by Application 2020 & 2033
- Table 80: China Implantable Venous Access System Volume (K) Forecast, by Application 2020 & 2033
- Table 81: India Implantable Venous Access System Revenue (billion) Forecast, by Application 2020 & 2033
- Table 82: India Implantable Venous Access System Volume (K) Forecast, by Application 2020 & 2033
- Table 83: Japan Implantable Venous Access System Revenue (billion) Forecast, by Application 2020 & 2033
- Table 84: Japan Implantable Venous Access System Volume (K) Forecast, by Application 2020 & 2033
- Table 85: South Korea Implantable Venous Access System Revenue (billion) Forecast, by Application 2020 & 2033
- Table 86: South Korea Implantable Venous Access System Volume (K) Forecast, by Application 2020 & 2033
- Table 87: ASEAN Implantable Venous Access System Revenue (billion) Forecast, by Application 2020 & 2033
- Table 88: ASEAN Implantable Venous Access System Volume (K) Forecast, by Application 2020 & 2033
- Table 89: Oceania Implantable Venous Access System Revenue (billion) Forecast, by Application 2020 & 2033
- Table 90: Oceania Implantable Venous Access System Volume (K) Forecast, by Application 2020 & 2033
- Table 91: Rest of Asia Pacific Implantable Venous Access System Revenue (billion) Forecast, by Application 2020 & 2033
- Table 92: Rest of Asia Pacific Implantable Venous Access System Volume (K) Forecast, by Application 2020 & 2033
Frequently Asked Questions
1. What is the projected Compound Annual Growth Rate (CAGR) of the Implantable Venous Access System?
The projected CAGR is approximately 12.03%.
2. Which companies are prominent players in the Implantable Venous Access System?
Key companies in the market include B. Braun, BD, AngioDynamics, ICU Medical, Teleflex, Cook Medical, Fresenius, Vygon, PFM Medical, Linhua.
3. What are the main segments of the Implantable Venous Access System?
The market segments include Application, Type.
4. Can you provide details about the market size?
The market size is estimated to be USD 10.58 billion as of 2022.
5. What are some drivers contributing to market growth?
N/A
6. What are the notable trends driving market growth?
N/A
7. Are there any restraints impacting market growth?
N/A
8. Can you provide examples of recent developments in the market?
N/A
9. What pricing options are available for accessing the report?
Pricing options include single-user, multi-user, and enterprise licenses priced at USD 3950.00, USD 5925.00, and USD 7900.00 respectively.
10. Is the market size provided in terms of value or volume?
The market size is provided in terms of value, measured in billion and volume, measured in K.
11. Are there any specific market keywords associated with the report?
Yes, the market keyword associated with the report is "Implantable Venous Access System," which aids in identifying and referencing the specific market segment covered.
12. How do I determine which pricing option suits my needs best?
The pricing options vary based on user requirements and access needs. Individual users may opt for single-user licenses, while businesses requiring broader access may choose multi-user or enterprise licenses for cost-effective access to the report.
13. Are there any additional resources or data provided in the Implantable Venous Access System report?
While the report offers comprehensive insights, it's advisable to review the specific contents or supplementary materials provided to ascertain if additional resources or data are available.
14. How can I stay updated on further developments or reports in the Implantable Venous Access System?
To stay informed about further developments, trends, and reports in the Implantable Venous Access System, consider subscribing to industry newsletters, following relevant companies and organizations, or regularly checking reputable industry news sources and publications.
Methodology
Step 1 - Identification of Relevant Samples Size from Population Database


Step 2 - Approaches for Defining Global Market Size (Value, Volume* & Price*)

Note*: In applicable scenarios
Step 3 - Data Sources
Primary Research
- Web Analytics
- Survey Reports
- Research Institute
- Latest Research Reports
- Opinion Leaders
Secondary Research
- Annual Reports
- White Paper
- Latest Press Release
- Industry Association
- Paid Database
- Investor Presentations

Step 4 - Data Triangulation
Involves using different sources of information in order to increase the validity of a study
These sources are likely to be stakeholders in a program - participants, other researchers, program staff, other community members, and so on.
Then we put all data in single framework & apply various statistical tools to find out the dynamic on the market.
During the analysis stage, feedback from the stakeholder groups would be compared to determine areas of agreement as well as areas of divergence