

Key Insights
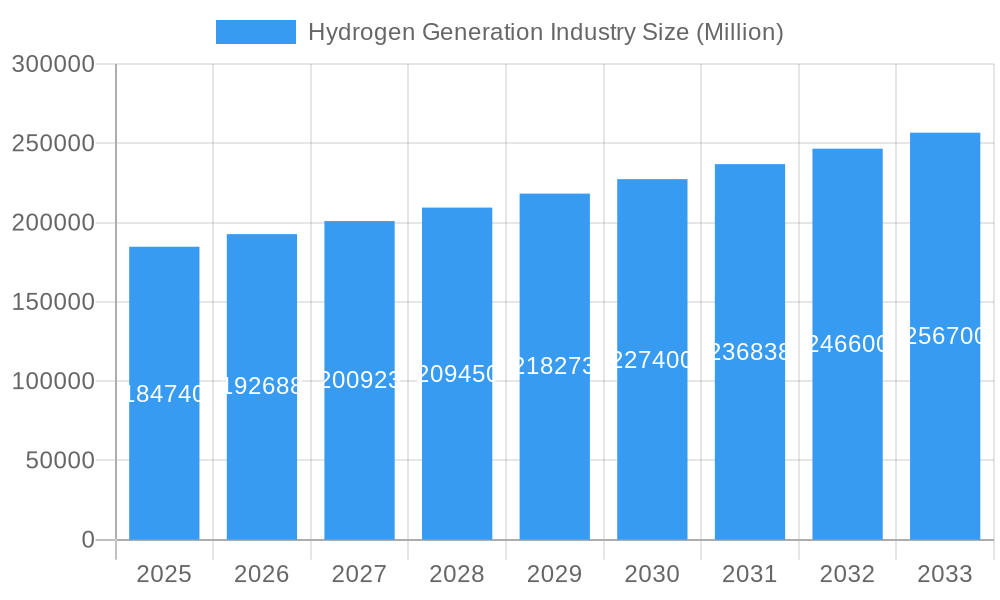
The hydrogen generation industry is experiencing robust growth, projected to reach a market size of $184.74 billion in 2025 and expand at a compound annual growth rate (CAGR) of 4.23% from 2025 to 2033. This expansion is fueled by several key drivers. The increasing demand for clean energy sources, coupled with stringent environmental regulations aimed at reducing carbon emissions, is significantly boosting the adoption of hydrogen as a sustainable fuel alternative. Governments worldwide are actively investing in hydrogen infrastructure development and research, further accelerating market growth. Technological advancements in hydrogen production methods, particularly in green hydrogen production via electrolysis powered by renewable energy sources, are also contributing to the industry's expansion. The diverse applications of hydrogen, including its use in oil refining, chemical processing, and iron & steel production, create a broad market base, ensuring sustained demand. However, the high cost of production, particularly for green hydrogen, and the lack of widespread infrastructure remain significant challenges hindering faster market penetration. The ongoing development of cost-effective production technologies and supportive government policies will be crucial to overcoming these restraints.
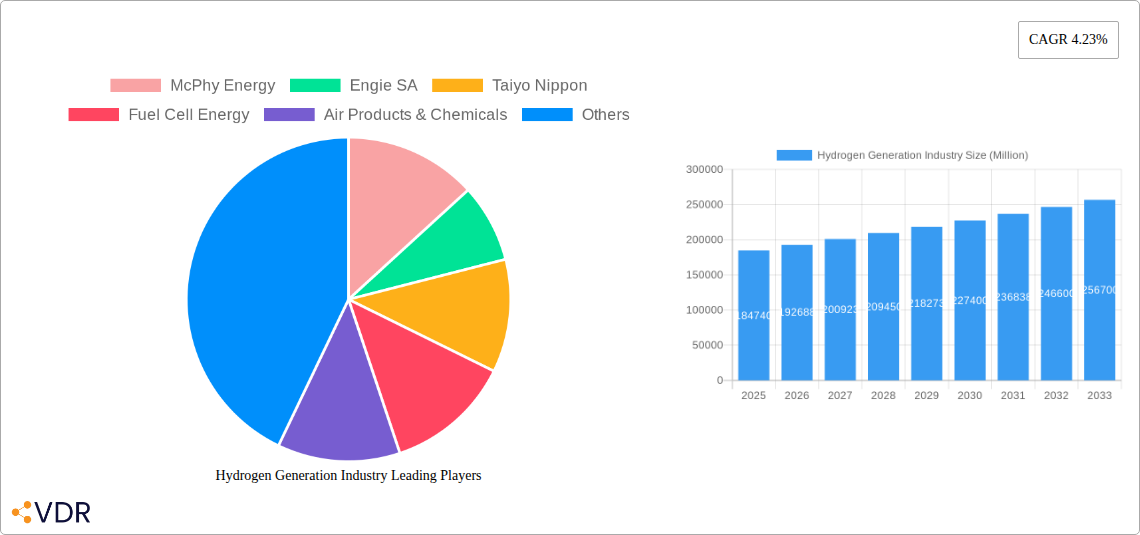
Hydrogen Generation Industry Market Size (In Billion)
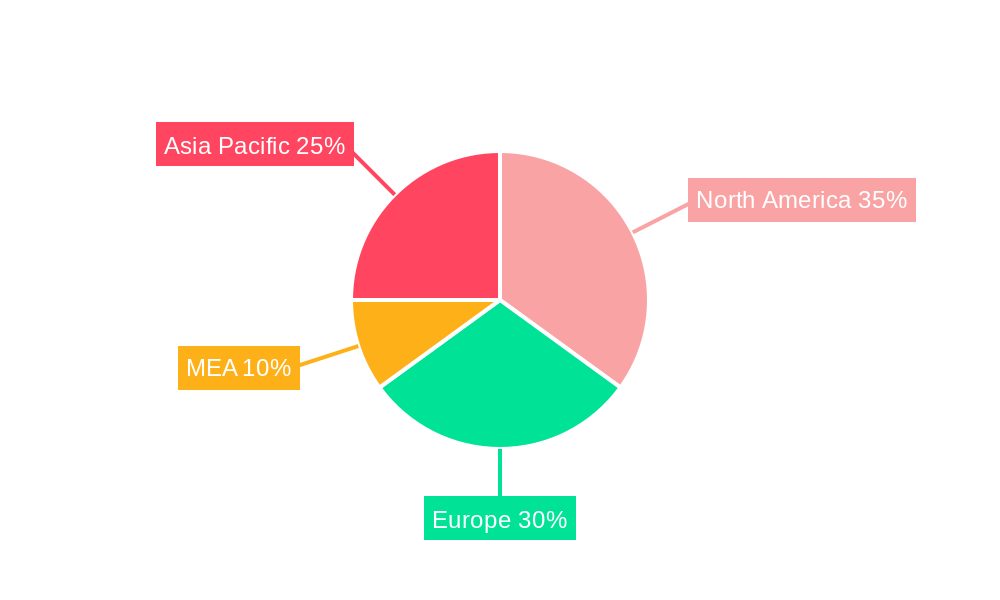
The market segmentation reveals a dynamic landscape. Green hydrogen, while currently a smaller segment, is witnessing the most rapid growth due to its environmental advantages. Steam methane reforming (SMR) remains the dominant technology for hydrogen production, although its reliance on fossil fuels limits its long-term sustainability. Coal gasification and other emerging technologies are also gaining traction, offering diverse production methods to meet varying regional needs and resources. Geographically, North America and Europe are currently leading the market, driven by strong policy support and established industrial sectors. However, Asia-Pacific is expected to witness significant growth in the coming years, driven by the region's large energy demand and increasing investments in renewable energy infrastructure. Key players in the market, such as McPhy Energy, Engie SA, and Air Liquide, are strategically investing in research and development, capacity expansion, and partnerships to capitalize on the growing opportunities within this promising sector. The competitive landscape is characterized by both established players and emerging innovative companies, leading to increased technological advancements and price competitiveness.
Hydrogen Generation Industry Company Market Share
Hydrogen Generation Industry Market Report: 2019-2033
This comprehensive report provides an in-depth analysis of the Hydrogen Generation Industry, encompassing market dynamics, growth trends, regional dominance, product landscape, key players, and future outlook. The study period covers 2019-2033, with 2025 as the base and estimated year. The report segments the market by source (Blue, Green, Grey Hydrogen), technology (Steam Methane Reforming (SMR), Coal Gasification, Other Technologies), and application (Oil Refining, Chemical Processing, Iron & Steel Production, Other Applications). Key players analyzed include McPhy Energy, Engie SA, Taiyo Nippon Sanso, Fuel Cell Energy, Air Products & Chemicals, Linde plc, Cummins, Messer Group GmbH, Air Liquide, ITM Power plc, and Enapter. The report offers invaluable insights for industry professionals, investors, and stakeholders seeking to navigate this rapidly evolving market.
Hydrogen Generation Industry Market Dynamics & Structure
The hydrogen generation market, valued at xx Million in 2025, exhibits a moderately concentrated structure with several large multinational corporations holding significant market share. Technological innovation, particularly in green hydrogen production using electrolysis, is a primary driver. Stringent environmental regulations globally are pushing the shift towards cleaner hydrogen sources, while government incentives and subsidies are accelerating adoption. Competitive substitutes include traditional fossil fuels, but the increasing focus on decarbonization is favoring hydrogen. End-user demographics are diverse, spanning the oil & gas, chemical, and steel industries. M&A activity in the sector is robust, with xx deals recorded in 2024, reflecting consolidation and technological integration.
- Market Concentration: Moderately concentrated, with top 5 players holding xx% market share in 2025.
- Technological Innovation: Electrolysis advancements (PEM, AEM) are key drivers, reducing production costs.
- Regulatory Framework: Government policies promoting renewable energy and carbon reduction favor hydrogen.
- Competitive Substitutes: Natural gas, coal, and other fossil fuels are being challenged.
- End-User Demographics: Oil refining, chemical processing, iron & steel are major consumers.
- M&A Trends: Significant consolidation through mergers and acquisitions aimed at expanding production capacity and technological expertise. xx deals in 2024.
- Innovation Barriers: High capital expenditure for new facilities and technological hurdles in scaling production.
Hydrogen Generation Industry Growth Trends & Insights
The hydrogen generation market is projected to experience substantial growth, with a CAGR of xx% during 2025-2033, driven by the increasing demand for clean energy and stringent environmental regulations. Market size is expected to reach xx Million by 2033. The adoption rate of green hydrogen is accelerating due to technological advancements and falling costs. Technological disruptions, such as the development of improved electrolyzer technologies and cost reductions, are significantly impacting the market landscape. Consumer behavior is shifting towards sustainable energy sources, favoring hydrogen's role in decarbonization.
- Market Size Evolution: From xx Million in 2019 to xx Million in 2025, projected to reach xx Million by 2033.
- Adoption Rates: Green hydrogen adoption is accelerating, with an estimated xx% market penetration by 2033.
- Technological Disruptions: Advancements in electrolysis, fuel cell technology, and hydrogen storage are key drivers.
- Consumer Behavior Shifts: Increasing demand for sustainable energy solutions and environmental awareness is fueling market growth.
Dominant Regions, Countries, or Segments in Hydrogen Generation Industry
Europe and North America currently dominate the hydrogen generation market, driven by strong government support, substantial investments in renewable energy infrastructure, and a significant industrial base demanding hydrogen. Among the production sources, Green Hydrogen is witnessing the fastest growth due to rising environmental concerns and supportive government policies. Steam Methane Reforming (SMR) remains the dominant technology but faces pressure from Green Hydrogen. In terms of applications, the iron & steel industry shows significant potential, with countries like Germany leading in the adoption of hydrogen for steel production.
- Key Drivers: Strong government support, investments in renewable energy, and industrial demand.
- Dominant Regions: Europe and North America.
- Fastest-Growing Segment: Green Hydrogen, driven by environmental concerns and supportive policies.
- Dominant Technology: Steam Methane Reforming (SMR), although facing challenges from green hydrogen.
- High-Potential Application: Iron & steel production, with Germany leading the way.
- Market Share & Growth Potential: Europe holds approximately xx% market share in 2025, projected to grow to xx% by 2033. North America holds xx% in 2025, projected to grow to xx% by 2033.
Hydrogen Generation Industry Product Landscape
The hydrogen generation product landscape is characterized by a diverse range of technologies, including electrolysis (PEM, AEM, alkaline), steam methane reforming, and coal gasification. Recent innovations focus on enhancing efficiency, reducing production costs, and improving the sustainability of hydrogen production processes. Key features such as modular designs, flexible scaling, and increased energy efficiency are driving product differentiation.
Key Drivers, Barriers & Challenges in Hydrogen Generation Industry
Key Drivers:
- Increasing demand for clean energy solutions to meet environmental regulations.
- Government incentives and subsidies for renewable energy projects.
- Technological advancements reducing production costs and improving efficiency.
Key Challenges & Restraints:
- High capital expenditure associated with establishing hydrogen production facilities.
- Lack of widespread hydrogen infrastructure for storage and distribution.
- Intermittency of renewable energy sources used in green hydrogen production.
- Competition from established fossil fuel-based energy sources.
- Regulatory uncertainties and varying standards across different regions.
Emerging Opportunities in Hydrogen Generation Industry
- Growth in green hydrogen fueled by falling production costs and increasing demand.
- Expanding applications beyond industrial uses, such as transportation and building heating.
- Development of innovative hydrogen storage and distribution technologies.
- Opportunities in developing countries with significant renewable energy potential.
Growth Accelerators in the Hydrogen Generation Industry Industry
Technological advancements in electrolysis are significantly accelerating growth, making green hydrogen production increasingly cost-competitive. Strategic partnerships between energy companies and technology providers are driving innovation and market expansion. Government policies supporting the development of hydrogen infrastructure are crucial for realizing the full potential of the market.
Key Players Shaping the Hydrogen Generation Industry Market
- McPhy Energy
- Engie SA
- Taiyo Nippon Sanso
- Fuel Cell Energy
- Air Products & Chemicals
- Linde plc
- Cummins
- Messer Group GmbH
- Air Liquide
- ITM Power plc
- Enapter
Notable Milestones in Hydrogen Generation Industry Sector
- October 2023: H2B2 unveils the SoHyCal green hydrogen plant in Fresno, California, using PEM technology.
- October 2023: Hygenco Green Energies announces plans for a green hydrogen plant in Maharashtra, India, supplying Sterlite Technologies.
- May 2023: RWE and Westfalen Group plan to develop up to 70 hydrogen fuel stations in Germany by 2030.
In-Depth Hydrogen Generation Industry Market Outlook
The hydrogen generation market is poised for significant growth, driven by a confluence of factors including increasing demand for clean energy, technological advancements, and supportive government policies. Strategic partnerships and investments in research and development will further accelerate market expansion, creating lucrative opportunities for companies across the value chain. The focus on green hydrogen will be key to future market success.
Hydrogen Generation Industry Segmentation
-
1. Source
- 1.1. Blue hydrogen
- 1.2. Green hydrogen
- 1.3. Grey Hydrogen
-
2. Technology
- 2.1. Steam Methane Reforming (SMR)
- 2.2. Coal Gasification
- 2.3. Other Technologies
-
3. Application
- 3.1. Oil Refining
- 3.2. Chemical Processing
- 3.3. Iron & Steel Production
- 3.4. Other Applications
Hydrogen Generation Industry Segmentation By Geography
-
1. North America
- 1.1. United States
- 1.2. Canada
- 1.3. Rest of North America
-
2. Europe
- 2.1. Germany
- 2.2. France
- 2.3. Italy
- 2.4. United Kingdom
- 2.5. Russian Federation
- 2.6. Rest of Europe
- 3. Middle East
-
4. Saudi Arabia
- 4.1. United Arab Emirates
- 4.2. South Africa
- 4.3. Rest of Middle East and Africa
-
5. Asia Pacific
- 5.1. China
- 5.2. India
- 5.3. Japan
- 5.4. South Korea
- 5.5. Rest of Asia Pacific
-
6. South America
- 6.1. Brazil
- 6.2. Argentina
- 6.3. Rest of South America
Hydrogen Generation Industry Regional Market Share
Geographic Coverage of Hydrogen Generation Industry
Hydrogen Generation Industry REPORT HIGHLIGHTS
| Aspects | Details |
|---|---|
| Study Period | 2020-2034 |
| Base Year | 2025 |
| Estimated Year | 2026 |
| Forecast Period | 2026-2034 |
| Historical Period | 2020-2025 |
| Growth Rate | CAGR of 4.23% from 2020-2034 |
| Segmentation |
|
Table of Contents
- 1. Introduction
- 1.1. Research Scope
- 1.2. Market Segmentation
- 1.3. Research Objective
- 1.4. Definitions and Assumptions
- 2. Executive Summary
- 2.1. Market Snapshot
- 3. Market Dynamics
- 3.1. Market Drivers
- 3.2. Market Restrains
- 3.3. Market Trends
- 3.4. Market Opportunities
- 4. Market Factor Analysis
- 4.1. Porters Five Forces
- 4.1.1. Bargaining Power of Suppliers
- 4.1.2. Bargaining Power of Buyers
- 4.1.3. Threat of New Entrants
- 4.1.4. Threat of Substitutes
- 4.1.5. Competitive Rivalry
- 4.2. PESTEL analysis
- 4.3. BCG Analysis
- 4.3.1. Stars (High Growth, High Market Share)
- 4.3.2. Cash Cows (Low Growth, High Market Share)
- 4.3.3. Question Mark (High Growth, Low Market Share)
- 4.3.4. Dogs (Low Growth, Low Market Share)
- 4.4. Ansoff Matrix Analysis
- 4.5. Supply Chain Analysis
- 4.6. Regulatory Landscape
- 4.7. Current Market Potential and Opportunity Assessment (TAM–SAM–SOM Framework)
- 4.8. VDR Analyst Note
- 4.1. Porters Five Forces
- 5. Market Analysis, Insights and Forecast 2021-2033
- 5.1. Market Analysis, Insights and Forecast - by Source
- 5.1.1. Blue hydrogen
- 5.1.2. Green hydrogen
- 5.1.3. Grey Hydrogen
- 5.2. Market Analysis, Insights and Forecast - by Technology
- 5.2.1. Steam Methane Reforming (SMR)
- 5.2.2. Coal Gasification
- 5.2.3. Other Technologies
- 5.3. Market Analysis, Insights and Forecast - by Application
- 5.3.1. Oil Refining
- 5.3.2. Chemical Processing
- 5.3.3. Iron & Steel Production
- 5.3.4. Other Applications
- 5.4. Market Analysis, Insights and Forecast - by Region
- 5.4.1. North America
- 5.4.2. Europe
- 5.4.3. Middle East
- 5.4.4. Saudi Arabia
- 5.4.5. Asia Pacific
- 5.4.6. South America
- 5.1. Market Analysis, Insights and Forecast - by Source
- 6. Global Hydrogen Generation Industry Analysis, Insights and Forecast, 2021-2033
- 6.1. Market Analysis, Insights and Forecast - by Source
- 6.1.1. Blue hydrogen
- 6.1.2. Green hydrogen
- 6.1.3. Grey Hydrogen
- 6.2. Market Analysis, Insights and Forecast - by Technology
- 6.2.1. Steam Methane Reforming (SMR)
- 6.2.2. Coal Gasification
- 6.2.3. Other Technologies
- 6.3. Market Analysis, Insights and Forecast - by Application
- 6.3.1. Oil Refining
- 6.3.2. Chemical Processing
- 6.3.3. Iron & Steel Production
- 6.3.4. Other Applications
- 6.1. Market Analysis, Insights and Forecast - by Source
- 7. North America Hydrogen Generation Industry Analysis, Insights and Forecast, 2021-2033
- 7.1. Market Analysis, Insights and Forecast - by Source
- 7.1.1. Blue hydrogen
- 7.1.2. Green hydrogen
- 7.1.3. Grey Hydrogen
- 7.2. Market Analysis, Insights and Forecast - by Technology
- 7.2.1. Steam Methane Reforming (SMR)
- 7.2.2. Coal Gasification
- 7.2.3. Other Technologies
- 7.3. Market Analysis, Insights and Forecast - by Application
- 7.3.1. Oil Refining
- 7.3.2. Chemical Processing
- 7.3.3. Iron & Steel Production
- 7.3.4. Other Applications
- 7.1. Market Analysis, Insights and Forecast - by Source
- 8. Europe Hydrogen Generation Industry Analysis, Insights and Forecast, 2021-2033
- 8.1. Market Analysis, Insights and Forecast - by Source
- 8.1.1. Blue hydrogen
- 8.1.2. Green hydrogen
- 8.1.3. Grey Hydrogen
- 8.2. Market Analysis, Insights and Forecast - by Technology
- 8.2.1. Steam Methane Reforming (SMR)
- 8.2.2. Coal Gasification
- 8.2.3. Other Technologies
- 8.3. Market Analysis, Insights and Forecast - by Application
- 8.3.1. Oil Refining
- 8.3.2. Chemical Processing
- 8.3.3. Iron & Steel Production
- 8.3.4. Other Applications
- 8.1. Market Analysis, Insights and Forecast - by Source
- 9. Middle East Hydrogen Generation Industry Analysis, Insights and Forecast, 2021-2033
- 9.1. Market Analysis, Insights and Forecast - by Source
- 9.1.1. Blue hydrogen
- 9.1.2. Green hydrogen
- 9.1.3. Grey Hydrogen
- 9.2. Market Analysis, Insights and Forecast - by Technology
- 9.2.1. Steam Methane Reforming (SMR)
- 9.2.2. Coal Gasification
- 9.2.3. Other Technologies
- 9.3. Market Analysis, Insights and Forecast - by Application
- 9.3.1. Oil Refining
- 9.3.2. Chemical Processing
- 9.3.3. Iron & Steel Production
- 9.3.4. Other Applications
- 9.1. Market Analysis, Insights and Forecast - by Source
- 10. Saudi Arabia Hydrogen Generation Industry Analysis, Insights and Forecast, 2021-2033
- 10.1. Market Analysis, Insights and Forecast - by Source
- 10.1.1. Blue hydrogen
- 10.1.2. Green hydrogen
- 10.1.3. Grey Hydrogen
- 10.2. Market Analysis, Insights and Forecast - by Technology
- 10.2.1. Steam Methane Reforming (SMR)
- 10.2.2. Coal Gasification
- 10.2.3. Other Technologies
- 10.3. Market Analysis, Insights and Forecast - by Application
- 10.3.1. Oil Refining
- 10.3.2. Chemical Processing
- 10.3.3. Iron & Steel Production
- 10.3.4. Other Applications
- 10.1. Market Analysis, Insights and Forecast - by Source
- 11. Asia Pacific Hydrogen Generation Industry Analysis, Insights and Forecast, 2021-2033
- 11.1. Market Analysis, Insights and Forecast - by Source
- 11.1.1. Blue hydrogen
- 11.1.2. Green hydrogen
- 11.1.3. Grey Hydrogen
- 11.2. Market Analysis, Insights and Forecast - by Technology
- 11.2.1. Steam Methane Reforming (SMR)
- 11.2.2. Coal Gasification
- 11.2.3. Other Technologies
- 11.3. Market Analysis, Insights and Forecast - by Application
- 11.3.1. Oil Refining
- 11.3.2. Chemical Processing
- 11.3.3. Iron & Steel Production
- 11.3.4. Other Applications
- 11.1. Market Analysis, Insights and Forecast - by Source
- 12. South America Hydrogen Generation Industry Analysis, Insights and Forecast, 2021-2033
- 12.1. Market Analysis, Insights and Forecast - by Source
- 12.1.1. Blue hydrogen
- 12.1.2. Green hydrogen
- 12.1.3. Grey Hydrogen
- 12.2. Market Analysis, Insights and Forecast - by Technology
- 12.2.1. Steam Methane Reforming (SMR)
- 12.2.2. Coal Gasification
- 12.2.3. Other Technologies
- 12.3. Market Analysis, Insights and Forecast - by Application
- 12.3.1. Oil Refining
- 12.3.2. Chemical Processing
- 12.3.3. Iron & Steel Production
- 12.3.4. Other Applications
- 12.1. Market Analysis, Insights and Forecast - by Source
- 13. Competitive Analysis
- 13.1. Company Profiles
- 13.1.1 McPhy Energy
- 13.1.1.1. Company Overview
- 13.1.1.2. Products
- 13.1.1.3. Company Financials
- 13.1.1.4. SWOT Analysis
- 13.1.2 Engie SA
- 13.1.2.1. Company Overview
- 13.1.2.2. Products
- 13.1.2.3. Company Financials
- 13.1.2.4. SWOT Analysis
- 13.1.3 Taiyo Nippon
- 13.1.3.1. Company Overview
- 13.1.3.2. Products
- 13.1.3.3. Company Financials
- 13.1.3.4. SWOT Analysis
- 13.1.4 Fuel Cell Energy
- 13.1.4.1. Company Overview
- 13.1.4.2. Products
- 13.1.4.3. Company Financials
- 13.1.4.4. SWOT Analysis
- 13.1.5 Air Products & Chemicals
- 13.1.5.1. Company Overview
- 13.1.5.2. Products
- 13.1.5.3. Company Financials
- 13.1.5.4. SWOT Analysis
- 13.1.6 Linde plc
- 13.1.6.1. Company Overview
- 13.1.6.2. Products
- 13.1.6.3. Company Financials
- 13.1.6.4. SWOT Analysis
- 13.1.7 Cummins
- 13.1.7.1. Company Overview
- 13.1.7.2. Products
- 13.1.7.3. Company Financials
- 13.1.7.4. SWOT Analysis
- 13.1.8 Messer Group GmbH
- 13.1.8.1. Company Overview
- 13.1.8.2. Products
- 13.1.8.3. Company Financials
- 13.1.8.4. SWOT Analysis
- 13.1.9 Air Liquide
- 13.1.9.1. Company Overview
- 13.1.9.2. Products
- 13.1.9.3. Company Financials
- 13.1.9.4. SWOT Analysis
- 13.1.10 ITM Power plc
- 13.1.10.1. Company Overview
- 13.1.10.2. Products
- 13.1.10.3. Company Financials
- 13.1.10.4. SWOT Analysis
- 13.1.11 Enapter
- 13.1.11.1. Company Overview
- 13.1.11.2. Products
- 13.1.11.3. Company Financials
- 13.1.11.4. SWOT Analysis
- 13.1.1 McPhy Energy
- 13.2. Market Entropy
- 13.2.1 Company's Key Areas Served
- 13.2.2 Recent Developments
- 13.3. Company Market Share Analysis 2025
- 13.3.1 Top 5 Companies Market Share Analysis
- 13.3.2 Top 3 Companies Market Share Analysis
- 13.4. List of Potential Customers
- 14. Research Methodology
List of Figures
- Figure 1: Global Hydrogen Generation Industry Revenue Breakdown (Million, %) by Region 2025 & 2033
- Figure 2: North America Hydrogen Generation Industry Revenue (Million), by Source 2025 & 2033
- Figure 3: North America Hydrogen Generation Industry Revenue Share (%), by Source 2025 & 2033
- Figure 4: North America Hydrogen Generation Industry Revenue (Million), by Technology 2025 & 2033
- Figure 5: North America Hydrogen Generation Industry Revenue Share (%), by Technology 2025 & 2033
- Figure 6: North America Hydrogen Generation Industry Revenue (Million), by Application 2025 & 2033
- Figure 7: North America Hydrogen Generation Industry Revenue Share (%), by Application 2025 & 2033
- Figure 8: North America Hydrogen Generation Industry Revenue (Million), by Country 2025 & 2033
- Figure 9: North America Hydrogen Generation Industry Revenue Share (%), by Country 2025 & 2033
- Figure 10: Europe Hydrogen Generation Industry Revenue (Million), by Source 2025 & 2033
- Figure 11: Europe Hydrogen Generation Industry Revenue Share (%), by Source 2025 & 2033
- Figure 12: Europe Hydrogen Generation Industry Revenue (Million), by Technology 2025 & 2033
- Figure 13: Europe Hydrogen Generation Industry Revenue Share (%), by Technology 2025 & 2033
- Figure 14: Europe Hydrogen Generation Industry Revenue (Million), by Application 2025 & 2033
- Figure 15: Europe Hydrogen Generation Industry Revenue Share (%), by Application 2025 & 2033
- Figure 16: Europe Hydrogen Generation Industry Revenue (Million), by Country 2025 & 2033
- Figure 17: Europe Hydrogen Generation Industry Revenue Share (%), by Country 2025 & 2033
- Figure 18: Middle East Hydrogen Generation Industry Revenue (Million), by Source 2025 & 2033
- Figure 19: Middle East Hydrogen Generation Industry Revenue Share (%), by Source 2025 & 2033
- Figure 20: Middle East Hydrogen Generation Industry Revenue (Million), by Technology 2025 & 2033
- Figure 21: Middle East Hydrogen Generation Industry Revenue Share (%), by Technology 2025 & 2033
- Figure 22: Middle East Hydrogen Generation Industry Revenue (Million), by Application 2025 & 2033
- Figure 23: Middle East Hydrogen Generation Industry Revenue Share (%), by Application 2025 & 2033
- Figure 24: Middle East Hydrogen Generation Industry Revenue (Million), by Country 2025 & 2033
- Figure 25: Middle East Hydrogen Generation Industry Revenue Share (%), by Country 2025 & 2033
- Figure 26: Saudi Arabia Hydrogen Generation Industry Revenue (Million), by Source 2025 & 2033
- Figure 27: Saudi Arabia Hydrogen Generation Industry Revenue Share (%), by Source 2025 & 2033
- Figure 28: Saudi Arabia Hydrogen Generation Industry Revenue (Million), by Technology 2025 & 2033
- Figure 29: Saudi Arabia Hydrogen Generation Industry Revenue Share (%), by Technology 2025 & 2033
- Figure 30: Saudi Arabia Hydrogen Generation Industry Revenue (Million), by Application 2025 & 2033
- Figure 31: Saudi Arabia Hydrogen Generation Industry Revenue Share (%), by Application 2025 & 2033
- Figure 32: Saudi Arabia Hydrogen Generation Industry Revenue (Million), by Country 2025 & 2033
- Figure 33: Saudi Arabia Hydrogen Generation Industry Revenue Share (%), by Country 2025 & 2033
- Figure 34: Asia Pacific Hydrogen Generation Industry Revenue (Million), by Source 2025 & 2033
- Figure 35: Asia Pacific Hydrogen Generation Industry Revenue Share (%), by Source 2025 & 2033
- Figure 36: Asia Pacific Hydrogen Generation Industry Revenue (Million), by Technology 2025 & 2033
- Figure 37: Asia Pacific Hydrogen Generation Industry Revenue Share (%), by Technology 2025 & 2033
- Figure 38: Asia Pacific Hydrogen Generation Industry Revenue (Million), by Application 2025 & 2033
- Figure 39: Asia Pacific Hydrogen Generation Industry Revenue Share (%), by Application 2025 & 2033
- Figure 40: Asia Pacific Hydrogen Generation Industry Revenue (Million), by Country 2025 & 2033
- Figure 41: Asia Pacific Hydrogen Generation Industry Revenue Share (%), by Country 2025 & 2033
- Figure 42: South America Hydrogen Generation Industry Revenue (Million), by Source 2025 & 2033
- Figure 43: South America Hydrogen Generation Industry Revenue Share (%), by Source 2025 & 2033
- Figure 44: South America Hydrogen Generation Industry Revenue (Million), by Technology 2025 & 2033
- Figure 45: South America Hydrogen Generation Industry Revenue Share (%), by Technology 2025 & 2033
- Figure 46: South America Hydrogen Generation Industry Revenue (Million), by Application 2025 & 2033
- Figure 47: South America Hydrogen Generation Industry Revenue Share (%), by Application 2025 & 2033
- Figure 48: South America Hydrogen Generation Industry Revenue (Million), by Country 2025 & 2033
- Figure 49: South America Hydrogen Generation Industry Revenue Share (%), by Country 2025 & 2033
List of Tables
- Table 1: Global Hydrogen Generation Industry Revenue Million Forecast, by Source 2020 & 2033
- Table 2: Global Hydrogen Generation Industry Revenue Million Forecast, by Technology 2020 & 2033
- Table 3: Global Hydrogen Generation Industry Revenue Million Forecast, by Application 2020 & 2033
- Table 4: Global Hydrogen Generation Industry Revenue Million Forecast, by Region 2020 & 2033
- Table 5: Global Hydrogen Generation Industry Revenue Million Forecast, by Source 2020 & 2033
- Table 6: Global Hydrogen Generation Industry Revenue Million Forecast, by Technology 2020 & 2033
- Table 7: Global Hydrogen Generation Industry Revenue Million Forecast, by Application 2020 & 2033
- Table 8: Global Hydrogen Generation Industry Revenue Million Forecast, by Country 2020 & 2033
- Table 9: United States Hydrogen Generation Industry Revenue (Million) Forecast, by Application 2020 & 2033
- Table 10: Canada Hydrogen Generation Industry Revenue (Million) Forecast, by Application 2020 & 2033
- Table 11: Rest of North America Hydrogen Generation Industry Revenue (Million) Forecast, by Application 2020 & 2033
- Table 12: Global Hydrogen Generation Industry Revenue Million Forecast, by Source 2020 & 2033
- Table 13: Global Hydrogen Generation Industry Revenue Million Forecast, by Technology 2020 & 2033
- Table 14: Global Hydrogen Generation Industry Revenue Million Forecast, by Application 2020 & 2033
- Table 15: Global Hydrogen Generation Industry Revenue Million Forecast, by Country 2020 & 2033
- Table 16: Germany Hydrogen Generation Industry Revenue (Million) Forecast, by Application 2020 & 2033
- Table 17: France Hydrogen Generation Industry Revenue (Million) Forecast, by Application 2020 & 2033
- Table 18: Italy Hydrogen Generation Industry Revenue (Million) Forecast, by Application 2020 & 2033
- Table 19: United Kingdom Hydrogen Generation Industry Revenue (Million) Forecast, by Application 2020 & 2033
- Table 20: Russian Federation Hydrogen Generation Industry Revenue (Million) Forecast, by Application 2020 & 2033
- Table 21: Rest of Europe Hydrogen Generation Industry Revenue (Million) Forecast, by Application 2020 & 2033
- Table 22: Global Hydrogen Generation Industry Revenue Million Forecast, by Source 2020 & 2033
- Table 23: Global Hydrogen Generation Industry Revenue Million Forecast, by Technology 2020 & 2033
- Table 24: Global Hydrogen Generation Industry Revenue Million Forecast, by Application 2020 & 2033
- Table 25: Global Hydrogen Generation Industry Revenue Million Forecast, by Country 2020 & 2033
- Table 26: Global Hydrogen Generation Industry Revenue Million Forecast, by Source 2020 & 2033
- Table 27: Global Hydrogen Generation Industry Revenue Million Forecast, by Technology 2020 & 2033
- Table 28: Global Hydrogen Generation Industry Revenue Million Forecast, by Application 2020 & 2033
- Table 29: Global Hydrogen Generation Industry Revenue Million Forecast, by Country 2020 & 2033
- Table 30: United Arab Emirates Hydrogen Generation Industry Revenue (Million) Forecast, by Application 2020 & 2033
- Table 31: South Africa Hydrogen Generation Industry Revenue (Million) Forecast, by Application 2020 & 2033
- Table 32: Rest of Middle East and Africa Hydrogen Generation Industry Revenue (Million) Forecast, by Application 2020 & 2033
- Table 33: Global Hydrogen Generation Industry Revenue Million Forecast, by Source 2020 & 2033
- Table 34: Global Hydrogen Generation Industry Revenue Million Forecast, by Technology 2020 & 2033
- Table 35: Global Hydrogen Generation Industry Revenue Million Forecast, by Application 2020 & 2033
- Table 36: Global Hydrogen Generation Industry Revenue Million Forecast, by Country 2020 & 2033
- Table 37: China Hydrogen Generation Industry Revenue (Million) Forecast, by Application 2020 & 2033
- Table 38: India Hydrogen Generation Industry Revenue (Million) Forecast, by Application 2020 & 2033
- Table 39: Japan Hydrogen Generation Industry Revenue (Million) Forecast, by Application 2020 & 2033
- Table 40: South Korea Hydrogen Generation Industry Revenue (Million) Forecast, by Application 2020 & 2033
- Table 41: Rest of Asia Pacific Hydrogen Generation Industry Revenue (Million) Forecast, by Application 2020 & 2033
- Table 42: Global Hydrogen Generation Industry Revenue Million Forecast, by Source 2020 & 2033
- Table 43: Global Hydrogen Generation Industry Revenue Million Forecast, by Technology 2020 & 2033
- Table 44: Global Hydrogen Generation Industry Revenue Million Forecast, by Application 2020 & 2033
- Table 45: Global Hydrogen Generation Industry Revenue Million Forecast, by Country 2020 & 2033
- Table 46: Brazil Hydrogen Generation Industry Revenue (Million) Forecast, by Application 2020 & 2033
- Table 47: Argentina Hydrogen Generation Industry Revenue (Million) Forecast, by Application 2020 & 2033
- Table 48: Rest of South America Hydrogen Generation Industry Revenue (Million) Forecast, by Application 2020 & 2033
Frequently Asked Questions
1. What is the projected Compound Annual Growth Rate (CAGR) of the Hydrogen Generation Industry?
The projected CAGR is approximately 4.23%.
2. Which companies are prominent players in the Hydrogen Generation Industry?
Key companies in the market include McPhy Energy, Engie SA, Taiyo Nippon, Fuel Cell Energy, Air Products & Chemicals, Linde plc, Cummins, Messer Group GmbH, Air Liquide, ITM Power plc, Enapter.
3. What are the main segments of the Hydrogen Generation Industry?
The market segments include Source, Technology, Application.
4. Can you provide details about the market size?
The market size is estimated to be USD 184.74 Million as of 2022.
5. What are some drivers contributing to market growth?
4.; Favorable Government Policies4.; Increasing Demand From Refinery and Industrial Sector.
6. What are the notable trends driving market growth?
Oil Refining Segment Expected to Dominate the Market.
7. Are there any restraints impacting market growth?
4.; Higher Production Cost.
8. Can you provide examples of recent developments in the market?
October 2023: H2B2, a technology company with a portfolio in Hydrogen production systems, unveiled the green hydrogen plant, which is expected to become operational in North America, the SoHyCal facility located in Fresno, California, United States. The project envisages 100 percent clean hydrogen production using PEM technology.
9. What pricing options are available for accessing the report?
Pricing options include single-user, multi-user, and enterprise licenses priced at USD 4750, USD 5250, and USD 8750 respectively.
10. Is the market size provided in terms of value or volume?
The market size is provided in terms of value, measured in Million.
11. Are there any specific market keywords associated with the report?
Yes, the market keyword associated with the report is "Hydrogen Generation Industry," which aids in identifying and referencing the specific market segment covered.
12. How do I determine which pricing option suits my needs best?
The pricing options vary based on user requirements and access needs. Individual users may opt for single-user licenses, while businesses requiring broader access may choose multi-user or enterprise licenses for cost-effective access to the report.
13. Are there any additional resources or data provided in the Hydrogen Generation Industry report?
While the report offers comprehensive insights, it's advisable to review the specific contents or supplementary materials provided to ascertain if additional resources or data are available.
14. How can I stay updated on further developments or reports in the Hydrogen Generation Industry?
To stay informed about further developments, trends, and reports in the Hydrogen Generation Industry, consider subscribing to industry newsletters, following relevant companies and organizations, or regularly checking reputable industry news sources and publications.
Methodology
Step 1 - Identification of Relevant Samples Size from Population Database


Step 2 - Approaches for Defining Global Market Size (Value, Volume* & Price*)

Note*: In applicable scenarios
Step 3 - Data Sources
Primary Research
- Web Analytics
- Survey Reports
- Research Institute
- Latest Research Reports
- Opinion Leaders
Secondary Research
- Annual Reports
- White Paper
- Latest Press Release
- Industry Association
- Paid Database
- Investor Presentations

Step 4 - Data Triangulation
Involves using different sources of information in order to increase the validity of a study
These sources are likely to be stakeholders in a program - participants, other researchers, program staff, other community members, and so on.
Then we put all data in single framework & apply various statistical tools to find out the dynamic on the market.
During the analysis stage, feedback from the stakeholder groups would be compared to determine areas of agreement as well as areas of divergence