

Key Insights
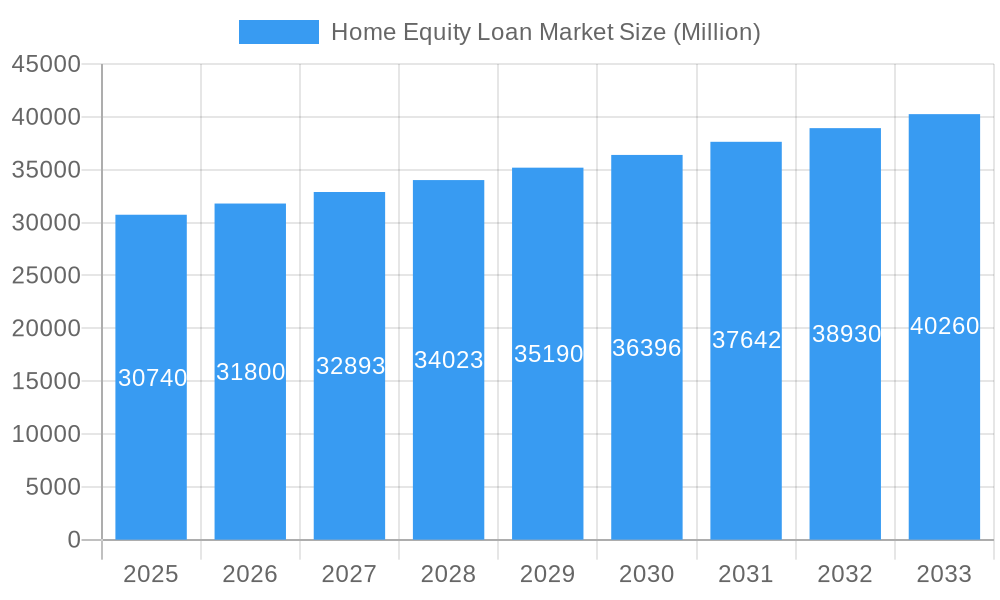
The home equity loan market, valued at $30.74 billion in 2025, is projected to experience steady growth, exhibiting a compound annual growth rate (CAGR) of 3.50% from 2025 to 2033. This growth is fueled by several key drivers. Rising home values in many regions provide homeowners with increased equity, making them eligible for larger loan amounts. Low interest rates, while potentially fluctuating, continue to incentivize borrowing for home improvements, debt consolidation, or other major expenses. Increased awareness of home equity loan options through financial literacy initiatives and targeted marketing campaigns also contribute to market expansion. However, potential economic downturns and rising inflation could act as restraints, impacting consumer confidence and reducing borrowing activity. The market is segmented by loan type (fixed-rate, adjustable-rate), loan purpose (home improvements, debt consolidation), and borrower demographics (age, income). Key players such as Bank of America, Discover Bank, LoanDepot, and others compete intensely, focusing on providing competitive interest rates, convenient online platforms, and efficient customer service to attract and retain borrowers. The competitive landscape fosters innovation in product offerings and customer experiences.
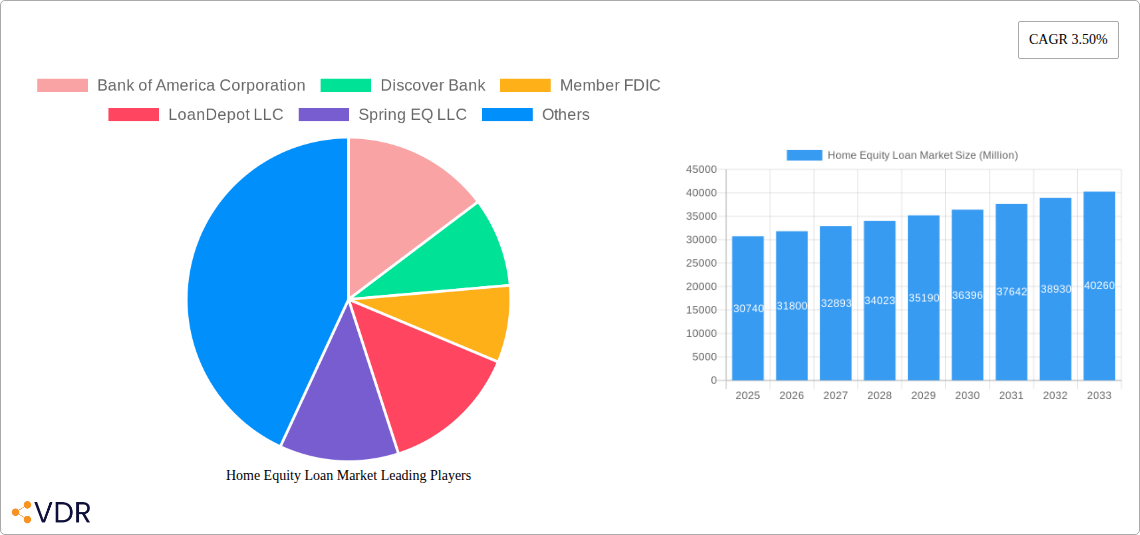
Home Equity Loan Market Market Size (In Billion)
The forecast period (2025-2033) anticipates continued, albeit moderate, growth in the home equity loan market. This growth will likely be influenced by broader macroeconomic factors such as interest rate fluctuations, inflation levels, and overall consumer spending. The segment focused on home improvements is expected to maintain significant market share, driven by the ongoing demand for upgrades and renovations. Strategic partnerships between lenders and home improvement companies could further fuel this segment's growth. The geographic distribution of the market will likely reflect regional differences in home values, economic conditions, and lending regulations. While precise regional data is unavailable, we can anticipate higher market penetration in regions with robust housing markets and strong economic performance. Competition will remain fierce, pushing lenders to innovate and offer attractive loan terms to capture market share.
Home Equity Loan Market Company Market Share
Home Equity Loan Market: A Comprehensive Market Report (2019-2033)
This in-depth report provides a comprehensive analysis of the Home Equity Loan Market, encompassing market dynamics, growth trends, regional dominance, product landscape, key players, and future outlook. The study period covers 2019-2033, with 2025 as the base and estimated year. The report segments the market to provide a granular understanding of its evolution and future potential, offering invaluable insights for industry professionals, investors, and strategic decision-makers. The market size is projected to reach xx Million by 2033.
Home Equity Loan Market Market Dynamics & Structure
This section analyzes the competitive landscape, technological advancements, regulatory influences, and market trends within the Home Equity Loan Market, including parent markets (e.g., the broader mortgage market) and child markets (e.g., specific home equity loan product types). The analysis considers factors such as market concentration, M&A activity, and the impact of substitute financial products.
Market Structure:
- High level of competition: The market is characterized by a mix of large national banks (e.g., Bank of America Corporation, U S Bank, The PNC Financial Services Group Inc) and smaller regional banks and credit unions (e.g., Pentagon Federal Credit Union, TBK BANK, SSB). The presence of online lenders (e.g., LoanDepot LLC, Spring EQ LLC) and specialized financial institutions is also significant. Market share data for key players will be detailed within the full report.
- Technological Innovation: Digitalization and fintech are driving efficiency and innovation, impacting origination processes, customer acquisition, and risk management. The adoption of AI and machine learning for credit scoring and fraud detection is a key trend.
- Regulatory Framework: Stringent regulations related to lending practices, consumer protection, and data privacy are key considerations. These regulations vary across geographies and significantly influence market dynamics.
- Competitive Substitutes: Other forms of financing, such as personal loans, refinancing options, and HELOCs, provide competing alternatives. The report analyses the comparative advantages and disadvantages of these substitutes.
- M&A Activity: Recent mergers and acquisitions, such as Redfin's acquisition of Bay Equity Home Loans (USD 137.8 Million in April 2022) and the Ontario Teachers' Pension Plan Board's acquisition of HomeEquity Bank in July 2022, illustrate strategic moves to consolidate market share and expand service offerings. The report will delve into the impact of these and other transactions.
- End-User Demographics: Market segmentation based on homeowner demographics (age, income, location, creditworthiness) provides insight into varying demand drivers and associated risks.
Home Equity Loan Market Growth Trends & Insights
This section delves into the historical and projected growth of the Home Equity Loan market, examining key drivers and growth inhibitors. The analysis will leverage robust datasets and econometric modeling to derive key insights and forecasts. This section will examine the influence of macroeconomic conditions (e.g., interest rates, housing market trends) and consumer behavior (e.g., homeownership rates, debt levels). Specific metrics such as CAGR and market penetration will be used to quantify growth trends. Further, it will examine market shifts driven by technological innovations and changing consumer preferences.
The report will provide a detailed analysis using proprietary data and industry reports. (e.g., specific CAGR figures will be provided within the full report, based on the data analysis).
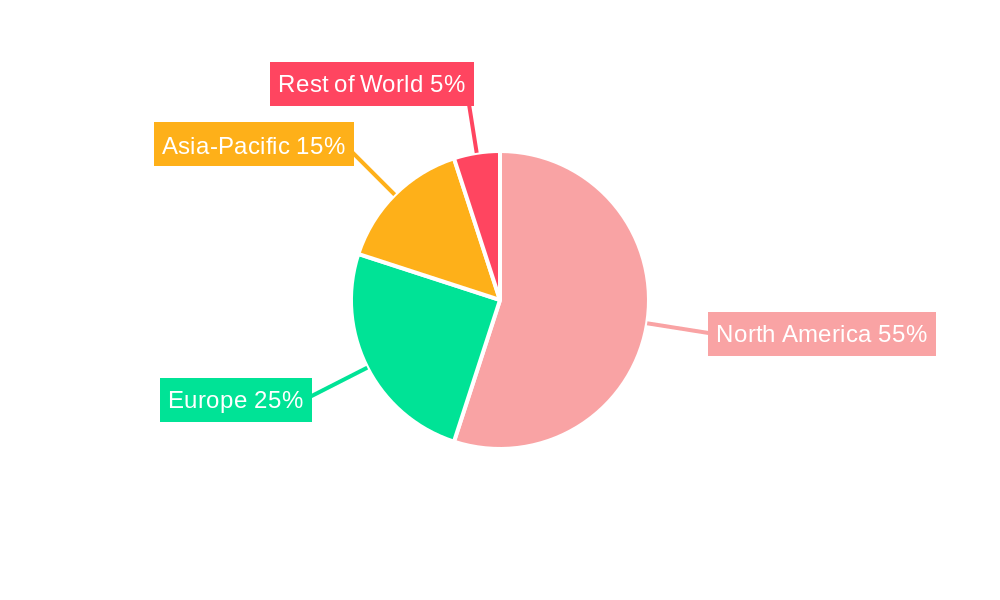
Dominant Regions, Countries, or Segments in Home Equity Loan Market
This section identifies the leading geographic regions and market segments driving growth within the Home Equity Loan Market. The analysis will consider factors such as economic conditions, housing market performance, regulatory environments, and consumer preferences.
- United States: Remains the dominant market due to its large housing market and robust economy. (Specific market share data provided in full report).
- Canada: A significant market, driven by the popularity of reverse mortgages and government-backed lending programs. (Specific market share data provided in full report).
- Other Regions: This segment will explore emerging markets and growth opportunities in other regions based on specific market conditions. (Specific market share data provided in full report).
Key Drivers of Regional Dominance:
- Strong Housing Markets: Regions with robust housing markets, marked by increasing home values and high levels of homeownership, naturally experience greater demand for home equity loans.
- Favorable Economic Conditions: Strong economic growth and low unemployment rates contribute to higher consumer confidence and borrowing capacity.
- Government Policies: Policies and programs that promote homeownership or provide incentives for home equity borrowing stimulate market growth.
Home Equity Loan Market Product Landscape
This section provides an overview of home equity loan products, their features, and market trends. Key product distinctions and innovations, including technological enhancements that streamline application processes, improve underwriting, and enhance customer experience, will be addressed. The report also analyzes the competitive landscape based on the unique value propositions offered by different lenders.
Key Drivers, Barriers & Challenges in Home Equity Loan Market
Key Drivers:
- Rising Home Values: Increased home equity provides greater borrowing capacity, driving demand for home equity loans.
- Low Interest Rates (Historically): Periods of low-interest rates make home equity loans more affordable and attractive.
- Home Improvement Projects: Homeowners often utilize home equity loans for home renovations and upgrades.
Challenges & Restraints:
- Economic Downturns: Recessions and economic uncertainty reduce consumer confidence and limit borrowing capacity. The report will quantify the historical impact of previous economic downturns on market performance.
- Regulatory Scrutiny: Stricter lending regulations can constrain access to home equity loans and increase lender compliance costs. (Quantitative analysis on the impact of specific regulations provided in the full report).
- Competition: Intense competition from other financial products (e.g., personal loans, HELOCs) can limit market growth for specific loan types.
Emerging Opportunities in Home Equity Loan Market
- Growth in Underserved Markets: Expanding access to home equity loans in underserved communities can unlock significant growth potential.
- Innovative Product Development: The development of new home equity loan products tailored to specific consumer needs.
- Technological Advancements: Using Fintech to create a more efficient and user-friendly home equity loan application and management process.
Growth Accelerators in the Home Equity Loan Market Industry
Technological innovations, such as AI-powered credit scoring and automated underwriting, are streamlining processes and reducing costs. Strategic partnerships between lenders and real estate companies are creating new opportunities for cross-selling and customer acquisition. Expansion into new geographic markets and underserved segments further drives growth.
Key Players Shaping the Home Equity Loan Market Market
- Bank of America Corporation
- Discover Bank
- Member FDIC
- LoanDepot LLC
- Spring EQ LLC
- TBK BANK
- SSB
- U S Bank
- Pentagon Federal Credit Union
- The PNC Financial Services Group Inc
Notable Milestones in Home Equity Loan Market Sector
- April 2022: Redfin acquires Bay Equity Home Loans for USD 137.8 Million, expanding its reach in the home financing market.
- July 2022: Ontario Teachers' Pension Plan Board acquires HomeQ (parent company of HomeEquity Bank), signifying increased investment in the reverse mortgage sector.
In-Depth Home Equity Loan Market Market Outlook
The future of the home equity loan market is characterized by continued technological advancements, evolving consumer preferences, and dynamic economic conditions. Strategic partnerships, product innovation, and expansion into new markets will drive long-term growth. The market presents significant opportunities for lenders who can effectively adapt to the evolving regulatory landscape and meet the diverse needs of homeowners.
Home Equity Loan Market Segmentation
-
1. Types
- 1.1. Fixed Rate Loans
- 1.2. Home Equity Line of Credit
-
2. Service Providers
- 2.1. Banks
- 2.2. Online
- 2.3. Credit Union
- 2.4. Others
Home Equity Loan Market Segmentation By Geography
-
1. North America
- 1.1. United States
- 1.2. Canada
- 1.3. Mexico
-
2. South America
- 2.1. Brazil
- 2.2. Argentina
- 2.3. Rest of South America
-
3. Europe
- 3.1. United Kingdom
- 3.2. Germany
- 3.3. France
- 3.4. Italy
- 3.5. Spain
- 3.6. Russia
- 3.7. Benelux
- 3.8. Nordics
- 3.9. Rest of Europe
-
4. Middle East & Africa
- 4.1. Turkey
- 4.2. Israel
- 4.3. GCC
- 4.4. North Africa
- 4.5. South Africa
- 4.6. Rest of Middle East & Africa
-
5. Asia Pacific
- 5.1. China
- 5.2. India
- 5.3. Japan
- 5.4. South Korea
- 5.5. ASEAN
- 5.6. Oceania
- 5.7. Rest of Asia Pacific
Home Equity Loan Market Regional Market Share
Geographic Coverage of Home Equity Loan Market
Home Equity Loan Market REPORT HIGHLIGHTS
| Aspects | Details |
|---|---|
| Study Period | 2020-2034 |
| Base Year | 2025 |
| Estimated Year | 2026 |
| Forecast Period | 2026-2034 |
| Historical Period | 2020-2025 |
| Growth Rate | CAGR of 3.50% from 2020-2034 |
| Segmentation |
|
Table of Contents
- 1. Introduction
- 1.1. Research Scope
- 1.2. Market Segmentation
- 1.3. Research Objective
- 1.4. Definitions and Assumptions
- 2. Executive Summary
- 2.1. Market Snapshot
- 3. Market Dynamics
- 3.1. Market Drivers
- 3.2. Market Restrains
- 3.3. Market Trends
- 3.4. Market Opportunities
- 4. Market Factor Analysis
- 4.1. Porters Five Forces
- 4.1.1. Bargaining Power of Suppliers
- 4.1.2. Bargaining Power of Buyers
- 4.1.3. Threat of New Entrants
- 4.1.4. Threat of Substitutes
- 4.1.5. Competitive Rivalry
- 4.2. PESTEL analysis
- 4.3. BCG Analysis
- 4.3.1. Stars (High Growth, High Market Share)
- 4.3.2. Cash Cows (Low Growth, High Market Share)
- 4.3.3. Question Mark (High Growth, Low Market Share)
- 4.3.4. Dogs (Low Growth, Low Market Share)
- 4.4. Ansoff Matrix Analysis
- 4.5. Supply Chain Analysis
- 4.6. Regulatory Landscape
- 4.7. Current Market Potential and Opportunity Assessment (TAM–SAM–SOM Framework)
- 4.8. VDR Analyst Note
- 4.1. Porters Five Forces
- 5. Market Analysis, Insights and Forecast 2021-2033
- 5.1. Market Analysis, Insights and Forecast - by Types
- 5.1.1. Fixed Rate Loans
- 5.1.2. Home Equity Line of Credit
- 5.2. Market Analysis, Insights and Forecast - by Service Providers
- 5.2.1. Banks
- 5.2.2. Online
- 5.2.3. Credit Union
- 5.2.4. Others
- 5.3. Market Analysis, Insights and Forecast - by Region
- 5.3.1. North America
- 5.3.2. South America
- 5.3.3. Europe
- 5.3.4. Middle East & Africa
- 5.3.5. Asia Pacific
- 5.1. Market Analysis, Insights and Forecast - by Types
- 6. Global Home Equity Loan Market Analysis, Insights and Forecast, 2021-2033
- 6.1. Market Analysis, Insights and Forecast - by Types
- 6.1.1. Fixed Rate Loans
- 6.1.2. Home Equity Line of Credit
- 6.2. Market Analysis, Insights and Forecast - by Service Providers
- 6.2.1. Banks
- 6.2.2. Online
- 6.2.3. Credit Union
- 6.2.4. Others
- 6.1. Market Analysis, Insights and Forecast - by Types
- 7. North America Home Equity Loan Market Analysis, Insights and Forecast, 2021-2033
- 7.1. Market Analysis, Insights and Forecast - by Types
- 7.1.1. Fixed Rate Loans
- 7.1.2. Home Equity Line of Credit
- 7.2. Market Analysis, Insights and Forecast - by Service Providers
- 7.2.1. Banks
- 7.2.2. Online
- 7.2.3. Credit Union
- 7.2.4. Others
- 7.1. Market Analysis, Insights and Forecast - by Types
- 8. South America Home Equity Loan Market Analysis, Insights and Forecast, 2021-2033
- 8.1. Market Analysis, Insights and Forecast - by Types
- 8.1.1. Fixed Rate Loans
- 8.1.2. Home Equity Line of Credit
- 8.2. Market Analysis, Insights and Forecast - by Service Providers
- 8.2.1. Banks
- 8.2.2. Online
- 8.2.3. Credit Union
- 8.2.4. Others
- 8.1. Market Analysis, Insights and Forecast - by Types
- 9. Europe Home Equity Loan Market Analysis, Insights and Forecast, 2021-2033
- 9.1. Market Analysis, Insights and Forecast - by Types
- 9.1.1. Fixed Rate Loans
- 9.1.2. Home Equity Line of Credit
- 9.2. Market Analysis, Insights and Forecast - by Service Providers
- 9.2.1. Banks
- 9.2.2. Online
- 9.2.3. Credit Union
- 9.2.4. Others
- 9.1. Market Analysis, Insights and Forecast - by Types
- 10. Middle East & Africa Home Equity Loan Market Analysis, Insights and Forecast, 2021-2033
- 10.1. Market Analysis, Insights and Forecast - by Types
- 10.1.1. Fixed Rate Loans
- 10.1.2. Home Equity Line of Credit
- 10.2. Market Analysis, Insights and Forecast - by Service Providers
- 10.2.1. Banks
- 10.2.2. Online
- 10.2.3. Credit Union
- 10.2.4. Others
- 10.1. Market Analysis, Insights and Forecast - by Types
- 11. Asia Pacific Home Equity Loan Market Analysis, Insights and Forecast, 2021-2033
- 11.1. Market Analysis, Insights and Forecast - by Types
- 11.1.1. Fixed Rate Loans
- 11.1.2. Home Equity Line of Credit
- 11.2. Market Analysis, Insights and Forecast - by Service Providers
- 11.2.1. Banks
- 11.2.2. Online
- 11.2.3. Credit Union
- 11.2.4. Others
- 11.1. Market Analysis, Insights and Forecast - by Types
- 12. Competitive Analysis
- 12.1. Company Profiles
- 12.1.1 Bank of America Corporation
- 12.1.1.1. Company Overview
- 12.1.1.2. Products
- 12.1.1.3. Company Financials
- 12.1.1.4. SWOT Analysis
- 12.1.2 Discover Bank
- 12.1.2.1. Company Overview
- 12.1.2.2. Products
- 12.1.2.3. Company Financials
- 12.1.2.4. SWOT Analysis
- 12.1.3 Member FDIC
- 12.1.3.1. Company Overview
- 12.1.3.2. Products
- 12.1.3.3. Company Financials
- 12.1.3.4. SWOT Analysis
- 12.1.4 LoanDepot LLC
- 12.1.4.1. Company Overview
- 12.1.4.2. Products
- 12.1.4.3. Company Financials
- 12.1.4.4. SWOT Analysis
- 12.1.5 Spring EQ LLC
- 12.1.5.1. Company Overview
- 12.1.5.2. Products
- 12.1.5.3. Company Financials
- 12.1.5.4. SWOT Analysis
- 12.1.6 TBK BANK
- 12.1.6.1. Company Overview
- 12.1.6.2. Products
- 12.1.6.3. Company Financials
- 12.1.6.4. SWOT Analysis
- 12.1.7 SSB
- 12.1.7.1. Company Overview
- 12.1.7.2. Products
- 12.1.7.3. Company Financials
- 12.1.7.4. SWOT Analysis
- 12.1.8 U S Bank
- 12.1.8.1. Company Overview
- 12.1.8.2. Products
- 12.1.8.3. Company Financials
- 12.1.8.4. SWOT Analysis
- 12.1.9 Pentagon Federal Credit Union
- 12.1.9.1. Company Overview
- 12.1.9.2. Products
- 12.1.9.3. Company Financials
- 12.1.9.4. SWOT Analysis
- 12.1.10 The PNC Financial Services Group Inc **List Not Exhaustive
- 12.1.10.1. Company Overview
- 12.1.10.2. Products
- 12.1.10.3. Company Financials
- 12.1.10.4. SWOT Analysis
- 12.1.1 Bank of America Corporation
- 12.2. Market Entropy
- 12.2.1 Company's Key Areas Served
- 12.2.2 Recent Developments
- 12.3. Company Market Share Analysis 2025
- 12.3.1 Top 5 Companies Market Share Analysis
- 12.3.2 Top 3 Companies Market Share Analysis
- 12.4. List of Potential Customers
- 13. Research Methodology
List of Figures
- Figure 1: Global Home Equity Loan Market Revenue Breakdown (Million, %) by Region 2025 & 2033
- Figure 2: Global Home Equity Loan Market Volume Breakdown (Billion, %) by Region 2025 & 2033
- Figure 3: North America Home Equity Loan Market Revenue (Million), by Types 2025 & 2033
- Figure 4: North America Home Equity Loan Market Volume (Billion), by Types 2025 & 2033
- Figure 5: North America Home Equity Loan Market Revenue Share (%), by Types 2025 & 2033
- Figure 6: North America Home Equity Loan Market Volume Share (%), by Types 2025 & 2033
- Figure 7: North America Home Equity Loan Market Revenue (Million), by Service Providers 2025 & 2033
- Figure 8: North America Home Equity Loan Market Volume (Billion), by Service Providers 2025 & 2033
- Figure 9: North America Home Equity Loan Market Revenue Share (%), by Service Providers 2025 & 2033
- Figure 10: North America Home Equity Loan Market Volume Share (%), by Service Providers 2025 & 2033
- Figure 11: North America Home Equity Loan Market Revenue (Million), by Country 2025 & 2033
- Figure 12: North America Home Equity Loan Market Volume (Billion), by Country 2025 & 2033
- Figure 13: North America Home Equity Loan Market Revenue Share (%), by Country 2025 & 2033
- Figure 14: North America Home Equity Loan Market Volume Share (%), by Country 2025 & 2033
- Figure 15: South America Home Equity Loan Market Revenue (Million), by Types 2025 & 2033
- Figure 16: South America Home Equity Loan Market Volume (Billion), by Types 2025 & 2033
- Figure 17: South America Home Equity Loan Market Revenue Share (%), by Types 2025 & 2033
- Figure 18: South America Home Equity Loan Market Volume Share (%), by Types 2025 & 2033
- Figure 19: South America Home Equity Loan Market Revenue (Million), by Service Providers 2025 & 2033
- Figure 20: South America Home Equity Loan Market Volume (Billion), by Service Providers 2025 & 2033
- Figure 21: South America Home Equity Loan Market Revenue Share (%), by Service Providers 2025 & 2033
- Figure 22: South America Home Equity Loan Market Volume Share (%), by Service Providers 2025 & 2033
- Figure 23: South America Home Equity Loan Market Revenue (Million), by Country 2025 & 2033
- Figure 24: South America Home Equity Loan Market Volume (Billion), by Country 2025 & 2033
- Figure 25: South America Home Equity Loan Market Revenue Share (%), by Country 2025 & 2033
- Figure 26: South America Home Equity Loan Market Volume Share (%), by Country 2025 & 2033
- Figure 27: Europe Home Equity Loan Market Revenue (Million), by Types 2025 & 2033
- Figure 28: Europe Home Equity Loan Market Volume (Billion), by Types 2025 & 2033
- Figure 29: Europe Home Equity Loan Market Revenue Share (%), by Types 2025 & 2033
- Figure 30: Europe Home Equity Loan Market Volume Share (%), by Types 2025 & 2033
- Figure 31: Europe Home Equity Loan Market Revenue (Million), by Service Providers 2025 & 2033
- Figure 32: Europe Home Equity Loan Market Volume (Billion), by Service Providers 2025 & 2033
- Figure 33: Europe Home Equity Loan Market Revenue Share (%), by Service Providers 2025 & 2033
- Figure 34: Europe Home Equity Loan Market Volume Share (%), by Service Providers 2025 & 2033
- Figure 35: Europe Home Equity Loan Market Revenue (Million), by Country 2025 & 2033
- Figure 36: Europe Home Equity Loan Market Volume (Billion), by Country 2025 & 2033
- Figure 37: Europe Home Equity Loan Market Revenue Share (%), by Country 2025 & 2033
- Figure 38: Europe Home Equity Loan Market Volume Share (%), by Country 2025 & 2033
- Figure 39: Middle East & Africa Home Equity Loan Market Revenue (Million), by Types 2025 & 2033
- Figure 40: Middle East & Africa Home Equity Loan Market Volume (Billion), by Types 2025 & 2033
- Figure 41: Middle East & Africa Home Equity Loan Market Revenue Share (%), by Types 2025 & 2033
- Figure 42: Middle East & Africa Home Equity Loan Market Volume Share (%), by Types 2025 & 2033
- Figure 43: Middle East & Africa Home Equity Loan Market Revenue (Million), by Service Providers 2025 & 2033
- Figure 44: Middle East & Africa Home Equity Loan Market Volume (Billion), by Service Providers 2025 & 2033
- Figure 45: Middle East & Africa Home Equity Loan Market Revenue Share (%), by Service Providers 2025 & 2033
- Figure 46: Middle East & Africa Home Equity Loan Market Volume Share (%), by Service Providers 2025 & 2033
- Figure 47: Middle East & Africa Home Equity Loan Market Revenue (Million), by Country 2025 & 2033
- Figure 48: Middle East & Africa Home Equity Loan Market Volume (Billion), by Country 2025 & 2033
- Figure 49: Middle East & Africa Home Equity Loan Market Revenue Share (%), by Country 2025 & 2033
- Figure 50: Middle East & Africa Home Equity Loan Market Volume Share (%), by Country 2025 & 2033
- Figure 51: Asia Pacific Home Equity Loan Market Revenue (Million), by Types 2025 & 2033
- Figure 52: Asia Pacific Home Equity Loan Market Volume (Billion), by Types 2025 & 2033
- Figure 53: Asia Pacific Home Equity Loan Market Revenue Share (%), by Types 2025 & 2033
- Figure 54: Asia Pacific Home Equity Loan Market Volume Share (%), by Types 2025 & 2033
- Figure 55: Asia Pacific Home Equity Loan Market Revenue (Million), by Service Providers 2025 & 2033
- Figure 56: Asia Pacific Home Equity Loan Market Volume (Billion), by Service Providers 2025 & 2033
- Figure 57: Asia Pacific Home Equity Loan Market Revenue Share (%), by Service Providers 2025 & 2033
- Figure 58: Asia Pacific Home Equity Loan Market Volume Share (%), by Service Providers 2025 & 2033
- Figure 59: Asia Pacific Home Equity Loan Market Revenue (Million), by Country 2025 & 2033
- Figure 60: Asia Pacific Home Equity Loan Market Volume (Billion), by Country 2025 & 2033
- Figure 61: Asia Pacific Home Equity Loan Market Revenue Share (%), by Country 2025 & 2033
- Figure 62: Asia Pacific Home Equity Loan Market Volume Share (%), by Country 2025 & 2033
List of Tables
- Table 1: Global Home Equity Loan Market Revenue Million Forecast, by Types 2020 & 2033
- Table 2: Global Home Equity Loan Market Volume Billion Forecast, by Types 2020 & 2033
- Table 3: Global Home Equity Loan Market Revenue Million Forecast, by Service Providers 2020 & 2033
- Table 4: Global Home Equity Loan Market Volume Billion Forecast, by Service Providers 2020 & 2033
- Table 5: Global Home Equity Loan Market Revenue Million Forecast, by Region 2020 & 2033
- Table 6: Global Home Equity Loan Market Volume Billion Forecast, by Region 2020 & 2033
- Table 7: Global Home Equity Loan Market Revenue Million Forecast, by Types 2020 & 2033
- Table 8: Global Home Equity Loan Market Volume Billion Forecast, by Types 2020 & 2033
- Table 9: Global Home Equity Loan Market Revenue Million Forecast, by Service Providers 2020 & 2033
- Table 10: Global Home Equity Loan Market Volume Billion Forecast, by Service Providers 2020 & 2033
- Table 11: Global Home Equity Loan Market Revenue Million Forecast, by Country 2020 & 2033
- Table 12: Global Home Equity Loan Market Volume Billion Forecast, by Country 2020 & 2033
- Table 13: United States Home Equity Loan Market Revenue (Million) Forecast, by Application 2020 & 2033
- Table 14: United States Home Equity Loan Market Volume (Billion) Forecast, by Application 2020 & 2033
- Table 15: Canada Home Equity Loan Market Revenue (Million) Forecast, by Application 2020 & 2033
- Table 16: Canada Home Equity Loan Market Volume (Billion) Forecast, by Application 2020 & 2033
- Table 17: Mexico Home Equity Loan Market Revenue (Million) Forecast, by Application 2020 & 2033
- Table 18: Mexico Home Equity Loan Market Volume (Billion) Forecast, by Application 2020 & 2033
- Table 19: Global Home Equity Loan Market Revenue Million Forecast, by Types 2020 & 2033
- Table 20: Global Home Equity Loan Market Volume Billion Forecast, by Types 2020 & 2033
- Table 21: Global Home Equity Loan Market Revenue Million Forecast, by Service Providers 2020 & 2033
- Table 22: Global Home Equity Loan Market Volume Billion Forecast, by Service Providers 2020 & 2033
- Table 23: Global Home Equity Loan Market Revenue Million Forecast, by Country 2020 & 2033
- Table 24: Global Home Equity Loan Market Volume Billion Forecast, by Country 2020 & 2033
- Table 25: Brazil Home Equity Loan Market Revenue (Million) Forecast, by Application 2020 & 2033
- Table 26: Brazil Home Equity Loan Market Volume (Billion) Forecast, by Application 2020 & 2033
- Table 27: Argentina Home Equity Loan Market Revenue (Million) Forecast, by Application 2020 & 2033
- Table 28: Argentina Home Equity Loan Market Volume (Billion) Forecast, by Application 2020 & 2033
- Table 29: Rest of South America Home Equity Loan Market Revenue (Million) Forecast, by Application 2020 & 2033
- Table 30: Rest of South America Home Equity Loan Market Volume (Billion) Forecast, by Application 2020 & 2033
- Table 31: Global Home Equity Loan Market Revenue Million Forecast, by Types 2020 & 2033
- Table 32: Global Home Equity Loan Market Volume Billion Forecast, by Types 2020 & 2033
- Table 33: Global Home Equity Loan Market Revenue Million Forecast, by Service Providers 2020 & 2033
- Table 34: Global Home Equity Loan Market Volume Billion Forecast, by Service Providers 2020 & 2033
- Table 35: Global Home Equity Loan Market Revenue Million Forecast, by Country 2020 & 2033
- Table 36: Global Home Equity Loan Market Volume Billion Forecast, by Country 2020 & 2033
- Table 37: United Kingdom Home Equity Loan Market Revenue (Million) Forecast, by Application 2020 & 2033
- Table 38: United Kingdom Home Equity Loan Market Volume (Billion) Forecast, by Application 2020 & 2033
- Table 39: Germany Home Equity Loan Market Revenue (Million) Forecast, by Application 2020 & 2033
- Table 40: Germany Home Equity Loan Market Volume (Billion) Forecast, by Application 2020 & 2033
- Table 41: France Home Equity Loan Market Revenue (Million) Forecast, by Application 2020 & 2033
- Table 42: France Home Equity Loan Market Volume (Billion) Forecast, by Application 2020 & 2033
- Table 43: Italy Home Equity Loan Market Revenue (Million) Forecast, by Application 2020 & 2033
- Table 44: Italy Home Equity Loan Market Volume (Billion) Forecast, by Application 2020 & 2033
- Table 45: Spain Home Equity Loan Market Revenue (Million) Forecast, by Application 2020 & 2033
- Table 46: Spain Home Equity Loan Market Volume (Billion) Forecast, by Application 2020 & 2033
- Table 47: Russia Home Equity Loan Market Revenue (Million) Forecast, by Application 2020 & 2033
- Table 48: Russia Home Equity Loan Market Volume (Billion) Forecast, by Application 2020 & 2033
- Table 49: Benelux Home Equity Loan Market Revenue (Million) Forecast, by Application 2020 & 2033
- Table 50: Benelux Home Equity Loan Market Volume (Billion) Forecast, by Application 2020 & 2033
- Table 51: Nordics Home Equity Loan Market Revenue (Million) Forecast, by Application 2020 & 2033
- Table 52: Nordics Home Equity Loan Market Volume (Billion) Forecast, by Application 2020 & 2033
- Table 53: Rest of Europe Home Equity Loan Market Revenue (Million) Forecast, by Application 2020 & 2033
- Table 54: Rest of Europe Home Equity Loan Market Volume (Billion) Forecast, by Application 2020 & 2033
- Table 55: Global Home Equity Loan Market Revenue Million Forecast, by Types 2020 & 2033
- Table 56: Global Home Equity Loan Market Volume Billion Forecast, by Types 2020 & 2033
- Table 57: Global Home Equity Loan Market Revenue Million Forecast, by Service Providers 2020 & 2033
- Table 58: Global Home Equity Loan Market Volume Billion Forecast, by Service Providers 2020 & 2033
- Table 59: Global Home Equity Loan Market Revenue Million Forecast, by Country 2020 & 2033
- Table 60: Global Home Equity Loan Market Volume Billion Forecast, by Country 2020 & 2033
- Table 61: Turkey Home Equity Loan Market Revenue (Million) Forecast, by Application 2020 & 2033
- Table 62: Turkey Home Equity Loan Market Volume (Billion) Forecast, by Application 2020 & 2033
- Table 63: Israel Home Equity Loan Market Revenue (Million) Forecast, by Application 2020 & 2033
- Table 64: Israel Home Equity Loan Market Volume (Billion) Forecast, by Application 2020 & 2033
- Table 65: GCC Home Equity Loan Market Revenue (Million) Forecast, by Application 2020 & 2033
- Table 66: GCC Home Equity Loan Market Volume (Billion) Forecast, by Application 2020 & 2033
- Table 67: North Africa Home Equity Loan Market Revenue (Million) Forecast, by Application 2020 & 2033
- Table 68: North Africa Home Equity Loan Market Volume (Billion) Forecast, by Application 2020 & 2033
- Table 69: South Africa Home Equity Loan Market Revenue (Million) Forecast, by Application 2020 & 2033
- Table 70: South Africa Home Equity Loan Market Volume (Billion) Forecast, by Application 2020 & 2033
- Table 71: Rest of Middle East & Africa Home Equity Loan Market Revenue (Million) Forecast, by Application 2020 & 2033
- Table 72: Rest of Middle East & Africa Home Equity Loan Market Volume (Billion) Forecast, by Application 2020 & 2033
- Table 73: Global Home Equity Loan Market Revenue Million Forecast, by Types 2020 & 2033
- Table 74: Global Home Equity Loan Market Volume Billion Forecast, by Types 2020 & 2033
- Table 75: Global Home Equity Loan Market Revenue Million Forecast, by Service Providers 2020 & 2033
- Table 76: Global Home Equity Loan Market Volume Billion Forecast, by Service Providers 2020 & 2033
- Table 77: Global Home Equity Loan Market Revenue Million Forecast, by Country 2020 & 2033
- Table 78: Global Home Equity Loan Market Volume Billion Forecast, by Country 2020 & 2033
- Table 79: China Home Equity Loan Market Revenue (Million) Forecast, by Application 2020 & 2033
- Table 80: China Home Equity Loan Market Volume (Billion) Forecast, by Application 2020 & 2033
- Table 81: India Home Equity Loan Market Revenue (Million) Forecast, by Application 2020 & 2033
- Table 82: India Home Equity Loan Market Volume (Billion) Forecast, by Application 2020 & 2033
- Table 83: Japan Home Equity Loan Market Revenue (Million) Forecast, by Application 2020 & 2033
- Table 84: Japan Home Equity Loan Market Volume (Billion) Forecast, by Application 2020 & 2033
- Table 85: South Korea Home Equity Loan Market Revenue (Million) Forecast, by Application 2020 & 2033
- Table 86: South Korea Home Equity Loan Market Volume (Billion) Forecast, by Application 2020 & 2033
- Table 87: ASEAN Home Equity Loan Market Revenue (Million) Forecast, by Application 2020 & 2033
- Table 88: ASEAN Home Equity Loan Market Volume (Billion) Forecast, by Application 2020 & 2033
- Table 89: Oceania Home Equity Loan Market Revenue (Million) Forecast, by Application 2020 & 2033
- Table 90: Oceania Home Equity Loan Market Volume (Billion) Forecast, by Application 2020 & 2033
- Table 91: Rest of Asia Pacific Home Equity Loan Market Revenue (Million) Forecast, by Application 2020 & 2033
- Table 92: Rest of Asia Pacific Home Equity Loan Market Volume (Billion) Forecast, by Application 2020 & 2033
Frequently Asked Questions
1. What is the projected Compound Annual Growth Rate (CAGR) of the Home Equity Loan Market?
The projected CAGR is approximately 3.50%.
2. Which companies are prominent players in the Home Equity Loan Market?
Key companies in the market include Bank of America Corporation, Discover Bank, Member FDIC, LoanDepot LLC, Spring EQ LLC, TBK BANK, SSB, U S Bank, Pentagon Federal Credit Union, The PNC Financial Services Group Inc **List Not Exhaustive.
3. What are the main segments of the Home Equity Loan Market?
The market segments include Types, Service Providers.
4. Can you provide details about the market size?
The market size is estimated to be USD 30.74 Million as of 2022.
5. What are some drivers contributing to market growth?
Increase In Sales of Household Units; Higher Duration of Repayment.
6. What are the notable trends driving market growth?
Access to Large Amount of Loan.
7. Are there any restraints impacting market growth?
Increase In Sales of Household Units; Higher Duration of Repayment.
8. Can you provide examples of recent developments in the market?
In April 2022, Redfin a real estate company based in Seattle (United States) acquired Bay Equity Home Loans with a sum of USD 137.8 Million. The merger accelerates Redfin’s strategy for expanding its business with customers to buy, sell, rent, and finance a home.
9. What pricing options are available for accessing the report?
Pricing options include single-user, multi-user, and enterprise licenses priced at USD 3800, USD 4500, and USD 5800 respectively.
10. Is the market size provided in terms of value or volume?
The market size is provided in terms of value, measured in Million and volume, measured in Billion.
11. Are there any specific market keywords associated with the report?
Yes, the market keyword associated with the report is "Home Equity Loan Market," which aids in identifying and referencing the specific market segment covered.
12. How do I determine which pricing option suits my needs best?
The pricing options vary based on user requirements and access needs. Individual users may opt for single-user licenses, while businesses requiring broader access may choose multi-user or enterprise licenses for cost-effective access to the report.
13. Are there any additional resources or data provided in the Home Equity Loan Market report?
While the report offers comprehensive insights, it's advisable to review the specific contents or supplementary materials provided to ascertain if additional resources or data are available.
14. How can I stay updated on further developments or reports in the Home Equity Loan Market?
To stay informed about further developments, trends, and reports in the Home Equity Loan Market, consider subscribing to industry newsletters, following relevant companies and organizations, or regularly checking reputable industry news sources and publications.
Methodology
Step 1 - Identification of Relevant Samples Size from Population Database


Step 2 - Approaches for Defining Global Market Size (Value, Volume* & Price*)

Note*: In applicable scenarios
Step 3 - Data Sources
Primary Research
- Web Analytics
- Survey Reports
- Research Institute
- Latest Research Reports
- Opinion Leaders
Secondary Research
- Annual Reports
- White Paper
- Latest Press Release
- Industry Association
- Paid Database
- Investor Presentations

Step 4 - Data Triangulation
Involves using different sources of information in order to increase the validity of a study
These sources are likely to be stakeholders in a program - participants, other researchers, program staff, other community members, and so on.
Then we put all data in single framework & apply various statistical tools to find out the dynamic on the market.
During the analysis stage, feedback from the stakeholder groups would be compared to determine areas of agreement as well as areas of divergence