

Key Insights
The Home Energy Storage (HES) market is experiencing significant expansion, propelled by escalating electricity costs, heightened climate change awareness, and the surge in renewable energy adoption, particularly solar power. The market, valued at approximately 61.5 billion in 2024, is forecasted to achieve a Compound Annual Growth Rate (CAGR) of 18.3% between 2024 and 2033. Key drivers for this growth include advancements in lithium-ion battery technology, offering enhanced energy density, extended lifespan, and reduced costs. Government incentives, such as tax credits and rebates, are further stimulating demand, especially in North America and Europe. Growing concerns about grid reliability and the pursuit of energy independence are motivating homeowners to invest in HES solutions for backup power and self-consumption of renewable energy.
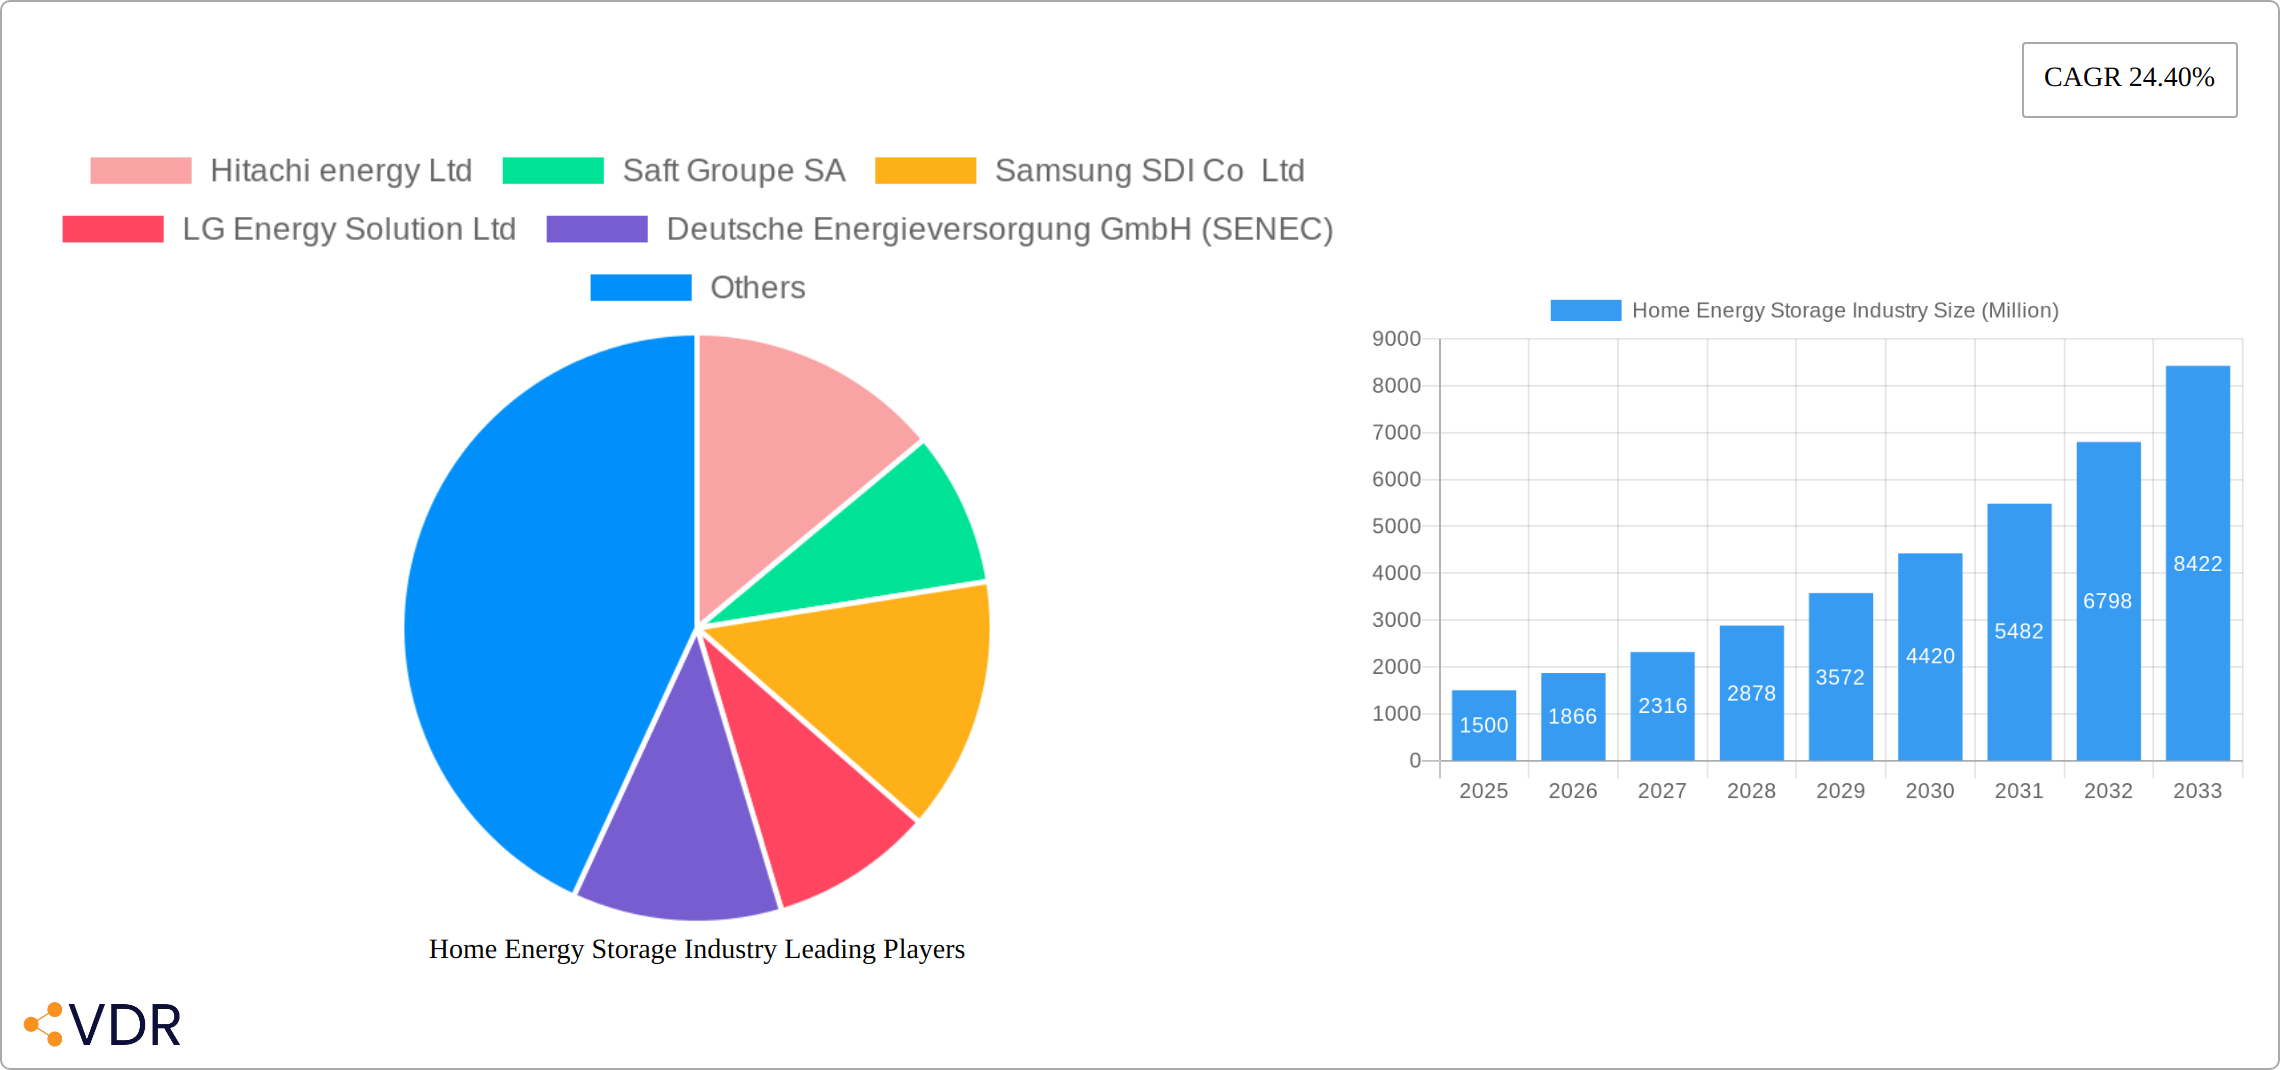
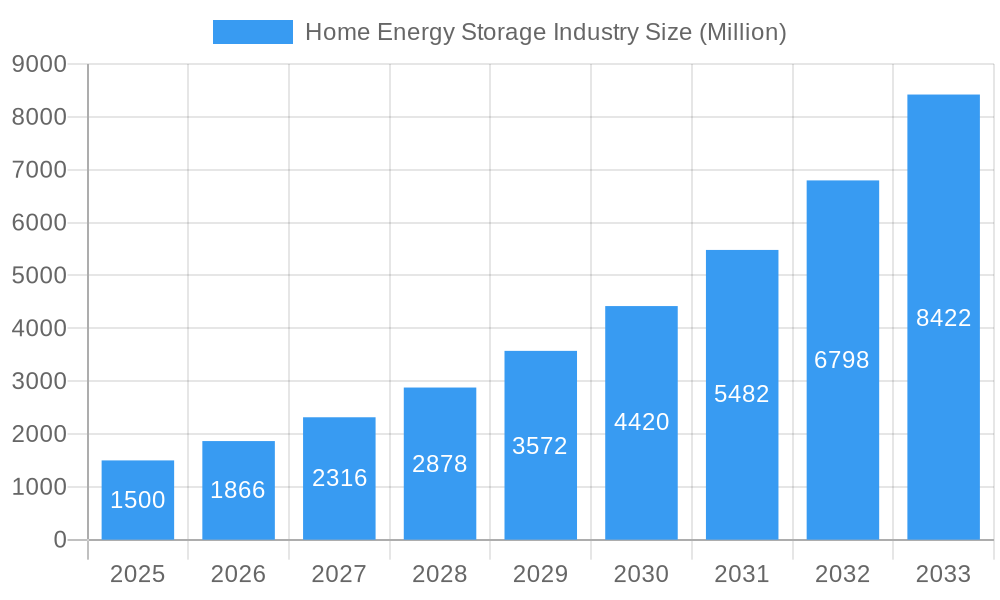
Home Energy Storage Industry Market Size (In Billion)
Despite this positive outlook, challenges persist. High upfront investment costs can deter adoption, particularly in emerging economies. Battery lifespan and long-term performance remain critical factors influencing consumer trust. Evolving regulatory frameworks and safety standards are essential for widespread, secure implementation. Intensifying competition among industry leaders, including Hitachi Energy, Saft, Samsung SDI, LG Energy Solution, and Tesla, is fostering innovation and driving price competitiveness. Lithium-ion batteries dominate market segmentation due to their superior performance over lead-acid alternatives. The Asia-Pacific region is anticipated to be a primary growth engine, driven by its increasing focus on renewable energy integration and robust economic development.
Home Energy Storage Industry Company Market Share
Home Energy Storage Industry Market Report: 2019-2033
This comprehensive report provides an in-depth analysis of the Home Energy Storage industry, encompassing market dynamics, growth trends, key players, and future outlook. The study period covers 2019-2033, with a base year of 2025 and a forecast period of 2025-2033. This report is essential for industry professionals, investors, and anyone seeking to understand this rapidly evolving market. The report segments the market by technology type (Lithium-ion Batteries, Lead-acid Batteries, Other Technology Types) and analyzes key regional and country-level trends. The global market size is expected to reach xx Million units by 2033.
Home Energy Storage Industry Market Dynamics & Structure
The home energy storage market is characterized by increasing market concentration, driven by technological advancements, supportive regulatory frameworks, and growing consumer demand for energy independence and resilience. Competition is fierce, with both established players and new entrants vying for market share. While Lithium-ion batteries dominate, other technologies are emerging. Mergers and acquisitions (M&A) are frequent, indicating consolidation and strategic expansion within the sector.
- Market Concentration: The top 5 players account for approximately xx% of the global market share in 2025.
- Technological Innovation: Continuous improvements in battery chemistry, energy density, and cost-effectiveness are key drivers. Innovation barriers include high R&D costs and the need for robust safety standards.
- Regulatory Frameworks: Government incentives (e.g., tax credits, subsidies) and grid modernization initiatives significantly influence market growth. Varying regulations across regions impact market penetration.
- Competitive Product Substitutes: Traditional backup generators and grid-tied systems pose competition, but their limitations (e.g., fuel dependence, environmental impact) are driving the shift towards energy storage.
- End-User Demographics: The primary end-users are homeowners seeking energy security, cost savings, and environmental sustainability. Market penetration is higher in regions with favorable policies and high electricity prices.
- M&A Trends: A significant number of M&A deals (xx deals in 2024) have reshaped the competitive landscape. Consolidation is expected to continue as larger players acquire smaller companies to expand their product portfolios and geographical reach.
Home Energy Storage Industry Growth Trends & Insights
The home energy storage market has experienced robust and substantial growth during the historical period (2019-2024), exhibiting a Compound Annual Growth Rate (CAGR) of xx%. This significant expansion is primarily attributed to the escalating costs of electricity, growing global awareness and concern regarding climate change, and continuous advancements in battery technology, leading to improved performance and affordability. The market is strongly anticipated to maintain this upward trajectory throughout the forecast period (2025-2033), with a projected CAGR of xx%. This sustained growth will be propelled by several key factors, including the accelerating adoption of renewable energy sources like solar and wind, further innovations in battery chemistry and manufacturing, and the increasing implementation of supportive government policies and incentives worldwide. Consumer behavior is undergoing a pronounced shift towards greater energy independence, resilience against grid outages, and a heightened commitment to sustainability, which collectively fuels the escalating demand for sophisticated home energy storage systems. Emerging technological disruptions, such as the development and commercialization of more energy-dense, efficient, and cost-effective battery technologies, alongside advancements in intelligent energy management software, are poised to significantly accelerate market expansion. Market penetration for home energy storage solutions is expected to reach an impressive xx% by 2033, signifying widespread consumer adoption.
Dominant Regions, Countries, or Segments in Home Energy Storage Industry
Currently, the North American and European markets stand as dominant forces in the home energy storage sector. This leadership is a direct result of strong and consistent policy support, notably high electricity prices that enhance the economic case for self-generation and storage, and a historical early adoption of renewable energy technologies. However, the Asia-Pacific region is rapidly emerging as a powerhouse of future growth. This dynamic shift is fueled by rapid urbanization, a consequently soaring demand for energy, and proactive government initiatives aimed at promoting and subsidizing clean energy solutions. As these regions continue to develop, they are expected to significantly contribute to the global market expansion.
- Technology Type: Lithium-ion batteries continue to be the overwhelmingly dominant technology, commanding over xx% of the market share in 2025 due to their superior energy density, extended cycle life, and improving cost-effectiveness. Nevertheless, lead-acid batteries, while older technology, retain a notable presence in specific niche applications where cost is paramount or for backup power solutions.
-
Key Drivers by Region:
- North America: The region benefits from robust government incentives, including tax credits and rebates, coupled with consistently high electricity prices and a substantial base of early adopters who champion renewable energy and energy independence.
- Europe: Stringent environmental regulations, a deep-seated commitment to renewable energy integration, and supportive policy frameworks, such as feed-in tariffs and net metering, are powerful catalysts for market expansion.
- Asia-Pacific: This region's growth is driven by a confluence of factors: rapidly increasing energy demand from burgeoning populations and industrialization, strategic government initiatives promoting clean energy adoption, and significant cost advantages in local manufacturing, making systems more accessible.
Home Energy Storage Industry Product Landscape
The home energy storage systems available in today's market encompass a diverse array of configurations, catering to a wide spectrum of needs, from compact residential units designed for individual homes to more substantial systems suitable for multi-unit dwellings or even small commercial applications. A core set of features is common across these products, including highly scalable battery capacities that can be tailored to specific energy requirements, sophisticated power management systems that optimize energy flow and usage, and seamless, often plug-and-play, integration capabilities with existing solar photovoltaic (PV) systems. The ongoing focus in product development is on significantly improving energy density, extending the operational cycle life of batteries, and enhancing overall safety features to meet rigorous standards. Differentiating factors and unique selling propositions often include advanced smart grid integration capabilities, allowing systems to interact with utility grids for demand response and grid services, user-friendly remote monitoring and control through mobile applications, and state-of-the-art safety protocols designed to prevent thermal runaway and other potential hazards. Furthermore, the pursuit of next-generation technologies, such as the development and eventual commercialization of solid-state batteries, promises to usher in an era of even greater performance, enhanced safety, and remarkable longevity for home energy storage solutions.
Key Drivers, Barriers & Challenges in Home Energy Storage Industry
Key Drivers:
- Increasing Electricity Costs: As utility prices continue their upward trend, home energy storage systems become increasingly attractive from an economic standpoint, offering consumers a way to hedge against rising energy bills and achieve significant long-term savings.
- Growing Adoption of Renewable Energy: The widespread deployment of residential solar PV systems is a major catalyst. Home energy storage is essential for maximizing the self-consumption of solar energy, enhancing the reliability of solar power by providing energy during non-solar hours, and contributing to grid stability.
- Government Incentives and Support: A variety of government programs, including federal and state tax credits, direct subsidies, performance-based incentives, and favorable net metering policies, significantly reduce the upfront cost and improve the return on investment for consumers, thereby accelerating market penetration.
Key Challenges:
- High Initial Investment Costs: Despite declining prices, the substantial upfront cost of purchasing and installing a home energy storage system remains a significant barrier for a considerable segment of potential consumers, estimated to reduce market penetration by approximately xx% in 2025.
- Limited Battery Lifespan and Degradation: Batteries naturally degrade over time and with repeated charge/discharge cycles, leading to a gradual reduction in capacity. This necessitates eventual replacement, which adds to the overall cost of ownership and can impact long-term economic viability, potentially affecting the CAGR by xx percentage points.
- Supply Chain Disruptions and Raw Material Volatility: The global supply chain for battery components and raw materials can be susceptible to geopolitical factors, trade disputes, and market volatility. Such disruptions can lead to project delays, increased manufacturing costs, and affect the consistent availability of products, posing a risk to timely project completion and overall market growth.
Emerging Opportunities in Home Energy Storage Industry
- Integration with electric vehicles (EVs): Vehicle-to-grid (V2G) technology enables EVs to act as mobile energy storage units, providing additional flexibility and grid services.
- Microgrids and community energy storage: Decentralized energy systems with shared storage capabilities offer greater resilience and cost savings.
- Advanced battery technologies: Solid-state batteries and other next-generation technologies are expected to improve performance and reduce costs significantly.
Growth Accelerators in the Home Energy Storage Industry Industry
Technological breakthroughs in battery technology, coupled with strategic partnerships between energy storage providers and renewable energy companies, are expected to fuel long-term growth. The expansion into new geographic markets and the development of innovative business models will further accelerate market penetration. Government policies supportive of renewable energy and energy storage will play a crucial role in shaping the future of the industry.
Key Players Shaping the Home Energy Storage Industry Market
- Hitachi energy Ltd
- Saft Groupe SA
- Samsung SDI Co Ltd
- LG Energy Solution Ltd
- Deutsche Energieversorgung GmbH (SENEC)
- Sunverge Energy LLC
- Tesla Inc
- Sonnen GmbH
- Panasonic Corporation
Notable Milestones in Home Energy Storage Industry Sector
- May 2022: Mango Power launched the Mango Power M Series, a versatile home energy storage system with solar PV integration.
- June 2022: Toyota entered the residential battery market with the O-Uchi Kyuden System, leveraging its EV battery technology.
In-Depth Home Energy Storage Industry Market Outlook
The home energy storage market is poised for continued strong growth, driven by technological advancements, supportive policies, and increasing consumer demand. Strategic opportunities exist in the development of innovative products, expansion into new markets, and the formation of strategic partnerships to accelerate market penetration and enhance value creation. The focus on enhancing battery performance, reducing costs, and integrating energy storage into smart grids will shape the future of this dynamic sector.
Home Energy Storage Industry Segmentation
-
1. Technology Type
- 1.1. Lithium-ion Batteries
- 1.2. Lead-acid Batteries
- 1.3. Other Technology Types
Home Energy Storage Industry Segmentation By Geography
- 1. North America
- 2. Asia Pacific
- 3. Europe
- 4. Middle East and Africa
- 5. South America
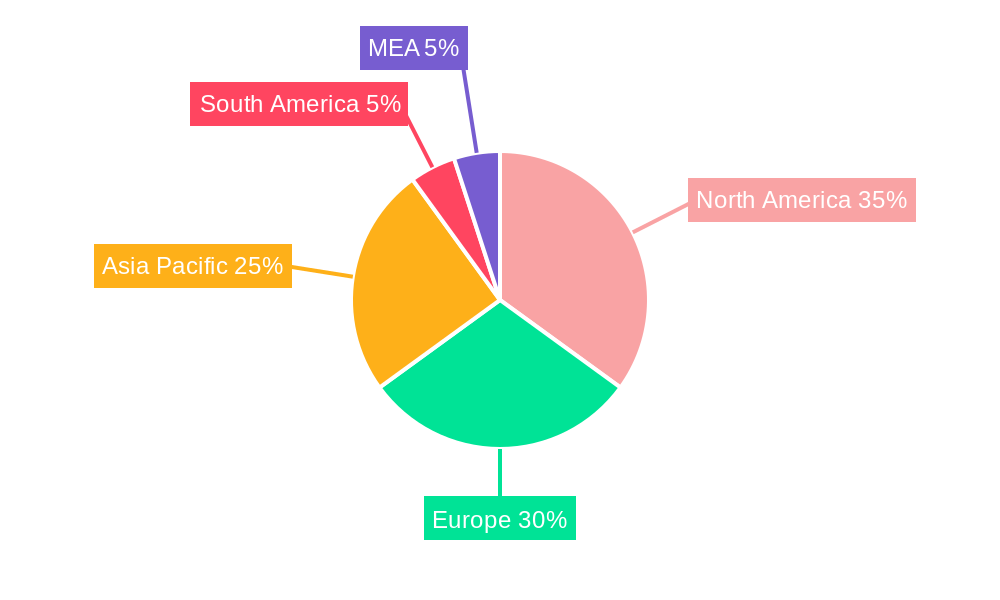
Home Energy Storage Industry Regional Market Share
Geographic Coverage of Home Energy Storage Industry
Home Energy Storage Industry REPORT HIGHLIGHTS
| Aspects | Details |
|---|---|
| Study Period | 2020-2034 |
| Base Year | 2025 |
| Estimated Year | 2026 |
| Forecast Period | 2026-2034 |
| Historical Period | 2020-2025 |
| Growth Rate | CAGR of 18.3% from 2020-2034 |
| Segmentation |
|
Table of Contents
- 1. Introduction
- 1.1. Research Scope
- 1.2. Market Segmentation
- 1.3. Research Objective
- 1.4. Definitions and Assumptions
- 2. Executive Summary
- 2.1. Market Snapshot
- 3. Market Dynamics
- 3.1. Market Drivers
- 3.2. Market Restrains
- 3.3. Market Trends
- 3.4. Market Opportunities
- 4. Market Factor Analysis
- 4.1. Porters Five Forces
- 4.1.1. Bargaining Power of Suppliers
- 4.1.2. Bargaining Power of Buyers
- 4.1.3. Threat of New Entrants
- 4.1.4. Threat of Substitutes
- 4.1.5. Competitive Rivalry
- 4.2. PESTEL analysis
- 4.3. BCG Analysis
- 4.3.1. Stars (High Growth, High Market Share)
- 4.3.2. Cash Cows (Low Growth, High Market Share)
- 4.3.3. Question Mark (High Growth, Low Market Share)
- 4.3.4. Dogs (Low Growth, Low Market Share)
- 4.4. Ansoff Matrix Analysis
- 4.5. Supply Chain Analysis
- 4.6. Regulatory Landscape
- 4.7. Current Market Potential and Opportunity Assessment (TAM–SAM–SOM Framework)
- 4.8. VDR Analyst Note
- 4.1. Porters Five Forces
- 5. Market Analysis, Insights and Forecast 2021-2033
- 5.1. Market Analysis, Insights and Forecast - by Technology Type
- 5.1.1. Lithium-ion Batteries
- 5.1.2. Lead-acid Batteries
- 5.1.3. Other Technology Types
- 5.2. Market Analysis, Insights and Forecast - by Region
- 5.2.1. North America
- 5.2.2. Asia Pacific
- 5.2.3. Europe
- 5.2.4. Middle East and Africa
- 5.2.5. South America
- 5.1. Market Analysis, Insights and Forecast - by Technology Type
- 6. Global Home Energy Storage Industry Analysis, Insights and Forecast, 2021-2033
- 6.1. Market Analysis, Insights and Forecast - by Technology Type
- 6.1.1. Lithium-ion Batteries
- 6.1.2. Lead-acid Batteries
- 6.1.3. Other Technology Types
- 6.1. Market Analysis, Insights and Forecast - by Technology Type
- 7. North America Home Energy Storage Industry Analysis, Insights and Forecast, 2021-2033
- 7.1. Market Analysis, Insights and Forecast - by Technology Type
- 7.1.1. Lithium-ion Batteries
- 7.1.2. Lead-acid Batteries
- 7.1.3. Other Technology Types
- 7.1. Market Analysis, Insights and Forecast - by Technology Type
- 8. Asia Pacific Home Energy Storage Industry Analysis, Insights and Forecast, 2021-2033
- 8.1. Market Analysis, Insights and Forecast - by Technology Type
- 8.1.1. Lithium-ion Batteries
- 8.1.2. Lead-acid Batteries
- 8.1.3. Other Technology Types
- 8.1. Market Analysis, Insights and Forecast - by Technology Type
- 9. Europe Home Energy Storage Industry Analysis, Insights and Forecast, 2021-2033
- 9.1. Market Analysis, Insights and Forecast - by Technology Type
- 9.1.1. Lithium-ion Batteries
- 9.1.2. Lead-acid Batteries
- 9.1.3. Other Technology Types
- 9.1. Market Analysis, Insights and Forecast - by Technology Type
- 10. Middle East and Africa Home Energy Storage Industry Analysis, Insights and Forecast, 2021-2033
- 10.1. Market Analysis, Insights and Forecast - by Technology Type
- 10.1.1. Lithium-ion Batteries
- 10.1.2. Lead-acid Batteries
- 10.1.3. Other Technology Types
- 10.1. Market Analysis, Insights and Forecast - by Technology Type
- 11. South America Home Energy Storage Industry Analysis, Insights and Forecast, 2021-2033
- 11.1. Market Analysis, Insights and Forecast - by Technology Type
- 11.1.1. Lithium-ion Batteries
- 11.1.2. Lead-acid Batteries
- 11.1.3. Other Technology Types
- 11.1. Market Analysis, Insights and Forecast - by Technology Type
- 12. Competitive Analysis
- 12.1. Company Profiles
- 12.1.1 Hitachi energy Ltd
- 12.1.1.1. Company Overview
- 12.1.1.2. Products
- 12.1.1.3. Company Financials
- 12.1.1.4. SWOT Analysis
- 12.1.2 Saft Groupe SA
- 12.1.2.1. Company Overview
- 12.1.2.2. Products
- 12.1.2.3. Company Financials
- 12.1.2.4. SWOT Analysis
- 12.1.3 Samsung SDI Co Ltd
- 12.1.3.1. Company Overview
- 12.1.3.2. Products
- 12.1.3.3. Company Financials
- 12.1.3.4. SWOT Analysis
- 12.1.4 LG Energy Solution Ltd
- 12.1.4.1. Company Overview
- 12.1.4.2. Products
- 12.1.4.3. Company Financials
- 12.1.4.4. SWOT Analysis
- 12.1.5 Deutsche Energieversorgung GmbH (SENEC)
- 12.1.5.1. Company Overview
- 12.1.5.2. Products
- 12.1.5.3. Company Financials
- 12.1.5.4. SWOT Analysis
- 12.1.6 Sunverge Energy LLC
- 12.1.6.1. Company Overview
- 12.1.6.2. Products
- 12.1.6.3. Company Financials
- 12.1.6.4. SWOT Analysis
- 12.1.7 Tesla Inc
- 12.1.7.1. Company Overview
- 12.1.7.2. Products
- 12.1.7.3. Company Financials
- 12.1.7.4. SWOT Analysis
- 12.1.8 Sonnen GmbH
- 12.1.8.1. Company Overview
- 12.1.8.2. Products
- 12.1.8.3. Company Financials
- 12.1.8.4. SWOT Analysis
- 12.1.9 Panasonic Corporation
- 12.1.9.1. Company Overview
- 12.1.9.2. Products
- 12.1.9.3. Company Financials
- 12.1.9.4. SWOT Analysis
- 12.1.1 Hitachi energy Ltd
- 12.2. Market Entropy
- 12.2.1 Company's Key Areas Served
- 12.2.2 Recent Developments
- 12.3. Company Market Share Analysis 2025
- 12.3.1 Top 5 Companies Market Share Analysis
- 12.3.2 Top 3 Companies Market Share Analysis
- 12.4. List of Potential Customers
- 13. Research Methodology
List of Figures
- Figure 1: Global Home Energy Storage Industry Revenue Breakdown (billion, %) by Region 2025 & 2033
- Figure 2: Global Home Energy Storage Industry Volume Breakdown (K Unit, %) by Region 2025 & 2033
- Figure 3: North America Home Energy Storage Industry Revenue (billion), by Technology Type 2025 & 2033
- Figure 4: North America Home Energy Storage Industry Volume (K Unit), by Technology Type 2025 & 2033
- Figure 5: North America Home Energy Storage Industry Revenue Share (%), by Technology Type 2025 & 2033
- Figure 6: North America Home Energy Storage Industry Volume Share (%), by Technology Type 2025 & 2033
- Figure 7: North America Home Energy Storage Industry Revenue (billion), by Country 2025 & 2033
- Figure 8: North America Home Energy Storage Industry Volume (K Unit), by Country 2025 & 2033
- Figure 9: North America Home Energy Storage Industry Revenue Share (%), by Country 2025 & 2033
- Figure 10: North America Home Energy Storage Industry Volume Share (%), by Country 2025 & 2033
- Figure 11: Asia Pacific Home Energy Storage Industry Revenue (billion), by Technology Type 2025 & 2033
- Figure 12: Asia Pacific Home Energy Storage Industry Volume (K Unit), by Technology Type 2025 & 2033
- Figure 13: Asia Pacific Home Energy Storage Industry Revenue Share (%), by Technology Type 2025 & 2033
- Figure 14: Asia Pacific Home Energy Storage Industry Volume Share (%), by Technology Type 2025 & 2033
- Figure 15: Asia Pacific Home Energy Storage Industry Revenue (billion), by Country 2025 & 2033
- Figure 16: Asia Pacific Home Energy Storage Industry Volume (K Unit), by Country 2025 & 2033
- Figure 17: Asia Pacific Home Energy Storage Industry Revenue Share (%), by Country 2025 & 2033
- Figure 18: Asia Pacific Home Energy Storage Industry Volume Share (%), by Country 2025 & 2033
- Figure 19: Europe Home Energy Storage Industry Revenue (billion), by Technology Type 2025 & 2033
- Figure 20: Europe Home Energy Storage Industry Volume (K Unit), by Technology Type 2025 & 2033
- Figure 21: Europe Home Energy Storage Industry Revenue Share (%), by Technology Type 2025 & 2033
- Figure 22: Europe Home Energy Storage Industry Volume Share (%), by Technology Type 2025 & 2033
- Figure 23: Europe Home Energy Storage Industry Revenue (billion), by Country 2025 & 2033
- Figure 24: Europe Home Energy Storage Industry Volume (K Unit), by Country 2025 & 2033
- Figure 25: Europe Home Energy Storage Industry Revenue Share (%), by Country 2025 & 2033
- Figure 26: Europe Home Energy Storage Industry Volume Share (%), by Country 2025 & 2033
- Figure 27: Middle East and Africa Home Energy Storage Industry Revenue (billion), by Technology Type 2025 & 2033
- Figure 28: Middle East and Africa Home Energy Storage Industry Volume (K Unit), by Technology Type 2025 & 2033
- Figure 29: Middle East and Africa Home Energy Storage Industry Revenue Share (%), by Technology Type 2025 & 2033
- Figure 30: Middle East and Africa Home Energy Storage Industry Volume Share (%), by Technology Type 2025 & 2033
- Figure 31: Middle East and Africa Home Energy Storage Industry Revenue (billion), by Country 2025 & 2033
- Figure 32: Middle East and Africa Home Energy Storage Industry Volume (K Unit), by Country 2025 & 2033
- Figure 33: Middle East and Africa Home Energy Storage Industry Revenue Share (%), by Country 2025 & 2033
- Figure 34: Middle East and Africa Home Energy Storage Industry Volume Share (%), by Country 2025 & 2033
- Figure 35: South America Home Energy Storage Industry Revenue (billion), by Technology Type 2025 & 2033
- Figure 36: South America Home Energy Storage Industry Volume (K Unit), by Technology Type 2025 & 2033
- Figure 37: South America Home Energy Storage Industry Revenue Share (%), by Technology Type 2025 & 2033
- Figure 38: South America Home Energy Storage Industry Volume Share (%), by Technology Type 2025 & 2033
- Figure 39: South America Home Energy Storage Industry Revenue (billion), by Country 2025 & 2033
- Figure 40: South America Home Energy Storage Industry Volume (K Unit), by Country 2025 & 2033
- Figure 41: South America Home Energy Storage Industry Revenue Share (%), by Country 2025 & 2033
- Figure 42: South America Home Energy Storage Industry Volume Share (%), by Country 2025 & 2033
List of Tables
- Table 1: Global Home Energy Storage Industry Revenue billion Forecast, by Technology Type 2020 & 2033
- Table 2: Global Home Energy Storage Industry Volume K Unit Forecast, by Technology Type 2020 & 2033
- Table 3: Global Home Energy Storage Industry Revenue billion Forecast, by Region 2020 & 2033
- Table 4: Global Home Energy Storage Industry Volume K Unit Forecast, by Region 2020 & 2033
- Table 5: Global Home Energy Storage Industry Revenue billion Forecast, by Technology Type 2020 & 2033
- Table 6: Global Home Energy Storage Industry Volume K Unit Forecast, by Technology Type 2020 & 2033
- Table 7: Global Home Energy Storage Industry Revenue billion Forecast, by Country 2020 & 2033
- Table 8: Global Home Energy Storage Industry Volume K Unit Forecast, by Country 2020 & 2033
- Table 9: Global Home Energy Storage Industry Revenue billion Forecast, by Technology Type 2020 & 2033
- Table 10: Global Home Energy Storage Industry Volume K Unit Forecast, by Technology Type 2020 & 2033
- Table 11: Global Home Energy Storage Industry Revenue billion Forecast, by Country 2020 & 2033
- Table 12: Global Home Energy Storage Industry Volume K Unit Forecast, by Country 2020 & 2033
- Table 13: Global Home Energy Storage Industry Revenue billion Forecast, by Technology Type 2020 & 2033
- Table 14: Global Home Energy Storage Industry Volume K Unit Forecast, by Technology Type 2020 & 2033
- Table 15: Global Home Energy Storage Industry Revenue billion Forecast, by Country 2020 & 2033
- Table 16: Global Home Energy Storage Industry Volume K Unit Forecast, by Country 2020 & 2033
- Table 17: Global Home Energy Storage Industry Revenue billion Forecast, by Technology Type 2020 & 2033
- Table 18: Global Home Energy Storage Industry Volume K Unit Forecast, by Technology Type 2020 & 2033
- Table 19: Global Home Energy Storage Industry Revenue billion Forecast, by Country 2020 & 2033
- Table 20: Global Home Energy Storage Industry Volume K Unit Forecast, by Country 2020 & 2033
- Table 21: Global Home Energy Storage Industry Revenue billion Forecast, by Technology Type 2020 & 2033
- Table 22: Global Home Energy Storage Industry Volume K Unit Forecast, by Technology Type 2020 & 2033
- Table 23: Global Home Energy Storage Industry Revenue billion Forecast, by Country 2020 & 2033
- Table 24: Global Home Energy Storage Industry Volume K Unit Forecast, by Country 2020 & 2033
Frequently Asked Questions
1. What is the projected Compound Annual Growth Rate (CAGR) of the Home Energy Storage Industry?
The projected CAGR is approximately 18.3%.
2. Which companies are prominent players in the Home Energy Storage Industry?
Key companies in the market include Hitachi energy Ltd, Saft Groupe SA, Samsung SDI Co Ltd, LG Energy Solution Ltd, Deutsche Energieversorgung GmbH (SENEC), Sunverge Energy LLC, Tesla Inc, Sonnen GmbH, Panasonic Corporation.
3. What are the main segments of the Home Energy Storage Industry?
The market segments include Technology Type.
4. Can you provide details about the market size?
The market size is estimated to be USD 61.5 billion as of 2022.
5. What are some drivers contributing to market growth?
4.; Increasing Investments in Offshore Oil and Gas Projects.
6. What are the notable trends driving market growth?
Lithium-Ion Battery Technology to Dominate the Market.
7. Are there any restraints impacting market growth?
4.; Increasing Penetration of Renewable Energy.
8. Can you provide examples of recent developments in the market?
In May 2022, Mango Power launched Mango Power M Series at the Intersolar Munich 2022. The system can be used with a solar PV, with a 10-20 kWh battery for daily and emergency use. The system supports single and triple-phase connections with 8-14 kW output capability. The system can be used in various applications, including a built-in inverter, backup gateway, and EV charger. The company launched different versions for the United States and Europe markets.
9. What pricing options are available for accessing the report?
Pricing options include single-user, multi-user, and enterprise licenses priced at USD 4750, USD 5250, and USD 8750 respectively.
10. Is the market size provided in terms of value or volume?
The market size is provided in terms of value, measured in billion and volume, measured in K Unit.
11. Are there any specific market keywords associated with the report?
Yes, the market keyword associated with the report is "Home Energy Storage Industry," which aids in identifying and referencing the specific market segment covered.
12. How do I determine which pricing option suits my needs best?
The pricing options vary based on user requirements and access needs. Individual users may opt for single-user licenses, while businesses requiring broader access may choose multi-user or enterprise licenses for cost-effective access to the report.
13. Are there any additional resources or data provided in the Home Energy Storage Industry report?
While the report offers comprehensive insights, it's advisable to review the specific contents or supplementary materials provided to ascertain if additional resources or data are available.
14. How can I stay updated on further developments or reports in the Home Energy Storage Industry?
To stay informed about further developments, trends, and reports in the Home Energy Storage Industry, consider subscribing to industry newsletters, following relevant companies and organizations, or regularly checking reputable industry news sources and publications.
Methodology
Step 1 - Identification of Relevant Samples Size from Population Database


Step 2 - Approaches for Defining Global Market Size (Value, Volume* & Price*)

Note*: In applicable scenarios
Step 3 - Data Sources
Primary Research
- Web Analytics
- Survey Reports
- Research Institute
- Latest Research Reports
- Opinion Leaders
Secondary Research
- Annual Reports
- White Paper
- Latest Press Release
- Industry Association
- Paid Database
- Investor Presentations

Step 4 - Data Triangulation
Involves using different sources of information in order to increase the validity of a study
These sources are likely to be stakeholders in a program - participants, other researchers, program staff, other community members, and so on.
Then we put all data in single framework & apply various statistical tools to find out the dynamic on the market.
During the analysis stage, feedback from the stakeholder groups would be compared to determine areas of agreement as well as areas of divergence