

Key Insights
The global Heat Recovery System Generator (HRSG) market is poised for significant expansion, projected to reach $13.39 billion by 2025, with a robust Compound Annual Growth Rate (CAGR) of 9.22% between 2025 and 2033. This growth trajectory is propelled by stringent industrial energy efficiency mandates, the escalating demand for sustainable energy solutions, and rising fossil fuel expenditures across diverse sectors. Key market dynamics include the increasing adoption of advanced generator technologies such as Organic Rankine Cycle (ORC) systems, renowned for their superior efficiency and reduced emissions compared to conventional steam turbines. Moreover, the synergy of heat recovery systems with renewable energy sources, including solar thermal and geothermal, is a burgeoning trend, further catalyzing market growth. While substantial initial capital investment and intricate installation procedures present challenges, ongoing technological innovations and supportive governmental initiatives are effectively addressing these hurdles. The market is comprehensively segmented by generator type (ORC, steam turbine, combined cycle), end-use industry (power generation, manufacturing, chemical, petrochemical), and application (heat exchangers, thermal storage, humidity recovery). Asia Pacific is expected to witness exceptional growth, driven by rapid industrialization and expanding manufacturing capabilities in key economies such as China and India. North America and Europe also represent substantial markets, influenced by rigorous environmental regulations and a strong emphasis on energy optimization.
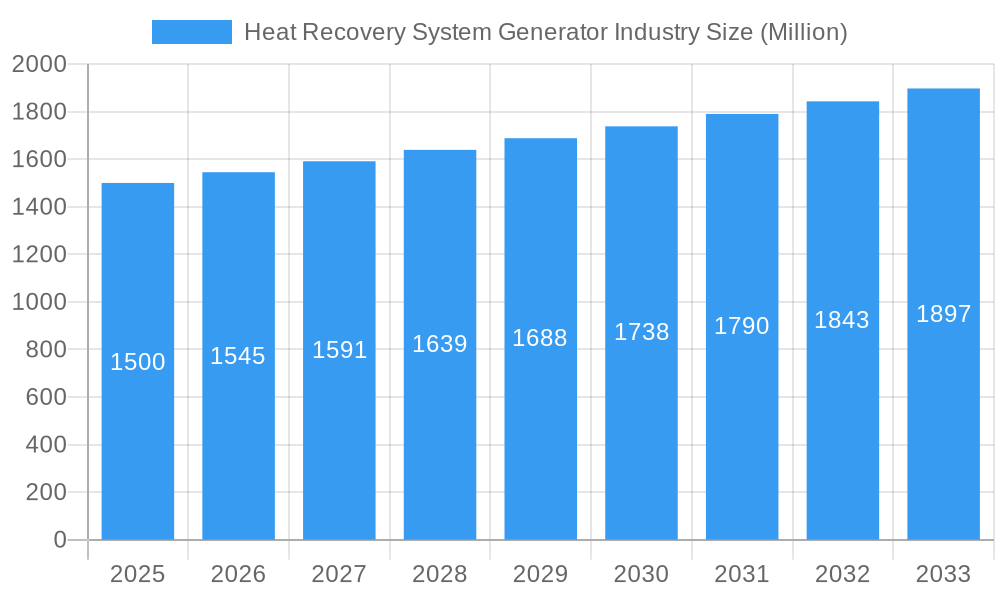
Heat Recovery System Generator Industry Market Size (In Billion)
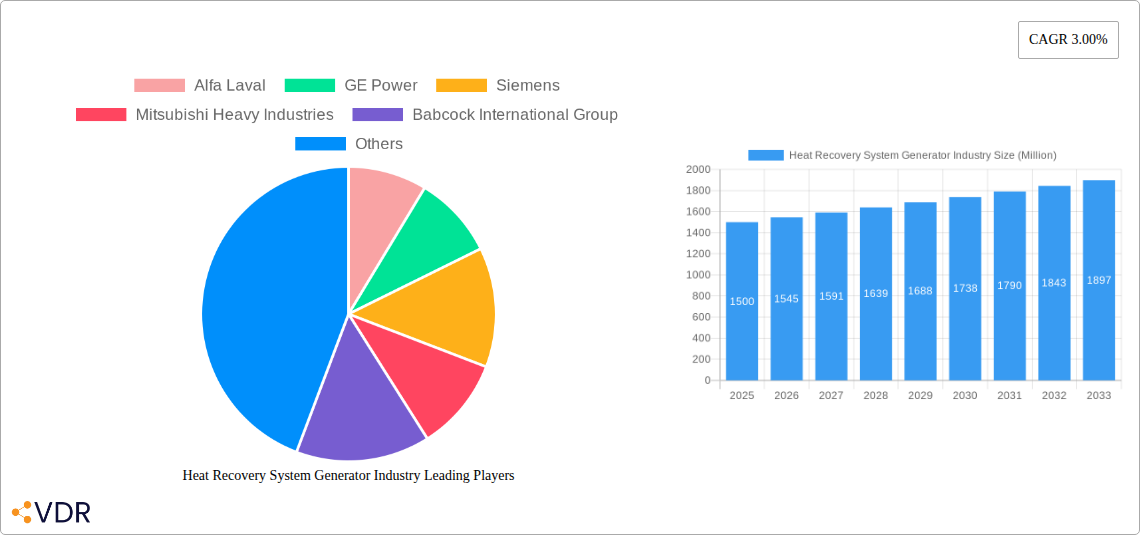
The competitive arena features established industry leaders including Alfa Laval, GE Power, Siemens, Mitsubishi Heavy Industries, and Babcock International Group, alongside specialized entities like Kelvion Holding GmbH, ATEC, Thermotech, and Calnetix. These market participants are committed to continuous innovation, delivering increasingly efficient, reliable, and cost-effective heat recovery solutions, thereby fostering intense competition and stimulating further technological advancements. Future market expansion will be contingent upon groundbreaking technological developments, supportive government policies championing energy efficiency, and the sustained integration of sustainable practices across industries. A notable shift is anticipated towards the development of more compact, modular systems optimized for specific applications and industries, facilitating broader market penetration.
Heat Recovery System Generator Industry Company Market Share
Heat Recovery System Generator Industry Market Report: 2019-2033
This comprehensive report provides a detailed analysis of the Heat Recovery System Generator (HRSG) industry, encompassing market dynamics, growth trends, regional analysis, competitive landscape, and future outlook. The study covers the period from 2019 to 2033, with 2025 as the base year and a forecast period extending to 2033. The report segments the market by generator type (Organic Rankine Cycle (ORC), Steam Turbine, Combined Cycle), end-use industry (Power Generation, Manufacturing, Chemical, Petrochemical), and application (Heat Exchangers, Thermal Storage, Humidity Recovery). The market size is presented in million units.
Heat Recovery System Generator Industry Market Dynamics & Structure
The HRSG market is characterized by moderate concentration, with key players such as Alfa Laval, GE Power, Siemens, Mitsubishi Heavy Industries, and Babcock International Group holding significant market share. The market size in 2025 is estimated at xx million units. Technological innovation, particularly in ORC technology and improved heat exchanger designs, is a key driver. Stringent environmental regulations promoting energy efficiency are also pushing market growth. Competitive pressures stem from both established players and emerging companies offering innovative solutions. The industry witnesses a moderate level of M&A activity, with xx deals recorded between 2019 and 2024.
- Market Concentration: Moderately concentrated, with top 5 players holding approximately xx% market share in 2025.
- Technological Innovation: Focus on improving efficiency, reducing emissions, and expanding applications of ORC and other technologies.
- Regulatory Framework: Stringent environmental regulations driving demand for energy-efficient HRSGs.
- Competitive Substitutes: Limited direct substitutes, but competition exists from other energy-efficient technologies.
- End-User Demographics: Primarily driven by large industrial and power generation sectors.
- M&A Trends: Moderate activity, with an average of xx deals per year (2019-2024).
Heat Recovery System Generator Industry Growth Trends & Insights
The HRSG market exhibited a CAGR of xx% during the historical period (2019-2024) and is projected to grow at a CAGR of xx% during the forecast period (2025-2033). This growth is driven by increasing industrialization, rising energy costs, and growing awareness of environmental sustainability. The adoption rate of HRSGs is particularly high in regions with robust industrial sectors and supportive government policies. Technological advancements, such as the development of more efficient ORC systems and advanced control systems, are further fueling market expansion. Shifting consumer preferences toward sustainable energy solutions are also contributing to the market's growth. Market penetration is expected to reach xx% by 2033.
Dominant Regions, Countries, or Segments in Heat Recovery System Generator Industry
The power generation sector is the dominant end-use industry, accounting for approximately xx% of the market in 2025. Within generator types, steam turbines currently hold the largest market share, followed by combined cycle and ORC systems. Geographically, North America and Europe are leading markets, driven by stringent environmental regulations and substantial industrial activity. Asia-Pacific is projected to witness the fastest growth rate, fueled by rapid industrialization and increasing energy demand.
- Key Drivers (North America & Europe): Stringent emission regulations, robust industrial base, high energy costs.
- Key Drivers (Asia-Pacific): Rapid industrialization, rising energy demand, government incentives for renewable energy.
- Market Share: Power Generation (xx%), Manufacturing (xx%), Chemical (xx%), Petrochemical (xx%). Steam Turbine (xx%), ORC (xx%), Combined Cycle (xx%).
Heat Recovery System Generator Industry Product Landscape
The HRSG market offers a range of products, including various heat exchanger designs (plate, shell and tube, etc.), thermal storage solutions, and humidity recovery systems. Continuous improvements in efficiency, reliability, and compactness are driving innovation. Unique selling propositions include advanced control systems for optimized performance, modular designs for flexible installation, and customized solutions tailored to specific end-user needs. Technological advancements focus on enhancing energy recovery rates, minimizing emissions, and improving system integration.
Key Drivers, Barriers & Challenges in Heat Recovery System Generator Industry
Key Drivers: Growing demand for energy efficiency, stringent environmental regulations, and technological advancements in ORC and other HRSG technologies. Government incentives and subsidies for renewable energy integration are also significant drivers.
Key Challenges: High initial investment costs, complex installation procedures, potential supply chain disruptions, and competition from other energy-efficient technologies can hinder market growth. Furthermore, regulatory uncertainties and evolving environmental standards might pose challenges. The impact of these challenges is estimated to reduce market growth by approximately xx% by 2033.
Emerging Opportunities in Heat Recovery System Generator Industry
Emerging opportunities lie in untapped markets in developing economies, particularly in the industrial and power generation sectors. The integration of HRSGs with renewable energy sources, such as solar and wind power, presents significant potential. Innovations in smart grid integration and digitalization of HRSG systems will also drive future growth.
Growth Accelerators in the Heat Recovery System Generator Industry Industry
Technological breakthroughs in ORC technology, leading to higher efficiency and lower costs, will be a significant growth accelerator. Strategic partnerships between HRSG manufacturers and energy companies can enable large-scale deployment. Expansion into new geographical markets with robust industrial sectors, such as Southeast Asia and Africa, offers considerable growth potential.
Key Players Shaping the Heat Recovery System Generator Industry Market
- Alfa Laval
- GE Power
- Siemens
- Mitsubishi Heavy Industries
- Babcock International Group
- Kelvion Holding GmbH
- ATEC
- Thermotech
- Calnetix
Notable Milestones in Heat Recovery System Generator Industry Sector
- 2020: Alfa Laval launches a new line of high-efficiency heat exchangers.
- 2021: Siemens announces a strategic partnership with a renewable energy company to integrate HRSGs with wind farms.
- 2022: Mitsubishi Heavy Industries unveils a new ORC system with improved performance.
- 2023: Significant investments made in R&D of HRSG technologies by leading companies.
- 2024: New environmental regulations implemented across major regions impacting HRSG demand.
In-Depth Heat Recovery System Generator Industry Market Outlook
The HRSG market is poised for significant growth in the coming years. Continuous technological advancements, increasing environmental concerns, and supportive government policies will fuel market expansion. Strategic partnerships, market consolidation, and expansion into new applications will further accelerate market growth. The market is expected to maintain its robust growth trajectory, driven by increased demand from the industrial and power generation sectors globally.
Heat Recovery System Generator Industry Segmentation
-
1. Generator Type
- 1.1. Organic Rankine Cycle (ORC)
- 1.2. Steam Turbine
- 1.3. Combined Cycle
-
2. End-Use Industry
- 2.1. Power Generation
- 2.2. Manufacturing
- 2.3. Chemical
- 2.4. Petrochemical
-
3. Application
- 3.1. Heat Exchangers
- 3.2. Thermal Storage
- 3.3. Humidity Recovery
Heat Recovery System Generator Industry Segmentation By Geography
- 1. North America
- 2. Europe
- 3. Asia Pacific
- 4. South America
- 5. Middle East and Africa
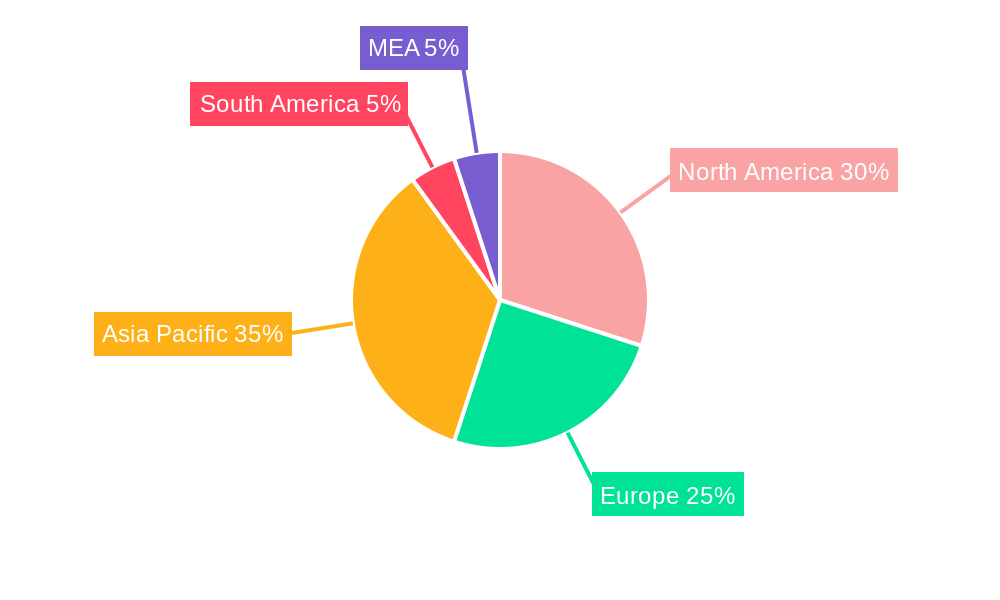
Heat Recovery System Generator Industry Regional Market Share
Geographic Coverage of Heat Recovery System Generator Industry
Heat Recovery System Generator Industry REPORT HIGHLIGHTS
| Aspects | Details |
|---|---|
| Study Period | 2020-2034 |
| Base Year | 2025 |
| Estimated Year | 2026 |
| Forecast Period | 2026-2034 |
| Historical Period | 2020-2025 |
| Growth Rate | CAGR of 9.22% from 2020-2034 |
| Segmentation |
|
Table of Contents
- 1. Introduction
- 1.1. Research Scope
- 1.2. Market Segmentation
- 1.3. Research Objective
- 1.4. Definitions and Assumptions
- 2. Executive Summary
- 2.1. Market Snapshot
- 3. Market Dynamics
- 3.1. Market Drivers
- 3.2. Market Restrains
- 3.3. Market Trends
- 3.4. Market Opportunities
- 4. Market Factor Analysis
- 4.1. Porters Five Forces
- 4.1.1. Bargaining Power of Suppliers
- 4.1.2. Bargaining Power of Buyers
- 4.1.3. Threat of New Entrants
- 4.1.4. Threat of Substitutes
- 4.1.5. Competitive Rivalry
- 4.2. PESTEL analysis
- 4.3. BCG Analysis
- 4.3.1. Stars (High Growth, High Market Share)
- 4.3.2. Cash Cows (Low Growth, High Market Share)
- 4.3.3. Question Mark (High Growth, Low Market Share)
- 4.3.4. Dogs (Low Growth, Low Market Share)
- 4.4. Ansoff Matrix Analysis
- 4.5. Supply Chain Analysis
- 4.6. Regulatory Landscape
- 4.7. Current Market Potential and Opportunity Assessment (TAM–SAM–SOM Framework)
- 4.8. VDR Analyst Note
- 4.1. Porters Five Forces
- 5. Market Analysis, Insights and Forecast 2021-2033
- 5.1. Market Analysis, Insights and Forecast - by Generator Type
- 5.1.1. Organic Rankine Cycle (ORC)
- 5.1.2. Steam Turbine
- 5.1.3. Combined Cycle
- 5.2. Market Analysis, Insights and Forecast - by End-Use Industry
- 5.2.1. Power Generation
- 5.2.2. Manufacturing
- 5.2.3. Chemical
- 5.2.4. Petrochemical
- 5.3. Market Analysis, Insights and Forecast - by Application
- 5.3.1. Heat Exchangers
- 5.3.2. Thermal Storage
- 5.3.3. Humidity Recovery
- 5.4. Market Analysis, Insights and Forecast - by Region
- 5.4.1. North America
- 5.4.2. Europe
- 5.4.3. Asia Pacific
- 5.4.4. South America
- 5.4.5. Middle East and Africa
- 5.1. Market Analysis, Insights and Forecast - by Generator Type
- 6. Global Heat Recovery System Generator Industry Analysis, Insights and Forecast, 2021-2033
- 6.1. Market Analysis, Insights and Forecast - by Generator Type
- 6.1.1. Organic Rankine Cycle (ORC)
- 6.1.2. Steam Turbine
- 6.1.3. Combined Cycle
- 6.2. Market Analysis, Insights and Forecast - by End-Use Industry
- 6.2.1. Power Generation
- 6.2.2. Manufacturing
- 6.2.3. Chemical
- 6.2.4. Petrochemical
- 6.3. Market Analysis, Insights and Forecast - by Application
- 6.3.1. Heat Exchangers
- 6.3.2. Thermal Storage
- 6.3.3. Humidity Recovery
- 6.1. Market Analysis, Insights and Forecast - by Generator Type
- 7. North America Heat Recovery System Generator Industry Analysis, Insights and Forecast, 2021-2033
- 7.1. Market Analysis, Insights and Forecast - by Generator Type
- 7.1.1. Organic Rankine Cycle (ORC)
- 7.1.2. Steam Turbine
- 7.1.3. Combined Cycle
- 7.2. Market Analysis, Insights and Forecast - by End-Use Industry
- 7.2.1. Power Generation
- 7.2.2. Manufacturing
- 7.2.3. Chemical
- 7.2.4. Petrochemical
- 7.3. Market Analysis, Insights and Forecast - by Application
- 7.3.1. Heat Exchangers
- 7.3.2. Thermal Storage
- 7.3.3. Humidity Recovery
- 7.1. Market Analysis, Insights and Forecast - by Generator Type
- 8. Europe Heat Recovery System Generator Industry Analysis, Insights and Forecast, 2021-2033
- 8.1. Market Analysis, Insights and Forecast - by Generator Type
- 8.1.1. Organic Rankine Cycle (ORC)
- 8.1.2. Steam Turbine
- 8.1.3. Combined Cycle
- 8.2. Market Analysis, Insights and Forecast - by End-Use Industry
- 8.2.1. Power Generation
- 8.2.2. Manufacturing
- 8.2.3. Chemical
- 8.2.4. Petrochemical
- 8.3. Market Analysis, Insights and Forecast - by Application
- 8.3.1. Heat Exchangers
- 8.3.2. Thermal Storage
- 8.3.3. Humidity Recovery
- 8.1. Market Analysis, Insights and Forecast - by Generator Type
- 9. Asia Pacific Heat Recovery System Generator Industry Analysis, Insights and Forecast, 2021-2033
- 9.1. Market Analysis, Insights and Forecast - by Generator Type
- 9.1.1. Organic Rankine Cycle (ORC)
- 9.1.2. Steam Turbine
- 9.1.3. Combined Cycle
- 9.2. Market Analysis, Insights and Forecast - by End-Use Industry
- 9.2.1. Power Generation
- 9.2.2. Manufacturing
- 9.2.3. Chemical
- 9.2.4. Petrochemical
- 9.3. Market Analysis, Insights and Forecast - by Application
- 9.3.1. Heat Exchangers
- 9.3.2. Thermal Storage
- 9.3.3. Humidity Recovery
- 9.1. Market Analysis, Insights and Forecast - by Generator Type
- 10. South America Heat Recovery System Generator Industry Analysis, Insights and Forecast, 2021-2033
- 10.1. Market Analysis, Insights and Forecast - by Generator Type
- 10.1.1. Organic Rankine Cycle (ORC)
- 10.1.2. Steam Turbine
- 10.1.3. Combined Cycle
- 10.2. Market Analysis, Insights and Forecast - by End-Use Industry
- 10.2.1. Power Generation
- 10.2.2. Manufacturing
- 10.2.3. Chemical
- 10.2.4. Petrochemical
- 10.3. Market Analysis, Insights and Forecast - by Application
- 10.3.1. Heat Exchangers
- 10.3.2. Thermal Storage
- 10.3.3. Humidity Recovery
- 10.1. Market Analysis, Insights and Forecast - by Generator Type
- 11. Middle East and Africa Heat Recovery System Generator Industry Analysis, Insights and Forecast, 2021-2033
- 11.1. Market Analysis, Insights and Forecast - by Generator Type
- 11.1.1. Organic Rankine Cycle (ORC)
- 11.1.2. Steam Turbine
- 11.1.3. Combined Cycle
- 11.2. Market Analysis, Insights and Forecast - by End-Use Industry
- 11.2.1. Power Generation
- 11.2.2. Manufacturing
- 11.2.3. Chemical
- 11.2.4. Petrochemical
- 11.3. Market Analysis, Insights and Forecast - by Application
- 11.3.1. Heat Exchangers
- 11.3.2. Thermal Storage
- 11.3.3. Humidity Recovery
- 11.1. Market Analysis, Insights and Forecast - by Generator Type
- 12. Competitive Analysis
- 12.1. Company Profiles
- 12.1.1 Alfa Laval
- 12.1.1.1. Company Overview
- 12.1.1.2. Products
- 12.1.1.3. Company Financials
- 12.1.1.4. SWOT Analysis
- 12.1.2 GE Power
- 12.1.2.1. Company Overview
- 12.1.2.2. Products
- 12.1.2.3. Company Financials
- 12.1.2.4. SWOT Analysis
- 12.1.3 Siemens
- 12.1.3.1. Company Overview
- 12.1.3.2. Products
- 12.1.3.3. Company Financials
- 12.1.3.4. SWOT Analysis
- 12.1.4 Mitsubishi Heavy Industries
- 12.1.4.1. Company Overview
- 12.1.4.2. Products
- 12.1.4.3. Company Financials
- 12.1.4.4. SWOT Analysis
- 12.1.5 Babcock International Group
- 12.1.5.1. Company Overview
- 12.1.5.2. Products
- 12.1.5.3. Company Financials
- 12.1.5.4. SWOT Analysis
- 12.1.6 Kelvion Holding GmbH
- 12.1.6.1. Company Overview
- 12.1.6.2. Products
- 12.1.6.3. Company Financials
- 12.1.6.4. SWOT Analysis
- 12.1.7 ATEC
- 12.1.7.1. Company Overview
- 12.1.7.2. Products
- 12.1.7.3. Company Financials
- 12.1.7.4. SWOT Analysis
- 12.1.8 Thermotech
- 12.1.8.1. Company Overview
- 12.1.8.2. Products
- 12.1.8.3. Company Financials
- 12.1.8.4. SWOT Analysis
- 12.1.9 Calnetix
- 12.1.9.1. Company Overview
- 12.1.9.2. Products
- 12.1.9.3. Company Financials
- 12.1.9.4. SWOT Analysis
- 12.1.1 Alfa Laval
- 12.2. Market Entropy
- 12.2.1 Company's Key Areas Served
- 12.2.2 Recent Developments
- 12.3. Company Market Share Analysis 2025
- 12.3.1 Top 5 Companies Market Share Analysis
- 12.3.2 Top 3 Companies Market Share Analysis
- 12.4. List of Potential Customers
- 13. Research Methodology
List of Figures
- Figure 1: Global Heat Recovery System Generator Industry Revenue Breakdown (billion, %) by Region 2025 & 2033
- Figure 2: North America Heat Recovery System Generator Industry Revenue (billion), by Generator Type 2025 & 2033
- Figure 3: North America Heat Recovery System Generator Industry Revenue Share (%), by Generator Type 2025 & 2033
- Figure 4: North America Heat Recovery System Generator Industry Revenue (billion), by End-Use Industry 2025 & 2033
- Figure 5: North America Heat Recovery System Generator Industry Revenue Share (%), by End-Use Industry 2025 & 2033
- Figure 6: North America Heat Recovery System Generator Industry Revenue (billion), by Application 2025 & 2033
- Figure 7: North America Heat Recovery System Generator Industry Revenue Share (%), by Application 2025 & 2033
- Figure 8: North America Heat Recovery System Generator Industry Revenue (billion), by Country 2025 & 2033
- Figure 9: North America Heat Recovery System Generator Industry Revenue Share (%), by Country 2025 & 2033
- Figure 10: Europe Heat Recovery System Generator Industry Revenue (billion), by Generator Type 2025 & 2033
- Figure 11: Europe Heat Recovery System Generator Industry Revenue Share (%), by Generator Type 2025 & 2033
- Figure 12: Europe Heat Recovery System Generator Industry Revenue (billion), by End-Use Industry 2025 & 2033
- Figure 13: Europe Heat Recovery System Generator Industry Revenue Share (%), by End-Use Industry 2025 & 2033
- Figure 14: Europe Heat Recovery System Generator Industry Revenue (billion), by Application 2025 & 2033
- Figure 15: Europe Heat Recovery System Generator Industry Revenue Share (%), by Application 2025 & 2033
- Figure 16: Europe Heat Recovery System Generator Industry Revenue (billion), by Country 2025 & 2033
- Figure 17: Europe Heat Recovery System Generator Industry Revenue Share (%), by Country 2025 & 2033
- Figure 18: Asia Pacific Heat Recovery System Generator Industry Revenue (billion), by Generator Type 2025 & 2033
- Figure 19: Asia Pacific Heat Recovery System Generator Industry Revenue Share (%), by Generator Type 2025 & 2033
- Figure 20: Asia Pacific Heat Recovery System Generator Industry Revenue (billion), by End-Use Industry 2025 & 2033
- Figure 21: Asia Pacific Heat Recovery System Generator Industry Revenue Share (%), by End-Use Industry 2025 & 2033
- Figure 22: Asia Pacific Heat Recovery System Generator Industry Revenue (billion), by Application 2025 & 2033
- Figure 23: Asia Pacific Heat Recovery System Generator Industry Revenue Share (%), by Application 2025 & 2033
- Figure 24: Asia Pacific Heat Recovery System Generator Industry Revenue (billion), by Country 2025 & 2033
- Figure 25: Asia Pacific Heat Recovery System Generator Industry Revenue Share (%), by Country 2025 & 2033
- Figure 26: South America Heat Recovery System Generator Industry Revenue (billion), by Generator Type 2025 & 2033
- Figure 27: South America Heat Recovery System Generator Industry Revenue Share (%), by Generator Type 2025 & 2033
- Figure 28: South America Heat Recovery System Generator Industry Revenue (billion), by End-Use Industry 2025 & 2033
- Figure 29: South America Heat Recovery System Generator Industry Revenue Share (%), by End-Use Industry 2025 & 2033
- Figure 30: South America Heat Recovery System Generator Industry Revenue (billion), by Application 2025 & 2033
- Figure 31: South America Heat Recovery System Generator Industry Revenue Share (%), by Application 2025 & 2033
- Figure 32: South America Heat Recovery System Generator Industry Revenue (billion), by Country 2025 & 2033
- Figure 33: South America Heat Recovery System Generator Industry Revenue Share (%), by Country 2025 & 2033
- Figure 34: Middle East and Africa Heat Recovery System Generator Industry Revenue (billion), by Generator Type 2025 & 2033
- Figure 35: Middle East and Africa Heat Recovery System Generator Industry Revenue Share (%), by Generator Type 2025 & 2033
- Figure 36: Middle East and Africa Heat Recovery System Generator Industry Revenue (billion), by End-Use Industry 2025 & 2033
- Figure 37: Middle East and Africa Heat Recovery System Generator Industry Revenue Share (%), by End-Use Industry 2025 & 2033
- Figure 38: Middle East and Africa Heat Recovery System Generator Industry Revenue (billion), by Application 2025 & 2033
- Figure 39: Middle East and Africa Heat Recovery System Generator Industry Revenue Share (%), by Application 2025 & 2033
- Figure 40: Middle East and Africa Heat Recovery System Generator Industry Revenue (billion), by Country 2025 & 2033
- Figure 41: Middle East and Africa Heat Recovery System Generator Industry Revenue Share (%), by Country 2025 & 2033
List of Tables
- Table 1: Global Heat Recovery System Generator Industry Revenue billion Forecast, by Generator Type 2020 & 2033
- Table 2: Global Heat Recovery System Generator Industry Revenue billion Forecast, by End-Use Industry 2020 & 2033
- Table 3: Global Heat Recovery System Generator Industry Revenue billion Forecast, by Application 2020 & 2033
- Table 4: Global Heat Recovery System Generator Industry Revenue billion Forecast, by Region 2020 & 2033
- Table 5: Global Heat Recovery System Generator Industry Revenue billion Forecast, by Generator Type 2020 & 2033
- Table 6: Global Heat Recovery System Generator Industry Revenue billion Forecast, by End-Use Industry 2020 & 2033
- Table 7: Global Heat Recovery System Generator Industry Revenue billion Forecast, by Application 2020 & 2033
- Table 8: Global Heat Recovery System Generator Industry Revenue billion Forecast, by Country 2020 & 2033
- Table 9: Global Heat Recovery System Generator Industry Revenue billion Forecast, by Generator Type 2020 & 2033
- Table 10: Global Heat Recovery System Generator Industry Revenue billion Forecast, by End-Use Industry 2020 & 2033
- Table 11: Global Heat Recovery System Generator Industry Revenue billion Forecast, by Application 2020 & 2033
- Table 12: Global Heat Recovery System Generator Industry Revenue billion Forecast, by Country 2020 & 2033
- Table 13: Global Heat Recovery System Generator Industry Revenue billion Forecast, by Generator Type 2020 & 2033
- Table 14: Global Heat Recovery System Generator Industry Revenue billion Forecast, by End-Use Industry 2020 & 2033
- Table 15: Global Heat Recovery System Generator Industry Revenue billion Forecast, by Application 2020 & 2033
- Table 16: Global Heat Recovery System Generator Industry Revenue billion Forecast, by Country 2020 & 2033
- Table 17: Global Heat Recovery System Generator Industry Revenue billion Forecast, by Generator Type 2020 & 2033
- Table 18: Global Heat Recovery System Generator Industry Revenue billion Forecast, by End-Use Industry 2020 & 2033
- Table 19: Global Heat Recovery System Generator Industry Revenue billion Forecast, by Application 2020 & 2033
- Table 20: Global Heat Recovery System Generator Industry Revenue billion Forecast, by Country 2020 & 2033
- Table 21: Global Heat Recovery System Generator Industry Revenue billion Forecast, by Generator Type 2020 & 2033
- Table 22: Global Heat Recovery System Generator Industry Revenue billion Forecast, by End-Use Industry 2020 & 2033
- Table 23: Global Heat Recovery System Generator Industry Revenue billion Forecast, by Application 2020 & 2033
- Table 24: Global Heat Recovery System Generator Industry Revenue billion Forecast, by Country 2020 & 2033
Frequently Asked Questions
1. What is the projected Compound Annual Growth Rate (CAGR) of the Heat Recovery System Generator Industry?
The projected CAGR is approximately 9.22%.
2. Which companies are prominent players in the Heat Recovery System Generator Industry?
Key companies in the market include Alfa Laval , GE Power , Siemens , Mitsubishi Heavy Industries , Babcock International Group , Kelvion Holding GmbH , ATEC , Thermotech , Calnetix.
3. What are the main segments of the Heat Recovery System Generator Industry?
The market segments include Generator Type, End-Use Industry, Application.
4. Can you provide details about the market size?
The market size is estimated to be USD 13.39 billion as of 2022.
5. What are some drivers contributing to market growth?
4.; The Growing Demand for Solar Energy-Based Power Generation4.; Declining Photovoltaic System Prices.
6. What are the notable trends driving market growth?
Power Generation to Dominate the Market.
7. Are there any restraints impacting market growth?
4.; The Country's Inefficient Electricity Grid Infrastructure.
8. Can you provide examples of recent developments in the market?
N/A
9. What pricing options are available for accessing the report?
Pricing options include single-user, multi-user, and enterprise licenses priced at USD 4750, USD 5250, and USD 8750 respectively.
10. Is the market size provided in terms of value or volume?
The market size is provided in terms of value, measured in billion.
11. Are there any specific market keywords associated with the report?
Yes, the market keyword associated with the report is "Heat Recovery System Generator Industry," which aids in identifying and referencing the specific market segment covered.
12. How do I determine which pricing option suits my needs best?
The pricing options vary based on user requirements and access needs. Individual users may opt for single-user licenses, while businesses requiring broader access may choose multi-user or enterprise licenses for cost-effective access to the report.
13. Are there any additional resources or data provided in the Heat Recovery System Generator Industry report?
While the report offers comprehensive insights, it's advisable to review the specific contents or supplementary materials provided to ascertain if additional resources or data are available.
14. How can I stay updated on further developments or reports in the Heat Recovery System Generator Industry?
To stay informed about further developments, trends, and reports in the Heat Recovery System Generator Industry, consider subscribing to industry newsletters, following relevant companies and organizations, or regularly checking reputable industry news sources and publications.
Methodology
Step 1 - Identification of Relevant Samples Size from Population Database


Step 2 - Approaches for Defining Global Market Size (Value, Volume* & Price*)

Note*: In applicable scenarios
Step 3 - Data Sources
Primary Research
- Web Analytics
- Survey Reports
- Research Institute
- Latest Research Reports
- Opinion Leaders
Secondary Research
- Annual Reports
- White Paper
- Latest Press Release
- Industry Association
- Paid Database
- Investor Presentations

Step 4 - Data Triangulation
Involves using different sources of information in order to increase the validity of a study
These sources are likely to be stakeholders in a program - participants, other researchers, program staff, other community members, and so on.
Then we put all data in single framework & apply various statistical tools to find out the dynamic on the market.
During the analysis stage, feedback from the stakeholder groups would be compared to determine areas of agreement as well as areas of divergence