

Key Insights
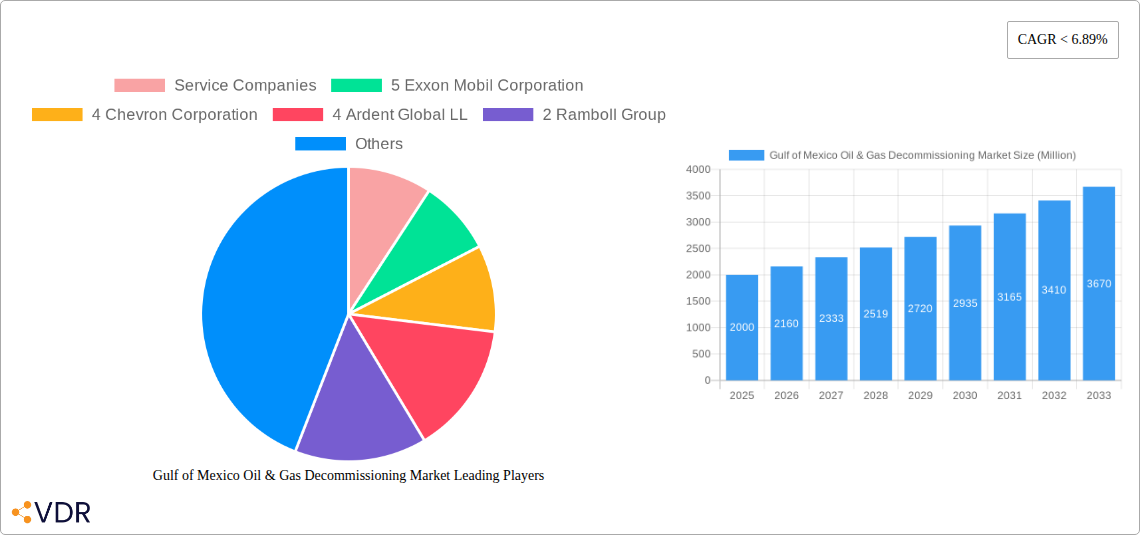
The Gulf of Mexico Oil & Gas Decommissioning Market is poised for significant expansion. Driven by aging offshore infrastructure and evolving environmental regulations, the market is projected to reach $11.1 billion by 2025, with a Compound Annual Growth Rate (CAGR) of 6.5% between 2025 and 2033. This growth is underpinned by a substantial number of platforms nearing the end of their operational lives, necessitating considerable investment in safe and compliant removal. Stringent environmental mandates, rising operational expenses for aging assets, and an amplified commitment to sustainability are key drivers. Leading market participants include specialized decommissioning contractors, engineering firms, and service providers, who are investing in advanced technologies such as Remotely Operated Vehicles (ROVs) and enhanced waste management systems to optimize efficiency and mitigate environmental impact.
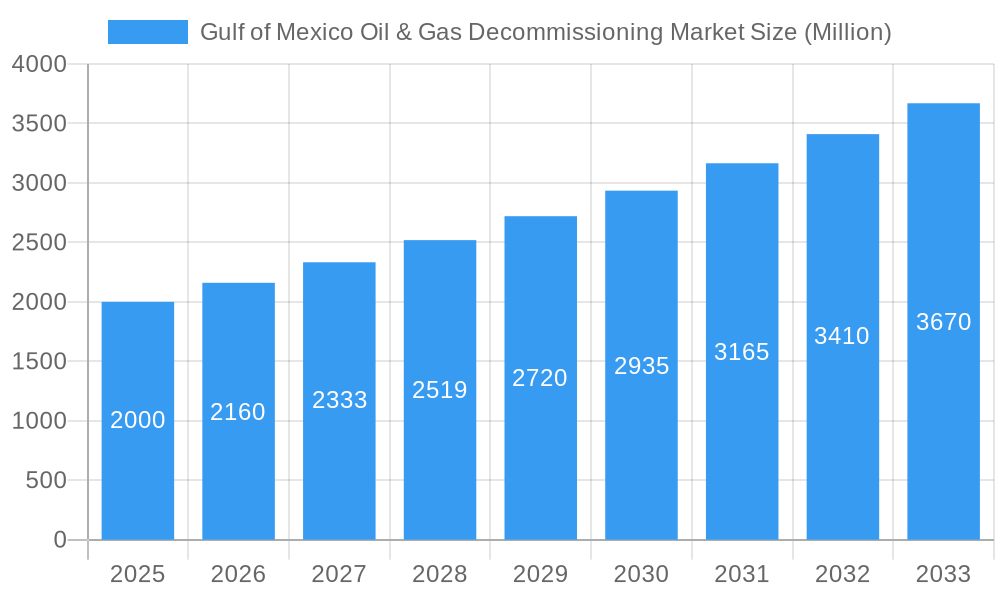
Gulf of Mexico Oil & Gas Decommissioning Market Market Size (In Billion)
Market expansion is anticipated to be steady throughout the forecast period. While fluctuations in oil and gas prices may influence project timelines, the long-term outlook remains robust due to the inherent necessity for decommissioning. Government incentives and support for sustainable practices are expected to further stimulate growth. Competitive bidding and technological innovations will likely redefine the market, presenting opportunities for both established and emerging companies. The Gulf of Mexico, characterized by its high density of aging oil and gas infrastructure, will continue to be a primary hub for decommissioning activities.
Gulf of Mexico Oil & Gas Decommissioning Market Company Market Share
Gulf of Mexico Oil & Gas Decommissioning Market Report: 2019-2033
This comprehensive report provides an in-depth analysis of the Gulf of Mexico Oil & Gas Decommissioning market, encompassing market dynamics, growth trends, regional segmentation, product landscape, key players, and future outlook. The study period covers 2019-2033, with 2025 as the base and estimated year. This report is crucial for industry professionals, investors, and policymakers seeking a clear understanding of this evolving market, valued at xx Million in 2025 and projected to reach xx Million by 2033. The parent market is the broader Oil & Gas industry, while the child market focuses specifically on decommissioning activities in the Gulf of Mexico.
Gulf of Mexico Oil & Gas Decommissioning Market Market Dynamics & Structure
This section analyzes the competitive landscape, technological advancements, regulatory influences, and market trends within the Gulf of Mexico Oil & Gas Decommissioning market. The market is moderately concentrated, with several major players holding significant shares. Technological innovation is driven by the need for more efficient and environmentally friendly decommissioning methods. Stringent regulatory frameworks, particularly concerning environmental protection and safety, heavily influence market operations. The emergence of innovative technologies and increased focus on environmental sustainability are reshaping the competitive dynamics.
- Market Concentration: Moderately concentrated, with top 5 players holding approximately xx% market share in 2025.
- Technological Innovation: Focus on ROVs, autonomous underwater vehicles (AUVs), and advanced subsea technologies drive efficiency and reduce environmental impact.
- Regulatory Framework: Stringent regulations from agencies like the Bureau of Safety and Environmental Enforcement (BSEE) shape decommissioning practices.
- Competitive Substitutes: Limited direct substitutes, but efficiency improvements are a significant competitive factor.
- M&A Activity: A moderate level of mergers and acquisitions (M&A) activity is observed, primarily focused on expanding service offerings and geographical reach. An estimated xx M&A deals occurred between 2019-2024.
Gulf of Mexico Oil & Gas Decommissioning Market Growth Trends & Insights
The Gulf of Mexico Oil & Gas Decommissioning market is experiencing substantial growth driven by several factors. The aging infrastructure, coupled with the increasing regulatory pressure to decommission assets safely and responsibly, is a key driver. Technological advancements, offering more efficient and cost-effective solutions, further accelerate market expansion. The market exhibited a CAGR of xx% during the historical period (2019-2024) and is projected to maintain a CAGR of xx% during the forecast period (2025-2033). Market penetration of advanced technologies is steadily increasing, with xx% adoption rate in 2025 expected to rise to xx% by 2033. Consumer behavior (i.e., operators' choices) reflects a growing preference for environmentally conscious and cost-optimized decommissioning solutions.
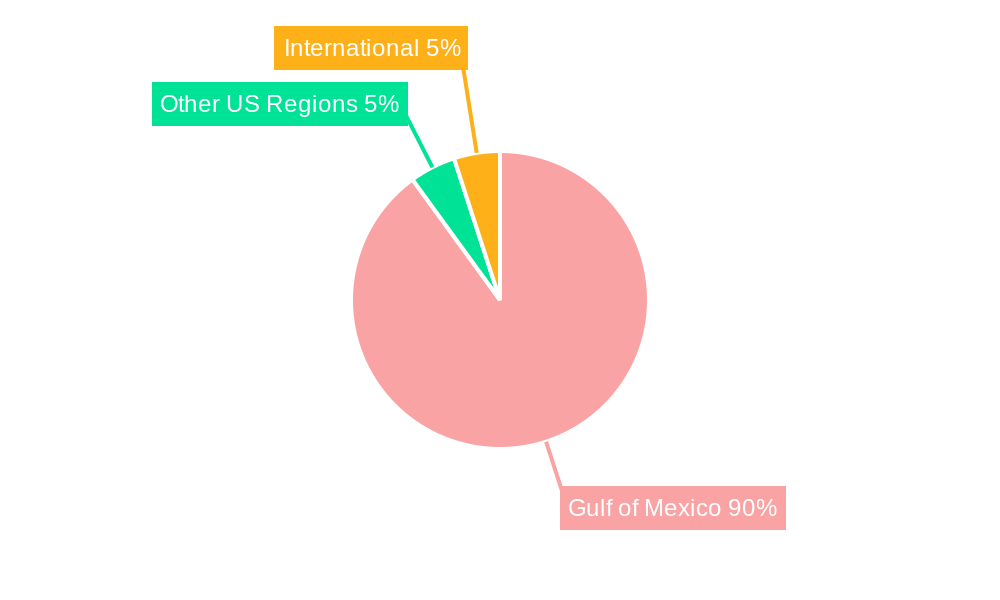
Dominant Regions, Countries, or Segments in Gulf of Mexico Oil & Gas Decommissioning Market
The deepwater segment currently dominates the Gulf of Mexico Oil & Gas Decommissioning market, accounting for approximately xx% of the total market value in 2025. This dominance is attributable to the significant number of aging deepwater platforms requiring decommissioning. The shallow water segment also presents a considerable market opportunity, though smaller in scale.
- Deepwater Segment Drivers: High concentration of aging deepwater platforms, complex decommissioning requirements, and associated high costs.
- Shallow Water Segment Drivers: Simpler decommissioning processes, potentially lower costs, but large number of aging platforms.
- Geographic Dominance: The market is concentrated primarily within the US Gulf of Mexico, with minimal activity in other regions.
Gulf of Mexico Oil & Gas Decommissioning Market Product Landscape
The product landscape encompasses a range of services, including platform removal, pipeline decommissioning, well plugging and abandonment, and waste management. Technological advancements such as remotely operated vehicles (ROVs) and autonomous underwater vehicles (AUVs) are improving efficiency and safety. The focus is on minimizing environmental impact and optimizing cost-effectiveness. Unique selling propositions often center around technological innovation, specialized expertise, and environmental stewardship.
Key Drivers, Barriers & Challenges in Gulf of Mexico Oil & Gas Decommissioning Market
Key Drivers:
- Aging infrastructure requiring decommissioning.
- Stricter environmental regulations.
- Technological advancements leading to cost-effective solutions.
- Government incentives for responsible decommissioning practices.
Challenges & Restraints:
- High decommissioning costs, potentially delaying projects.
- Complex regulatory approval processes creating significant time lags.
- Potential supply chain bottlenecks impacting project timelines and costs.
- Technological limitations in handling specific decommissioning challenges in extreme environments.
Emerging Opportunities in Gulf of Mexico Oil & Gas Decommissioning Market
- Development of innovative decommissioning technologies.
- Increased focus on recycling and reuse of decommissioned materials.
- Expansion into new services such as site restoration and environmental remediation.
- Potential for partnerships and collaborations to optimize decommissioning strategies.
Growth Accelerators in the Gulf of Mexico Oil & Gas Decommissioning Market Industry
Technological breakthroughs in automation, robotics, and subsea engineering are key catalysts for market expansion. Strategic partnerships between service companies and operators are streamlining processes and reducing costs. Expansion into offshore wind energy decommissioning offers a new market opportunity.
Key Players Shaping the Gulf of Mexico Oil & Gas Decommissioning Market Market
- Exxon Mobil Corporation
- Chevron Corporation
- Ardent Global LL
- Ramboll Group
- Apache Corporation
- Proserv Group Inc
- BP P L C
- TETRA Technologies Inc
- Anadarko Petroleum Corporation
Notable Milestones in Gulf of Mexico Oil & Gas Decommissioning Market Sector
- 2022: Introduction of a new remotely operated vehicle (ROV) with enhanced capabilities.
- 2023: Successful completion of a large-scale platform removal project using innovative techniques.
- 2024: Announcement of a major partnership between a service company and an operator to streamline decommissioning operations.
In-Depth Gulf of Mexico Oil & Gas Decommissioning Market Market Outlook
The Gulf of Mexico Oil & Gas Decommissioning market is poised for continued growth, driven by technological advancements, stricter regulations, and the increasing number of aging assets. Strategic partnerships, investment in innovation, and a focus on sustainable decommissioning practices will be key to maximizing market potential and capturing lucrative opportunities in the coming years. The market's long-term prospects are positive, with significant growth anticipated across all segments.
Gulf of Mexico Oil & Gas Decommissioning Market Segmentation
-
1. Water Depth
- 1.1. Shallow Water
- 1.2. Deepwater
Gulf of Mexico Oil & Gas Decommissioning Market Segmentation By Geography
-
1. North America
- 1.1. United States
- 1.2. Canada
- 1.3. Mexico
-
2. South America
- 2.1. Brazil
- 2.2. Argentina
- 2.3. Rest of South America
-
3. Europe
- 3.1. United Kingdom
- 3.2. Germany
- 3.3. France
- 3.4. Italy
- 3.5. Spain
- 3.6. Russia
- 3.7. Benelux
- 3.8. Nordics
- 3.9. Rest of Europe
-
4. Middle East & Africa
- 4.1. Turkey
- 4.2. Israel
- 4.3. GCC
- 4.4. North Africa
- 4.5. South Africa
- 4.6. Rest of Middle East & Africa
-
5. Asia Pacific
- 5.1. China
- 5.2. India
- 5.3. Japan
- 5.4. South Korea
- 5.5. ASEAN
- 5.6. Oceania
- 5.7. Rest of Asia Pacific
Gulf of Mexico Oil & Gas Decommissioning Market Regional Market Share
Geographic Coverage of Gulf of Mexico Oil & Gas Decommissioning Market
Gulf of Mexico Oil & Gas Decommissioning Market REPORT HIGHLIGHTS
| Aspects | Details |
|---|---|
| Study Period | 2020-2034 |
| Base Year | 2025 |
| Estimated Year | 2026 |
| Forecast Period | 2026-2034 |
| Historical Period | 2020-2025 |
| Growth Rate | CAGR of 6.5% from 2020-2034 |
| Segmentation |
|
Table of Contents
- 1. Introduction
- 1.1. Research Scope
- 1.2. Market Segmentation
- 1.3. Research Objective
- 1.4. Definitions and Assumptions
- 2. Executive Summary
- 2.1. Market Snapshot
- 3. Market Dynamics
- 3.1. Market Drivers
- 3.2. Market Restrains
- 3.3. Market Trends
- 3.4. Market Opportunities
- 4. Market Factor Analysis
- 4.1. Porters Five Forces
- 4.1.1. Bargaining Power of Suppliers
- 4.1.2. Bargaining Power of Buyers
- 4.1.3. Threat of New Entrants
- 4.1.4. Threat of Substitutes
- 4.1.5. Competitive Rivalry
- 4.2. PESTEL analysis
- 4.3. BCG Analysis
- 4.3.1. Stars (High Growth, High Market Share)
- 4.3.2. Cash Cows (Low Growth, High Market Share)
- 4.3.3. Question Mark (High Growth, Low Market Share)
- 4.3.4. Dogs (Low Growth, Low Market Share)
- 4.4. Ansoff Matrix Analysis
- 4.5. Supply Chain Analysis
- 4.6. Regulatory Landscape
- 4.7. Current Market Potential and Opportunity Assessment (TAM–SAM–SOM Framework)
- 4.8. VDR Analyst Note
- 4.1. Porters Five Forces
- 5. Market Analysis, Insights and Forecast 2021-2033
- 5.1. Market Analysis, Insights and Forecast - by Water Depth
- 5.1.1. Shallow Water
- 5.1.2. Deepwater
- 5.2. Market Analysis, Insights and Forecast - by Region
- 5.2.1. North America
- 5.2.2. South America
- 5.2.3. Europe
- 5.2.4. Middle East & Africa
- 5.2.5. Asia Pacific
- 5.1. Market Analysis, Insights and Forecast - by Water Depth
- 6. Global Gulf of Mexico Oil & Gas Decommissioning Market Analysis, Insights and Forecast, 2021-2033
- 6.1. Market Analysis, Insights and Forecast - by Water Depth
- 6.1.1. Shallow Water
- 6.1.2. Deepwater
- 6.1. Market Analysis, Insights and Forecast - by Water Depth
- 7. North America Gulf of Mexico Oil & Gas Decommissioning Market Analysis, Insights and Forecast, 2021-2033
- 7.1. Market Analysis, Insights and Forecast - by Water Depth
- 7.1.1. Shallow Water
- 7.1.2. Deepwater
- 7.1. Market Analysis, Insights and Forecast - by Water Depth
- 8. South America Gulf of Mexico Oil & Gas Decommissioning Market Analysis, Insights and Forecast, 2021-2033
- 8.1. Market Analysis, Insights and Forecast - by Water Depth
- 8.1.1. Shallow Water
- 8.1.2. Deepwater
- 8.1. Market Analysis, Insights and Forecast - by Water Depth
- 9. Europe Gulf of Mexico Oil & Gas Decommissioning Market Analysis, Insights and Forecast, 2021-2033
- 9.1. Market Analysis, Insights and Forecast - by Water Depth
- 9.1.1. Shallow Water
- 9.1.2. Deepwater
- 9.1. Market Analysis, Insights and Forecast - by Water Depth
- 10. Middle East & Africa Gulf of Mexico Oil & Gas Decommissioning Market Analysis, Insights and Forecast, 2021-2033
- 10.1. Market Analysis, Insights and Forecast - by Water Depth
- 10.1.1. Shallow Water
- 10.1.2. Deepwater
- 10.1. Market Analysis, Insights and Forecast - by Water Depth
- 11. Asia Pacific Gulf of Mexico Oil & Gas Decommissioning Market Analysis, Insights and Forecast, 2021-2033
- 11.1. Market Analysis, Insights and Forecast - by Water Depth
- 11.1.1. Shallow Water
- 11.1.2. Deepwater
- 11.1. Market Analysis, Insights and Forecast - by Water Depth
- 12. Competitive Analysis
- 12.1. Company Profiles
- 12.1.1 Service Companies
- 12.1.1.1. Company Overview
- 12.1.1.2. Products
- 12.1.1.3. Company Financials
- 12.1.1.4. SWOT Analysis
- 12.1.2 5 Exxon Mobil Corporation
- 12.1.2.1. Company Overview
- 12.1.2.2. Products
- 12.1.2.3. Company Financials
- 12.1.2.4. SWOT Analysis
- 12.1.3 4 Chevron Corporation
- 12.1.3.1. Company Overview
- 12.1.3.2. Products
- 12.1.3.3. Company Financials
- 12.1.3.4. SWOT Analysis
- 12.1.4 4 Ardent Global LL
- 12.1.4.1. Company Overview
- 12.1.4.2. Products
- 12.1.4.3. Company Financials
- 12.1.4.4. SWOT Analysis
- 12.1.5 2 Ramboll Group
- 12.1.5.1. Company Overview
- 12.1.5.2. Products
- 12.1.5.3. Company Financials
- 12.1.5.4. SWOT Analysis
- 12.1.6 2 Apache Corporation
- 12.1.6.1. Company Overview
- 12.1.6.2. Products
- 12.1.6.3. Company Financials
- 12.1.6.4. SWOT Analysis
- 12.1.7 1 Proserv Group Inc
- 12.1.7.1. Company Overview
- 12.1.7.2. Products
- 12.1.7.3. Company Financials
- 12.1.7.4. SWOT Analysis
- 12.1.8 Operators
- 12.1.8.1. Company Overview
- 12.1.8.2. Products
- 12.1.8.3. Company Financials
- 12.1.8.4. SWOT Analysis
- 12.1.9 3 TETRA Technologies Inc
- 12.1.9.1. Company Overview
- 12.1.9.2. Products
- 12.1.9.3. Company Financials
- 12.1.9.4. SWOT Analysis
- 12.1.10 1 Anadarko Petroleum Corporation
- 12.1.10.1. Company Overview
- 12.1.10.2. Products
- 12.1.10.3. Company Financials
- 12.1.10.4. SWOT Analysis
- 12.1.11 3 BP P L C
- 12.1.11.1. Company Overview
- 12.1.11.2. Products
- 12.1.11.3. Company Financials
- 12.1.11.4. SWOT Analysis
- 12.1.1 Service Companies
- 12.2. Market Entropy
- 12.2.1 Company's Key Areas Served
- 12.2.2 Recent Developments
- 12.3. Company Market Share Analysis 2025
- 12.3.1 Top 5 Companies Market Share Analysis
- 12.3.2 Top 3 Companies Market Share Analysis
- 12.4. List of Potential Customers
- 13. Research Methodology
List of Figures
- Figure 1: Global Gulf of Mexico Oil & Gas Decommissioning Market Revenue Breakdown (billion, %) by Region 2025 & 2033
- Figure 2: North America Gulf of Mexico Oil & Gas Decommissioning Market Revenue (billion), by Water Depth 2025 & 2033
- Figure 3: North America Gulf of Mexico Oil & Gas Decommissioning Market Revenue Share (%), by Water Depth 2025 & 2033
- Figure 4: North America Gulf of Mexico Oil & Gas Decommissioning Market Revenue (billion), by Country 2025 & 2033
- Figure 5: North America Gulf of Mexico Oil & Gas Decommissioning Market Revenue Share (%), by Country 2025 & 2033
- Figure 6: South America Gulf of Mexico Oil & Gas Decommissioning Market Revenue (billion), by Water Depth 2025 & 2033
- Figure 7: South America Gulf of Mexico Oil & Gas Decommissioning Market Revenue Share (%), by Water Depth 2025 & 2033
- Figure 8: South America Gulf of Mexico Oil & Gas Decommissioning Market Revenue (billion), by Country 2025 & 2033
- Figure 9: South America Gulf of Mexico Oil & Gas Decommissioning Market Revenue Share (%), by Country 2025 & 2033
- Figure 10: Europe Gulf of Mexico Oil & Gas Decommissioning Market Revenue (billion), by Water Depth 2025 & 2033
- Figure 11: Europe Gulf of Mexico Oil & Gas Decommissioning Market Revenue Share (%), by Water Depth 2025 & 2033
- Figure 12: Europe Gulf of Mexico Oil & Gas Decommissioning Market Revenue (billion), by Country 2025 & 2033
- Figure 13: Europe Gulf of Mexico Oil & Gas Decommissioning Market Revenue Share (%), by Country 2025 & 2033
- Figure 14: Middle East & Africa Gulf of Mexico Oil & Gas Decommissioning Market Revenue (billion), by Water Depth 2025 & 2033
- Figure 15: Middle East & Africa Gulf of Mexico Oil & Gas Decommissioning Market Revenue Share (%), by Water Depth 2025 & 2033
- Figure 16: Middle East & Africa Gulf of Mexico Oil & Gas Decommissioning Market Revenue (billion), by Country 2025 & 2033
- Figure 17: Middle East & Africa Gulf of Mexico Oil & Gas Decommissioning Market Revenue Share (%), by Country 2025 & 2033
- Figure 18: Asia Pacific Gulf of Mexico Oil & Gas Decommissioning Market Revenue (billion), by Water Depth 2025 & 2033
- Figure 19: Asia Pacific Gulf of Mexico Oil & Gas Decommissioning Market Revenue Share (%), by Water Depth 2025 & 2033
- Figure 20: Asia Pacific Gulf of Mexico Oil & Gas Decommissioning Market Revenue (billion), by Country 2025 & 2033
- Figure 21: Asia Pacific Gulf of Mexico Oil & Gas Decommissioning Market Revenue Share (%), by Country 2025 & 2033
List of Tables
- Table 1: Global Gulf of Mexico Oil & Gas Decommissioning Market Revenue billion Forecast, by Water Depth 2020 & 2033
- Table 2: Global Gulf of Mexico Oil & Gas Decommissioning Market Revenue billion Forecast, by Region 2020 & 2033
- Table 3: Global Gulf of Mexico Oil & Gas Decommissioning Market Revenue billion Forecast, by Water Depth 2020 & 2033
- Table 4: Global Gulf of Mexico Oil & Gas Decommissioning Market Revenue billion Forecast, by Country 2020 & 2033
- Table 5: United States Gulf of Mexico Oil & Gas Decommissioning Market Revenue (billion) Forecast, by Application 2020 & 2033
- Table 6: Canada Gulf of Mexico Oil & Gas Decommissioning Market Revenue (billion) Forecast, by Application 2020 & 2033
- Table 7: Mexico Gulf of Mexico Oil & Gas Decommissioning Market Revenue (billion) Forecast, by Application 2020 & 2033
- Table 8: Global Gulf of Mexico Oil & Gas Decommissioning Market Revenue billion Forecast, by Water Depth 2020 & 2033
- Table 9: Global Gulf of Mexico Oil & Gas Decommissioning Market Revenue billion Forecast, by Country 2020 & 2033
- Table 10: Brazil Gulf of Mexico Oil & Gas Decommissioning Market Revenue (billion) Forecast, by Application 2020 & 2033
- Table 11: Argentina Gulf of Mexico Oil & Gas Decommissioning Market Revenue (billion) Forecast, by Application 2020 & 2033
- Table 12: Rest of South America Gulf of Mexico Oil & Gas Decommissioning Market Revenue (billion) Forecast, by Application 2020 & 2033
- Table 13: Global Gulf of Mexico Oil & Gas Decommissioning Market Revenue billion Forecast, by Water Depth 2020 & 2033
- Table 14: Global Gulf of Mexico Oil & Gas Decommissioning Market Revenue billion Forecast, by Country 2020 & 2033
- Table 15: United Kingdom Gulf of Mexico Oil & Gas Decommissioning Market Revenue (billion) Forecast, by Application 2020 & 2033
- Table 16: Germany Gulf of Mexico Oil & Gas Decommissioning Market Revenue (billion) Forecast, by Application 2020 & 2033
- Table 17: France Gulf of Mexico Oil & Gas Decommissioning Market Revenue (billion) Forecast, by Application 2020 & 2033
- Table 18: Italy Gulf of Mexico Oil & Gas Decommissioning Market Revenue (billion) Forecast, by Application 2020 & 2033
- Table 19: Spain Gulf of Mexico Oil & Gas Decommissioning Market Revenue (billion) Forecast, by Application 2020 & 2033
- Table 20: Russia Gulf of Mexico Oil & Gas Decommissioning Market Revenue (billion) Forecast, by Application 2020 & 2033
- Table 21: Benelux Gulf of Mexico Oil & Gas Decommissioning Market Revenue (billion) Forecast, by Application 2020 & 2033
- Table 22: Nordics Gulf of Mexico Oil & Gas Decommissioning Market Revenue (billion) Forecast, by Application 2020 & 2033
- Table 23: Rest of Europe Gulf of Mexico Oil & Gas Decommissioning Market Revenue (billion) Forecast, by Application 2020 & 2033
- Table 24: Global Gulf of Mexico Oil & Gas Decommissioning Market Revenue billion Forecast, by Water Depth 2020 & 2033
- Table 25: Global Gulf of Mexico Oil & Gas Decommissioning Market Revenue billion Forecast, by Country 2020 & 2033
- Table 26: Turkey Gulf of Mexico Oil & Gas Decommissioning Market Revenue (billion) Forecast, by Application 2020 & 2033
- Table 27: Israel Gulf of Mexico Oil & Gas Decommissioning Market Revenue (billion) Forecast, by Application 2020 & 2033
- Table 28: GCC Gulf of Mexico Oil & Gas Decommissioning Market Revenue (billion) Forecast, by Application 2020 & 2033
- Table 29: North Africa Gulf of Mexico Oil & Gas Decommissioning Market Revenue (billion) Forecast, by Application 2020 & 2033
- Table 30: South Africa Gulf of Mexico Oil & Gas Decommissioning Market Revenue (billion) Forecast, by Application 2020 & 2033
- Table 31: Rest of Middle East & Africa Gulf of Mexico Oil & Gas Decommissioning Market Revenue (billion) Forecast, by Application 2020 & 2033
- Table 32: Global Gulf of Mexico Oil & Gas Decommissioning Market Revenue billion Forecast, by Water Depth 2020 & 2033
- Table 33: Global Gulf of Mexico Oil & Gas Decommissioning Market Revenue billion Forecast, by Country 2020 & 2033
- Table 34: China Gulf of Mexico Oil & Gas Decommissioning Market Revenue (billion) Forecast, by Application 2020 & 2033
- Table 35: India Gulf of Mexico Oil & Gas Decommissioning Market Revenue (billion) Forecast, by Application 2020 & 2033
- Table 36: Japan Gulf of Mexico Oil & Gas Decommissioning Market Revenue (billion) Forecast, by Application 2020 & 2033
- Table 37: South Korea Gulf of Mexico Oil & Gas Decommissioning Market Revenue (billion) Forecast, by Application 2020 & 2033
- Table 38: ASEAN Gulf of Mexico Oil & Gas Decommissioning Market Revenue (billion) Forecast, by Application 2020 & 2033
- Table 39: Oceania Gulf of Mexico Oil & Gas Decommissioning Market Revenue (billion) Forecast, by Application 2020 & 2033
- Table 40: Rest of Asia Pacific Gulf of Mexico Oil & Gas Decommissioning Market Revenue (billion) Forecast, by Application 2020 & 2033
Frequently Asked Questions
1. What is the projected Compound Annual Growth Rate (CAGR) of the Gulf of Mexico Oil & Gas Decommissioning Market?
The projected CAGR is approximately 6.5%.
2. Which companies are prominent players in the Gulf of Mexico Oil & Gas Decommissioning Market?
Key companies in the market include Service Companies, 5 Exxon Mobil Corporation, 4 Chevron Corporation, 4 Ardent Global LL, 2 Ramboll Group, 2 Apache Corporation, 1 Proserv Group Inc, Operators, 3 TETRA Technologies Inc, 1 Anadarko Petroleum Corporation, 3 BP P L C.
3. What are the main segments of the Gulf of Mexico Oil & Gas Decommissioning Market?
The market segments include Water Depth.
4. Can you provide details about the market size?
The market size is estimated to be USD 11.1 billion as of 2022.
5. What are some drivers contributing to market growth?
N/A
6. What are the notable trends driving market growth?
Deepwater to Register Highest Growth Rate.
7. Are there any restraints impacting market growth?
N/A
8. Can you provide examples of recent developments in the market?
N/A
9. What pricing options are available for accessing the report?
Pricing options include single-user, multi-user, and enterprise licenses priced at USD 3800, USD 4500, and USD 5800 respectively.
10. Is the market size provided in terms of value or volume?
The market size is provided in terms of value, measured in billion.
11. Are there any specific market keywords associated with the report?
Yes, the market keyword associated with the report is "Gulf of Mexico Oil & Gas Decommissioning Market," which aids in identifying and referencing the specific market segment covered.
12. How do I determine which pricing option suits my needs best?
The pricing options vary based on user requirements and access needs. Individual users may opt for single-user licenses, while businesses requiring broader access may choose multi-user or enterprise licenses for cost-effective access to the report.
13. Are there any additional resources or data provided in the Gulf of Mexico Oil & Gas Decommissioning Market report?
While the report offers comprehensive insights, it's advisable to review the specific contents or supplementary materials provided to ascertain if additional resources or data are available.
14. How can I stay updated on further developments or reports in the Gulf of Mexico Oil & Gas Decommissioning Market?
To stay informed about further developments, trends, and reports in the Gulf of Mexico Oil & Gas Decommissioning Market, consider subscribing to industry newsletters, following relevant companies and organizations, or regularly checking reputable industry news sources and publications.
Methodology
Step 1 - Identification of Relevant Samples Size from Population Database


Step 2 - Approaches for Defining Global Market Size (Value, Volume* & Price*)

Note*: In applicable scenarios
Step 3 - Data Sources
Primary Research
- Web Analytics
- Survey Reports
- Research Institute
- Latest Research Reports
- Opinion Leaders
Secondary Research
- Annual Reports
- White Paper
- Latest Press Release
- Industry Association
- Paid Database
- Investor Presentations

Step 4 - Data Triangulation
Involves using different sources of information in order to increase the validity of a study
These sources are likely to be stakeholders in a program - participants, other researchers, program staff, other community members, and so on.
Then we put all data in single framework & apply various statistical tools to find out the dynamic on the market.
During the analysis stage, feedback from the stakeholder groups would be compared to determine areas of agreement as well as areas of divergence