


Key Insights
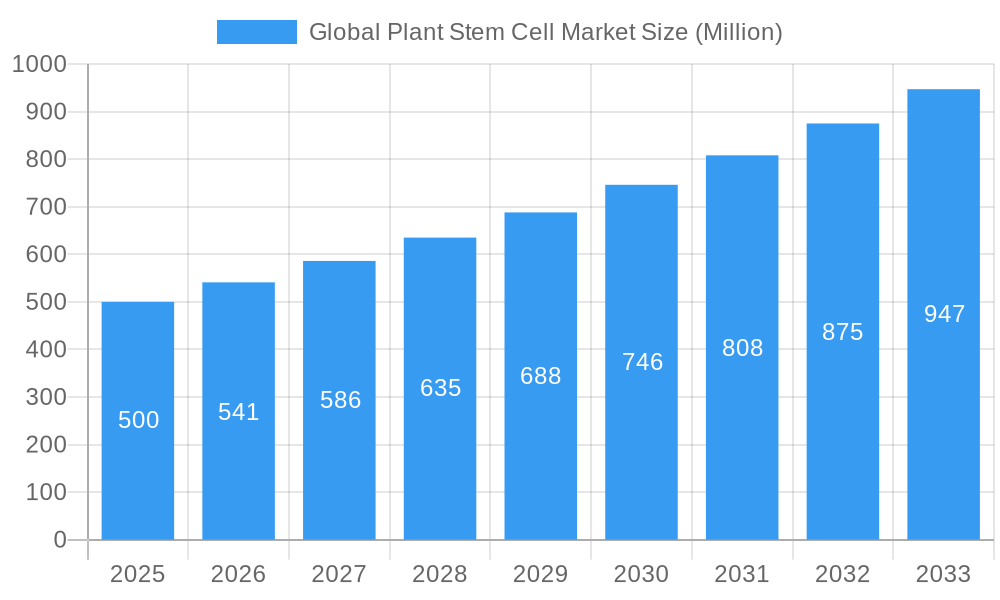
The global plant stem cell market is projected for substantial growth, driven by escalating demand for natural, sustainable ingredients in cosmetics, pharmaceuticals, and nutrition. With a projected CAGR of 8.5%, the market, valued at approximately 5.01 billion in the base year 2025, is expected to expand significantly through 2033. Key growth catalysts include increasing consumer awareness of plant-derived ingredient benefits in skincare and health, and the pharmaceutical industry's focus on plant stem cells for novel therapeutic development. Market segmentation by source (root apical meristems, shoot apical meristems, vascular meristems) and application (nutrition, pharmaceuticals, cosmetics) highlights the technology's versatility and broad appeal.
Global Plant Stem Cell Market Market Size (In Billion)

Geographically, North America and Europe are expected to lead due to robust research infrastructure and supportive regulatory environments. However, the Asia-Pacific region is poised for rapid expansion, fueled by rising disposable incomes and growing consumer interest in natural health and beauty solutions. Despite potential challenges such as stringent regulatory approvals and raw material price volatility, the market outlook remains highly positive, driven by technological advancements and a sustained emphasis on natural, sustainable products across industries.
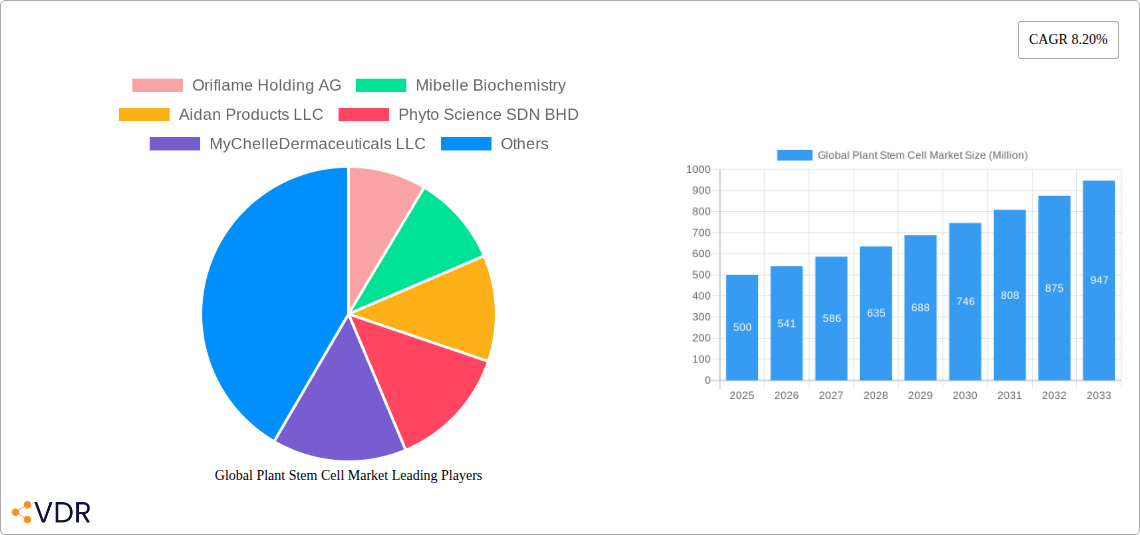
Global Plant Stem Cell Market Company Market Share
Global Plant Stem Cell Market: A Comprehensive Report (2019-2033)
This comprehensive report provides a detailed analysis of the global plant stem cell market, encompassing market dynamics, growth trends, regional performance, product landscape, key players, and future outlook. The study period covers 2019-2033, with 2025 as the base and estimated year. The report segments the market by location (Root Apical Meristems, Shoot Apical Meristems, Vascular Meristems) and application (Nutrition, Pharmaceutical, Cosmetics), providing granular insights into each segment’s performance and growth trajectory. The parent market is the broader biotechnology market, while the child market focuses specifically on plant-derived stem cell applications. The total market size is projected to reach xx Million by 2033.
Global Plant Stem Cell Market Dynamics & Structure
The global plant stem cell market is characterized by moderate concentration, with several key players holding significant market share. Technological innovation, particularly in extraction and cultivation techniques, is a major driver, while regulatory frameworks concerning the safety and efficacy of plant stem cell products influence market growth. The market faces competition from traditional ingredients and synthetic alternatives, but the increasing consumer demand for natural and sustainable products presents a significant opportunity. Mergers and acquisitions (M&A) activity has been relatively low (xx deals in the last 5 years), but strategic partnerships are becoming increasingly common.
- Market Concentration: Moderately concentrated, with the top 5 players holding approximately xx% of the market share in 2025.
- Technological Innovation: Focus on improving extraction efficiency, standardizing product quality, and expanding applications.
- Regulatory Landscape: Varying regulations across different regions create challenges for market expansion.
- Competitive Substitutes: Traditional ingredients and synthetic alternatives pose a competitive threat.
- End-User Demographics: Growing interest in natural and sustainable products, particularly among health-conscious consumers, fuels market growth.
- M&A Trends: Low M&A activity, with a focus on strategic partnerships and collaborations.
Global Plant Stem Cell Market Growth Trends & Insights
The global plant stem cell market experienced significant growth during the historical period (2019-2024), driven by increasing consumer awareness of the benefits of plant-based ingredients and technological advancements in extraction and processing. The market is expected to continue its growth trajectory during the forecast period (2025-2033), with a projected CAGR of xx%. This growth is fueled by the rising demand for natural and organic products in the cosmetics, pharmaceutical, and nutrition sectors. Technological disruptions, such as advancements in cell culture and genetic engineering, are further enhancing the efficiency and scalability of plant stem cell production. Shifting consumer behavior towards personalized wellness and preventive healthcare also contributes to the market expansion. Market penetration in the cosmetic sector is currently estimated at xx%, with projected increases in both the pharmaceutical and nutritional sectors.
Dominant Regions, Countries, or Segments in Global Plant Stem Cell Market
North America currently holds the largest market share, driven by high consumer spending on health and wellness products and robust regulatory frameworks. Europe is also a significant market, followed by Asia-Pacific, which shows significant growth potential due to the rising disposable incomes and increasing awareness of natural products. Within the segments, the Cosmetics application holds the largest market share (xx%), followed by Pharmaceutical (xx%) and Nutrition (xx%). The Shoot Apical Meristems segment dominates the market by location, owing to higher yields and easier access.
- North America: High consumer spending on health and wellness products.
- Europe: Strong regulatory frameworks and high adoption rates.
- Asia-Pacific: High growth potential driven by rising disposable incomes.
- Cosmetics Application: Largest market share due to the high demand for natural and anti-aging products.
- Shoot Apical Meristems Location: Highest yields and accessibility contribute to segment dominance.
Global Plant Stem Cell Market Product Landscape
Plant stem cell products are increasingly diverse, ranging from raw extracts to standardized formulations used in various applications. Key innovations involve enhancing extraction methods to maximize the concentration of bioactive compounds, improving stability and shelf life, and developing novel delivery systems for targeted benefits. Products showcase unique selling propositions (USPs) based on specific plant sources and their associated health benefits. Technological advancements focus on optimizing the cultivation and processing of plant stem cells, ensuring consistent quality and efficacy.
Key Drivers, Barriers & Challenges in Global Plant Stem Cell Market
Key Drivers: Growing consumer demand for natural and organic products, advancements in extraction and cultivation technologies, increasing awareness of the health benefits of plant stem cells, and government support for the development of sustainable industries.
Key Challenges: High production costs, stringent regulatory requirements, lack of standardization, and competition from synthetic alternatives. The supply chain for plant stem cell materials can also be complex and susceptible to disruptions. These factors can affect market expansion by impacting production efficiency and product cost.
Emerging Opportunities in Global Plant Stem Cell Market
Untapped markets exist in developing economies with high growth potential, while new applications in areas such as regenerative medicine and personalized nutrition present significant opportunities. Evolving consumer preferences toward personalized health solutions will drive demand for customized plant stem cell products. Focus on developing sustainable and scalable cultivation methods could further enhance profitability and reduce environmental impact.
Growth Accelerators in the Global Plant Stem Cell Market Industry
Technological breakthroughs in gene editing and plant tissue culture, strategic collaborations between research institutions and industry players, and market expansion into new geographical regions are key catalysts driving long-term growth. Focus on improving product efficacy and developing novel delivery systems enhances market appeal and encourages wider adoption.
Key Players Shaping the Global Plant Stem Cell Market Market
- Oriflame Holding AG
- Mibelle Biochemistry
- Aidan Products LLC
- Phyto Science SDN BHD
- MyChelleDermaceuticals LLC
- Natura Therapeutics Inc
- Renature Skin Care Inc
Notable Milestones in Global Plant Stem Cell Market Sector
- April 2022: Frownies launched a new skin-renewing apple serum utilizing plant-based stem cell technology.
- March 2022: Bayer and NutriLeads launched Daily Immunity, an immune product featuring BeniCaros, a plant stem cell ingredient.
In-Depth Global Plant Stem Cell Market Market Outlook
The future of the global plant stem cell market is bright, with continued growth projected throughout the forecast period. Opportunities exist for companies to capitalize on emerging trends, such as personalized medicine and sustainable sourcing. Strategic partnerships, technological innovation, and expansion into new markets will be key to realizing the full potential of this promising sector. The market's overall trajectory remains positive, with significant potential for expansion driven by increasing consumer interest, technological advancements, and regulatory developments.
Global Plant Stem Cell Market Segmentation
-
1. Location
- 1.1. Root Apical Meristems
- 1.2. Shoot Apical Meristems
- 1.3. Vascular Meristems
-
2. Application
- 2.1. Nutrition
- 2.2. Pharmaceutical
- 2.3. Cosmetics
Global Plant Stem Cell Market Segmentation By Geography
-
1. North America
- 1.1. United States
- 1.2. Canada
- 1.3. Mexico
-
2. Europe
- 2.1. Germany
- 2.2. United Kingdom
- 2.3. France
- 2.4. Italy
- 2.5. Spain
- 2.6. Rest of Europe
-
3. Asia Pacific
- 3.1. China
- 3.2. Japan
- 3.3. India
- 3.4. Australia
- 3.5. South Korea
- 3.6. Rest of Asia Pacific
-
4. Middle East and Africa
- 4.1. GCC
- 4.2. South Africa
- 4.3. Rest of Middle East and Africa
-
5. South America
- 5.1. Brazil
- 5.2. Argentina
- 5.3. Rest of South America
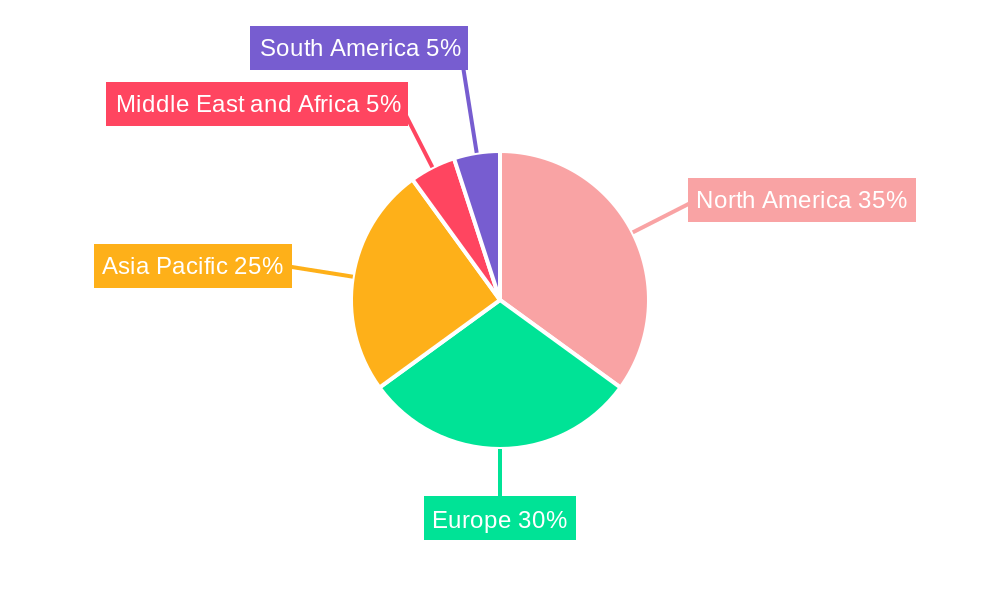
Global Plant Stem Cell Market Regional Market Share
Geographic Coverage of Global Plant Stem Cell Market
Global Plant Stem Cell Market REPORT HIGHLIGHTS
| Aspects | Details |
|---|---|
| Study Period | 2020-2034 |
| Base Year | 2025 |
| Estimated Year | 2026 |
| Forecast Period | 2026-2034 |
| Historical Period | 2020-2025 |
| Growth Rate | CAGR of 8.5% from 2020-2034 |
| Segmentation |
|
Table of Contents
- 1. Introduction
- 1.1. Research Scope
- 1.2. Market Segmentation
- 1.3. Research Methodology
- 1.4. Definitions and Assumptions
- 2. Executive Summary
- 2.1. Introduction
- 3. Market Dynamics
- 3.1. Introduction
- 3.2. Market Drivers
- 3.2.1. Rising Demand for Plant Stem Cells in the Cosmetic Industry; Increased Product Launches with Plant Stem Cells
- 3.3. Market Restrains
- 3.3.1. High Operational Cost with the Extracting and Manufacturing of Plant Stem Cell
- 3.4. Market Trends
- 3.4.1. Cosmetic by Application Segment is Expected to Dominate the Market Over the Forecast Period
- 4. Market Factor Analysis
- 4.1. Porters Five Forces
- 4.2. Supply/Value Chain
- 4.3. PESTEL analysis
- 4.4. Market Entropy
- 4.5. Patent/Trademark Analysis
- 5. Global Plant Stem Cell Market Analysis, Insights and Forecast, 2020-2032
- 5.1. Market Analysis, Insights and Forecast - by Location
- 5.1.1. Root Apical Meristems
- 5.1.2. Shoot Apical Meristems
- 5.1.3. Vascular Meristems
- 5.2. Market Analysis, Insights and Forecast - by Application
- 5.2.1. Nutrition
- 5.2.2. Pharmaceutical
- 5.2.3. Cosmetics
- 5.3. Market Analysis, Insights and Forecast - by Region
- 5.3.1. North America
- 5.3.2. Europe
- 5.3.3. Asia Pacific
- 5.3.4. Middle East and Africa
- 5.3.5. South America
- 5.1. Market Analysis, Insights and Forecast - by Location
- 6. North America Global Plant Stem Cell Market Analysis, Insights and Forecast, 2020-2032
- 6.1. Market Analysis, Insights and Forecast - by Location
- 6.1.1. Root Apical Meristems
- 6.1.2. Shoot Apical Meristems
- 6.1.3. Vascular Meristems
- 6.2. Market Analysis, Insights and Forecast - by Application
- 6.2.1. Nutrition
- 6.2.2. Pharmaceutical
- 6.2.3. Cosmetics
- 6.1. Market Analysis, Insights and Forecast - by Location
- 7. Europe Global Plant Stem Cell Market Analysis, Insights and Forecast, 2020-2032
- 7.1. Market Analysis, Insights and Forecast - by Location
- 7.1.1. Root Apical Meristems
- 7.1.2. Shoot Apical Meristems
- 7.1.3. Vascular Meristems
- 7.2. Market Analysis, Insights and Forecast - by Application
- 7.2.1. Nutrition
- 7.2.2. Pharmaceutical
- 7.2.3. Cosmetics
- 7.1. Market Analysis, Insights and Forecast - by Location
- 8. Asia Pacific Global Plant Stem Cell Market Analysis, Insights and Forecast, 2020-2032
- 8.1. Market Analysis, Insights and Forecast - by Location
- 8.1.1. Root Apical Meristems
- 8.1.2. Shoot Apical Meristems
- 8.1.3. Vascular Meristems
- 8.2. Market Analysis, Insights and Forecast - by Application
- 8.2.1. Nutrition
- 8.2.2. Pharmaceutical
- 8.2.3. Cosmetics
- 8.1. Market Analysis, Insights and Forecast - by Location
- 9. Middle East and Africa Global Plant Stem Cell Market Analysis, Insights and Forecast, 2020-2032
- 9.1. Market Analysis, Insights and Forecast - by Location
- 9.1.1. Root Apical Meristems
- 9.1.2. Shoot Apical Meristems
- 9.1.3. Vascular Meristems
- 9.2. Market Analysis, Insights and Forecast - by Application
- 9.2.1. Nutrition
- 9.2.2. Pharmaceutical
- 9.2.3. Cosmetics
- 9.1. Market Analysis, Insights and Forecast - by Location
- 10. South America Global Plant Stem Cell Market Analysis, Insights and Forecast, 2020-2032
- 10.1. Market Analysis, Insights and Forecast - by Location
- 10.1.1. Root Apical Meristems
- 10.1.2. Shoot Apical Meristems
- 10.1.3. Vascular Meristems
- 10.2. Market Analysis, Insights and Forecast - by Application
- 10.2.1. Nutrition
- 10.2.2. Pharmaceutical
- 10.2.3. Cosmetics
- 10.1. Market Analysis, Insights and Forecast - by Location
- 11. Competitive Analysis
- 11.1. Market Share Analysis 2025
- 11.2. Company Profiles
- 11.2.1 Oriflame Holding AG
- 11.2.1.1. Overview
- 11.2.1.2. Products
- 11.2.1.3. SWOT Analysis
- 11.2.1.4. Recent Developments
- 11.2.1.5. Financials (Based on Availability)
- 11.2.2 Mibelle Biochemistry
- 11.2.2.1. Overview
- 11.2.2.2. Products
- 11.2.2.3. SWOT Analysis
- 11.2.2.4. Recent Developments
- 11.2.2.5. Financials (Based on Availability)
- 11.2.3 Aidan Products LLC
- 11.2.3.1. Overview
- 11.2.3.2. Products
- 11.2.3.3. SWOT Analysis
- 11.2.3.4. Recent Developments
- 11.2.3.5. Financials (Based on Availability)
- 11.2.4 Phyto Science SDN BHD
- 11.2.4.1. Overview
- 11.2.4.2. Products
- 11.2.4.3. SWOT Analysis
- 11.2.4.4. Recent Developments
- 11.2.4.5. Financials (Based on Availability)
- 11.2.5 MyChelleDermaceuticals LLC
- 11.2.5.1. Overview
- 11.2.5.2. Products
- 11.2.5.3. SWOT Analysis
- 11.2.5.4. Recent Developments
- 11.2.5.5. Financials (Based on Availability)
- 11.2.6 Natura Therapeutics Inc
- 11.2.6.1. Overview
- 11.2.6.2. Products
- 11.2.6.3. SWOT Analysis
- 11.2.6.4. Recent Developments
- 11.2.6.5. Financials (Based on Availability)
- 11.2.7 Renature Skin Care Inc
- 11.2.7.1. Overview
- 11.2.7.2. Products
- 11.2.7.3. SWOT Analysis
- 11.2.7.4. Recent Developments
- 11.2.7.5. Financials (Based on Availability)
- 11.2.1 Oriflame Holding AG
List of Figures
- Figure 1: Global Global Plant Stem Cell Market Revenue Breakdown (billion, %) by Region 2025 & 2033
- Figure 2: Global Global Plant Stem Cell Market Volume Breakdown (K Unit, %) by Region 2025 & 2033
- Figure 3: North America Global Plant Stem Cell Market Revenue (billion), by Location 2025 & 2033
- Figure 4: North America Global Plant Stem Cell Market Volume (K Unit), by Location 2025 & 2033
- Figure 5: North America Global Plant Stem Cell Market Revenue Share (%), by Location 2025 & 2033
- Figure 6: North America Global Plant Stem Cell Market Volume Share (%), by Location 2025 & 2033
- Figure 7: North America Global Plant Stem Cell Market Revenue (billion), by Application 2025 & 2033
- Figure 8: North America Global Plant Stem Cell Market Volume (K Unit), by Application 2025 & 2033
- Figure 9: North America Global Plant Stem Cell Market Revenue Share (%), by Application 2025 & 2033
- Figure 10: North America Global Plant Stem Cell Market Volume Share (%), by Application 2025 & 2033
- Figure 11: North America Global Plant Stem Cell Market Revenue (billion), by Country 2025 & 2033
- Figure 12: North America Global Plant Stem Cell Market Volume (K Unit), by Country 2025 & 2033
- Figure 13: North America Global Plant Stem Cell Market Revenue Share (%), by Country 2025 & 2033
- Figure 14: North America Global Plant Stem Cell Market Volume Share (%), by Country 2025 & 2033
- Figure 15: Europe Global Plant Stem Cell Market Revenue (billion), by Location 2025 & 2033
- Figure 16: Europe Global Plant Stem Cell Market Volume (K Unit), by Location 2025 & 2033
- Figure 17: Europe Global Plant Stem Cell Market Revenue Share (%), by Location 2025 & 2033
- Figure 18: Europe Global Plant Stem Cell Market Volume Share (%), by Location 2025 & 2033
- Figure 19: Europe Global Plant Stem Cell Market Revenue (billion), by Application 2025 & 2033
- Figure 20: Europe Global Plant Stem Cell Market Volume (K Unit), by Application 2025 & 2033
- Figure 21: Europe Global Plant Stem Cell Market Revenue Share (%), by Application 2025 & 2033
- Figure 22: Europe Global Plant Stem Cell Market Volume Share (%), by Application 2025 & 2033
- Figure 23: Europe Global Plant Stem Cell Market Revenue (billion), by Country 2025 & 2033
- Figure 24: Europe Global Plant Stem Cell Market Volume (K Unit), by Country 2025 & 2033
- Figure 25: Europe Global Plant Stem Cell Market Revenue Share (%), by Country 2025 & 2033
- Figure 26: Europe Global Plant Stem Cell Market Volume Share (%), by Country 2025 & 2033
- Figure 27: Asia Pacific Global Plant Stem Cell Market Revenue (billion), by Location 2025 & 2033
- Figure 28: Asia Pacific Global Plant Stem Cell Market Volume (K Unit), by Location 2025 & 2033
- Figure 29: Asia Pacific Global Plant Stem Cell Market Revenue Share (%), by Location 2025 & 2033
- Figure 30: Asia Pacific Global Plant Stem Cell Market Volume Share (%), by Location 2025 & 2033
- Figure 31: Asia Pacific Global Plant Stem Cell Market Revenue (billion), by Application 2025 & 2033
- Figure 32: Asia Pacific Global Plant Stem Cell Market Volume (K Unit), by Application 2025 & 2033
- Figure 33: Asia Pacific Global Plant Stem Cell Market Revenue Share (%), by Application 2025 & 2033
- Figure 34: Asia Pacific Global Plant Stem Cell Market Volume Share (%), by Application 2025 & 2033
- Figure 35: Asia Pacific Global Plant Stem Cell Market Revenue (billion), by Country 2025 & 2033
- Figure 36: Asia Pacific Global Plant Stem Cell Market Volume (K Unit), by Country 2025 & 2033
- Figure 37: Asia Pacific Global Plant Stem Cell Market Revenue Share (%), by Country 2025 & 2033
- Figure 38: Asia Pacific Global Plant Stem Cell Market Volume Share (%), by Country 2025 & 2033
- Figure 39: Middle East and Africa Global Plant Stem Cell Market Revenue (billion), by Location 2025 & 2033
- Figure 40: Middle East and Africa Global Plant Stem Cell Market Volume (K Unit), by Location 2025 & 2033
- Figure 41: Middle East and Africa Global Plant Stem Cell Market Revenue Share (%), by Location 2025 & 2033
- Figure 42: Middle East and Africa Global Plant Stem Cell Market Volume Share (%), by Location 2025 & 2033
- Figure 43: Middle East and Africa Global Plant Stem Cell Market Revenue (billion), by Application 2025 & 2033
- Figure 44: Middle East and Africa Global Plant Stem Cell Market Volume (K Unit), by Application 2025 & 2033
- Figure 45: Middle East and Africa Global Plant Stem Cell Market Revenue Share (%), by Application 2025 & 2033
- Figure 46: Middle East and Africa Global Plant Stem Cell Market Volume Share (%), by Application 2025 & 2033
- Figure 47: Middle East and Africa Global Plant Stem Cell Market Revenue (billion), by Country 2025 & 2033
- Figure 48: Middle East and Africa Global Plant Stem Cell Market Volume (K Unit), by Country 2025 & 2033
- Figure 49: Middle East and Africa Global Plant Stem Cell Market Revenue Share (%), by Country 2025 & 2033
- Figure 50: Middle East and Africa Global Plant Stem Cell Market Volume Share (%), by Country 2025 & 2033
- Figure 51: South America Global Plant Stem Cell Market Revenue (billion), by Location 2025 & 2033
- Figure 52: South America Global Plant Stem Cell Market Volume (K Unit), by Location 2025 & 2033
- Figure 53: South America Global Plant Stem Cell Market Revenue Share (%), by Location 2025 & 2033
- Figure 54: South America Global Plant Stem Cell Market Volume Share (%), by Location 2025 & 2033
- Figure 55: South America Global Plant Stem Cell Market Revenue (billion), by Application 2025 & 2033
- Figure 56: South America Global Plant Stem Cell Market Volume (K Unit), by Application 2025 & 2033
- Figure 57: South America Global Plant Stem Cell Market Revenue Share (%), by Application 2025 & 2033
- Figure 58: South America Global Plant Stem Cell Market Volume Share (%), by Application 2025 & 2033
- Figure 59: South America Global Plant Stem Cell Market Revenue (billion), by Country 2025 & 2033
- Figure 60: South America Global Plant Stem Cell Market Volume (K Unit), by Country 2025 & 2033
- Figure 61: South America Global Plant Stem Cell Market Revenue Share (%), by Country 2025 & 2033
- Figure 62: South America Global Plant Stem Cell Market Volume Share (%), by Country 2025 & 2033
List of Tables
- Table 1: Global Plant Stem Cell Market Revenue billion Forecast, by Location 2020 & 2033
- Table 2: Global Plant Stem Cell Market Volume K Unit Forecast, by Location 2020 & 2033
- Table 3: Global Plant Stem Cell Market Revenue billion Forecast, by Application 2020 & 2033
- Table 4: Global Plant Stem Cell Market Volume K Unit Forecast, by Application 2020 & 2033
- Table 5: Global Plant Stem Cell Market Revenue billion Forecast, by Region 2020 & 2033
- Table 6: Global Plant Stem Cell Market Volume K Unit Forecast, by Region 2020 & 2033
- Table 7: Global Plant Stem Cell Market Revenue billion Forecast, by Location 2020 & 2033
- Table 8: Global Plant Stem Cell Market Volume K Unit Forecast, by Location 2020 & 2033
- Table 9: Global Plant Stem Cell Market Revenue billion Forecast, by Application 2020 & 2033
- Table 10: Global Plant Stem Cell Market Volume K Unit Forecast, by Application 2020 & 2033
- Table 11: Global Plant Stem Cell Market Revenue billion Forecast, by Country 2020 & 2033
- Table 12: Global Plant Stem Cell Market Volume K Unit Forecast, by Country 2020 & 2033
- Table 13: United States Global Plant Stem Cell Market Revenue (billion) Forecast, by Application 2020 & 2033
- Table 14: United States Global Plant Stem Cell Market Volume (K Unit) Forecast, by Application 2020 & 2033
- Table 15: Canada Global Plant Stem Cell Market Revenue (billion) Forecast, by Application 2020 & 2033
- Table 16: Canada Global Plant Stem Cell Market Volume (K Unit) Forecast, by Application 2020 & 2033
- Table 17: Mexico Global Plant Stem Cell Market Revenue (billion) Forecast, by Application 2020 & 2033
- Table 18: Mexico Global Plant Stem Cell Market Volume (K Unit) Forecast, by Application 2020 & 2033
- Table 19: Global Plant Stem Cell Market Revenue billion Forecast, by Location 2020 & 2033
- Table 20: Global Plant Stem Cell Market Volume K Unit Forecast, by Location 2020 & 2033
- Table 21: Global Plant Stem Cell Market Revenue billion Forecast, by Application 2020 & 2033
- Table 22: Global Plant Stem Cell Market Volume K Unit Forecast, by Application 2020 & 2033
- Table 23: Global Plant Stem Cell Market Revenue billion Forecast, by Country 2020 & 2033
- Table 24: Global Plant Stem Cell Market Volume K Unit Forecast, by Country 2020 & 2033
- Table 25: Germany Global Plant Stem Cell Market Revenue (billion) Forecast, by Application 2020 & 2033
- Table 26: Germany Global Plant Stem Cell Market Volume (K Unit) Forecast, by Application 2020 & 2033
- Table 27: United Kingdom Global Plant Stem Cell Market Revenue (billion) Forecast, by Application 2020 & 2033
- Table 28: United Kingdom Global Plant Stem Cell Market Volume (K Unit) Forecast, by Application 2020 & 2033
- Table 29: France Global Plant Stem Cell Market Revenue (billion) Forecast, by Application 2020 & 2033
- Table 30: France Global Plant Stem Cell Market Volume (K Unit) Forecast, by Application 2020 & 2033
- Table 31: Italy Global Plant Stem Cell Market Revenue (billion) Forecast, by Application 2020 & 2033
- Table 32: Italy Global Plant Stem Cell Market Volume (K Unit) Forecast, by Application 2020 & 2033
- Table 33: Spain Global Plant Stem Cell Market Revenue (billion) Forecast, by Application 2020 & 2033
- Table 34: Spain Global Plant Stem Cell Market Volume (K Unit) Forecast, by Application 2020 & 2033
- Table 35: Rest of Europe Global Plant Stem Cell Market Revenue (billion) Forecast, by Application 2020 & 2033
- Table 36: Rest of Europe Global Plant Stem Cell Market Volume (K Unit) Forecast, by Application 2020 & 2033
- Table 37: Global Plant Stem Cell Market Revenue billion Forecast, by Location 2020 & 2033
- Table 38: Global Plant Stem Cell Market Volume K Unit Forecast, by Location 2020 & 2033
- Table 39: Global Plant Stem Cell Market Revenue billion Forecast, by Application 2020 & 2033
- Table 40: Global Plant Stem Cell Market Volume K Unit Forecast, by Application 2020 & 2033
- Table 41: Global Plant Stem Cell Market Revenue billion Forecast, by Country 2020 & 2033
- Table 42: Global Plant Stem Cell Market Volume K Unit Forecast, by Country 2020 & 2033
- Table 43: China Global Plant Stem Cell Market Revenue (billion) Forecast, by Application 2020 & 2033
- Table 44: China Global Plant Stem Cell Market Volume (K Unit) Forecast, by Application 2020 & 2033
- Table 45: Japan Global Plant Stem Cell Market Revenue (billion) Forecast, by Application 2020 & 2033
- Table 46: Japan Global Plant Stem Cell Market Volume (K Unit) Forecast, by Application 2020 & 2033
- Table 47: India Global Plant Stem Cell Market Revenue (billion) Forecast, by Application 2020 & 2033
- Table 48: India Global Plant Stem Cell Market Volume (K Unit) Forecast, by Application 2020 & 2033
- Table 49: Australia Global Plant Stem Cell Market Revenue (billion) Forecast, by Application 2020 & 2033
- Table 50: Australia Global Plant Stem Cell Market Volume (K Unit) Forecast, by Application 2020 & 2033
- Table 51: South Korea Global Plant Stem Cell Market Revenue (billion) Forecast, by Application 2020 & 2033
- Table 52: South Korea Global Plant Stem Cell Market Volume (K Unit) Forecast, by Application 2020 & 2033
- Table 53: Rest of Asia Pacific Global Plant Stem Cell Market Revenue (billion) Forecast, by Application 2020 & 2033
- Table 54: Rest of Asia Pacific Global Plant Stem Cell Market Volume (K Unit) Forecast, by Application 2020 & 2033
- Table 55: Global Plant Stem Cell Market Revenue billion Forecast, by Location 2020 & 2033
- Table 56: Global Plant Stem Cell Market Volume K Unit Forecast, by Location 2020 & 2033
- Table 57: Global Plant Stem Cell Market Revenue billion Forecast, by Application 2020 & 2033
- Table 58: Global Plant Stem Cell Market Volume K Unit Forecast, by Application 2020 & 2033
- Table 59: Global Plant Stem Cell Market Revenue billion Forecast, by Country 2020 & 2033
- Table 60: Global Plant Stem Cell Market Volume K Unit Forecast, by Country 2020 & 2033
- Table 61: GCC Global Plant Stem Cell Market Revenue (billion) Forecast, by Application 2020 & 2033
- Table 62: GCC Global Plant Stem Cell Market Volume (K Unit) Forecast, by Application 2020 & 2033
- Table 63: South Africa Global Plant Stem Cell Market Revenue (billion) Forecast, by Application 2020 & 2033
- Table 64: South Africa Global Plant Stem Cell Market Volume (K Unit) Forecast, by Application 2020 & 2033
- Table 65: Rest of Middle East and Africa Global Plant Stem Cell Market Revenue (billion) Forecast, by Application 2020 & 2033
- Table 66: Rest of Middle East and Africa Global Plant Stem Cell Market Volume (K Unit) Forecast, by Application 2020 & 2033
- Table 67: Global Plant Stem Cell Market Revenue billion Forecast, by Location 2020 & 2033
- Table 68: Global Plant Stem Cell Market Volume K Unit Forecast, by Location 2020 & 2033
- Table 69: Global Plant Stem Cell Market Revenue billion Forecast, by Application 2020 & 2033
- Table 70: Global Plant Stem Cell Market Volume K Unit Forecast, by Application 2020 & 2033
- Table 71: Global Plant Stem Cell Market Revenue billion Forecast, by Country 2020 & 2033
- Table 72: Global Plant Stem Cell Market Volume K Unit Forecast, by Country 2020 & 2033
- Table 73: Brazil Global Plant Stem Cell Market Revenue (billion) Forecast, by Application 2020 & 2033
- Table 74: Brazil Global Plant Stem Cell Market Volume (K Unit) Forecast, by Application 2020 & 2033
- Table 75: Argentina Global Plant Stem Cell Market Revenue (billion) Forecast, by Application 2020 & 2033
- Table 76: Argentina Global Plant Stem Cell Market Volume (K Unit) Forecast, by Application 2020 & 2033
- Table 77: Rest of South America Global Plant Stem Cell Market Revenue (billion) Forecast, by Application 2020 & 2033
- Table 78: Rest of South America Global Plant Stem Cell Market Volume (K Unit) Forecast, by Application 2020 & 2033
Frequently Asked Questions
1. What is the projected Compound Annual Growth Rate (CAGR) of the Global Plant Stem Cell Market?
The projected CAGR is approximately 8.5%.
2. Which companies are prominent players in the Global Plant Stem Cell Market?
Key companies in the market include Oriflame Holding AG, Mibelle Biochemistry, Aidan Products LLC, Phyto Science SDN BHD, MyChelleDermaceuticals LLC, Natura Therapeutics Inc, Renature Skin Care Inc .
3. What are the main segments of the Global Plant Stem Cell Market?
The market segments include Location, Application.
4. Can you provide details about the market size?
The market size is estimated to be USD 5.01 billion as of 2022.
5. What are some drivers contributing to market growth?
Rising Demand for Plant Stem Cells in the Cosmetic Industry; Increased Product Launches with Plant Stem Cells.
6. What are the notable trends driving market growth?
Cosmetic by Application Segment is Expected to Dominate the Market Over the Forecast Period.
7. Are there any restraints impacting market growth?
High Operational Cost with the Extracting and Manufacturing of Plant Stem Cell.
8. Can you provide examples of recent developments in the market?
In April 2022, Frownies, a natural skincare company, released a new skin-renewing apple serum that uses plant-based stem cell technology. These stem cells have been found to offer numerous skin benefits, particularly around the eyes and lips. On the Frownies website, the newest skin serum is now available.
9. What pricing options are available for accessing the report?
Pricing options include single-user, multi-user, and enterprise licenses priced at USD 4750, USD 5250, and USD 8750 respectively.
10. Is the market size provided in terms of value or volume?
The market size is provided in terms of value, measured in billion and volume, measured in K Unit.
11. Are there any specific market keywords associated with the report?
Yes, the market keyword associated with the report is "Global Plant Stem Cell Market," which aids in identifying and referencing the specific market segment covered.
12. How do I determine which pricing option suits my needs best?
The pricing options vary based on user requirements and access needs. Individual users may opt for single-user licenses, while businesses requiring broader access may choose multi-user or enterprise licenses for cost-effective access to the report.
13. Are there any additional resources or data provided in the Global Plant Stem Cell Market report?
While the report offers comprehensive insights, it's advisable to review the specific contents or supplementary materials provided to ascertain if additional resources or data are available.
14. How can I stay updated on further developments or reports in the Global Plant Stem Cell Market?
To stay informed about further developments, trends, and reports in the Global Plant Stem Cell Market, consider subscribing to industry newsletters, following relevant companies and organizations, or regularly checking reputable industry news sources and publications.
Methodology
Step 1 - Identification of Relevant Samples Size from Population Database


Step 2 - Approaches for Defining Global Market Size (Value, Volume* & Price*)

Note*: In applicable scenarios
Step 3 - Data Sources
Primary Research
- Web Analytics
- Survey Reports
- Research Institute
- Latest Research Reports
- Opinion Leaders
Secondary Research
- Annual Reports
- White Paper
- Latest Press Release
- Industry Association
- Paid Database
- Investor Presentations

Step 4 - Data Triangulation
Involves using different sources of information in order to increase the validity of a study
These sources are likely to be stakeholders in a program - participants, other researchers, program staff, other community members, and so on.
Then we put all data in single framework & apply various statistical tools to find out the dynamic on the market.
During the analysis stage, feedback from the stakeholder groups would be compared to determine areas of agreement as well as areas of divergence