
Key Insights
The global Patient-Derived Xenograft (PDX) models market is experiencing robust growth, driven by the increasing demand for personalized medicine and the rising prevalence of various cancers. The market's Compound Annual Growth Rate (CAGR) of 12.5% from 2019 to 2024 suggests a significant expansion, projecting a substantial market size by 2033. Key drivers include the growing need for accurate preclinical drug testing, the limitations of traditional in vitro and in vivo models, and the increasing adoption of PDX models in oncology drug development. The market segmentation reveals a significant focus on Gastrointestinal, Gynecological, and Respiratory tumor models, reflecting the high incidence rates of these cancers. Pharmaceutical and biotechnology companies are the primary end-users, actively incorporating PDX models into their research and development pipelines. The high cost of generating and maintaining PDX models is a significant restraint, limiting broader adoption in smaller research institutions. However, technological advancements in PDX model development and increasing collaborations between research institutions and pharmaceutical companies are expected to mitigate this constraint in the coming years. Geographic distribution shows a strong presence in North America and Europe, which currently represent a large proportion of the market share. However, the Asia-Pacific region, particularly China and India, is anticipated to witness significant growth, fueled by burgeoning healthcare infrastructure and rising investments in research and development.
The competitive landscape comprises both established players like Charles River Laboratories and newer entrants, indicating a dynamic market with ongoing innovation. Future growth will be influenced by factors such as the development of novel PDX model technologies, the increasing adoption of precision medicine strategies, and the evolving regulatory landscape. The expansion of PDX applications beyond oncology towards other therapeutic areas like immunology and infectious diseases is expected to further propel market growth in the long term. Therefore, a sustained CAGR in the coming years is highly probable, driven by continuous advances in technology and increasing recognition of PDX models' value in drug discovery and development. Furthermore, strategic partnerships and collaborations between research institutions and industry stakeholders will play a crucial role in shaping the future growth trajectory of this promising market.
This comprehensive report provides an in-depth analysis of the global Patient Derived Xenograft (PDX) models market, encompassing market dynamics, growth trends, regional analysis, competitive landscape, and future outlook. The report covers the parent market of in-vitro diagnostics and the child market of preclinical drug development, offering a holistic perspective on this rapidly evolving sector. The study period spans from 2019 to 2033, with a base year of 2025 and a forecast period from 2025 to 2033. The historical period covered is 2019-2024. The market size is presented in Million units.
Global Patient Derived Xenograft Models Market Dynamics & Structure
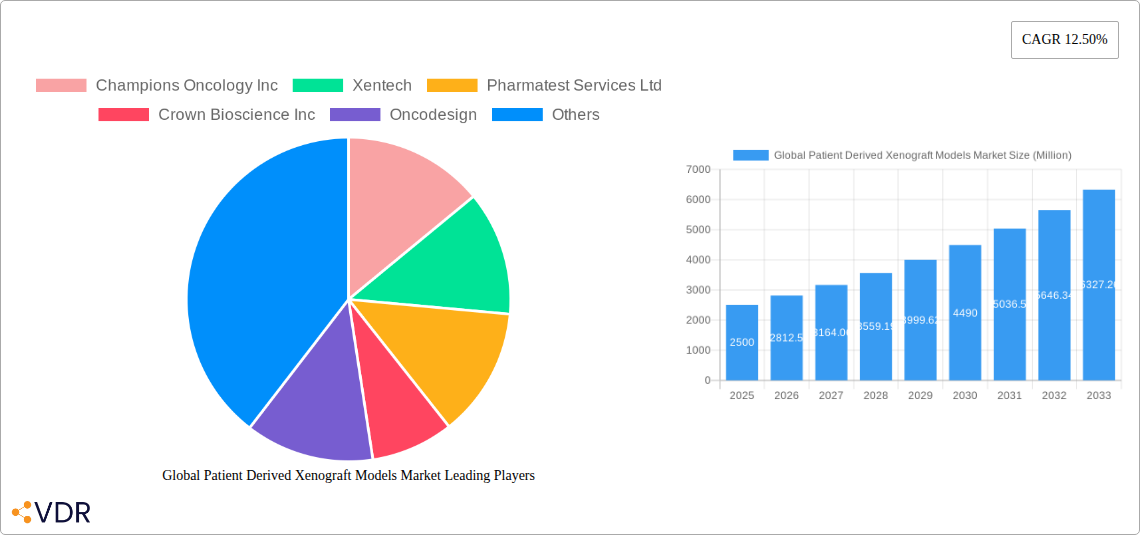
The global Patient Derived Xenograft (PDX) models market is characterized by a moderately concentrated landscape, with key players such as Champions Oncology Inc, Xentech, Pharmatest Services Ltd, Crown Bioscience Inc, Oncodesign, EPO Berlin-Buch GmbH, Charles River Laboratories Inc, Urolead, and Hera BioLabs driving innovation and competition. Market concentration is estimated at xx%, with the top 5 players holding approximately xx% market share in 2025.
Technological advancements, particularly in CRISPR gene editing and next-generation sequencing, are key drivers of market growth. Stringent regulatory frameworks governing preclinical research influence market development, while the availability of alternative preclinical models presents competitive pressure. The primary end-users are pharmaceutical and biotechnology companies, followed by academic and research institutions.
- Market Concentration: xx% in 2025 (Top 5 players)
- Technological Innovation: CRISPR gene editing, Next-Generation Sequencing
- Regulatory Landscape: Stringent guidelines influencing model development and validation.
- Competitive Substitutes: In-vitro cell culture models, other animal models
- M&A Activity: xx deals recorded between 2019-2024, with an average deal value of xx Million.
- Innovation Barriers: High cost of model development and validation, limited access to patient samples.
Global Patient Derived Xenograft Models Market Growth Trends & Insights
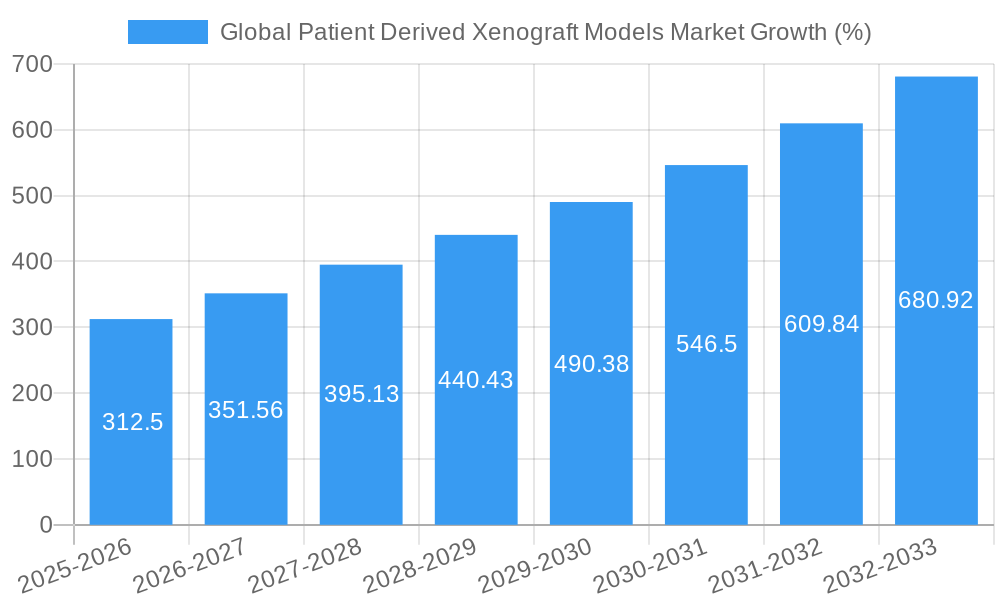
The global PDX models market is experiencing robust growth, driven by the increasing demand for personalized medicine and the need for accurate preclinical models to predict drug efficacy and toxicity in humans. The market size is projected to reach xx Million by 2033, exhibiting a CAGR of xx% during the forecast period. Adoption rates are increasing due to improved model fidelity and the growing recognition of PDX models' superiority over traditional cell lines in preclinical drug development. Technological advancements are further accelerating market growth by enabling the creation of more sophisticated and customized models. Shifts in consumer behavior, reflected in the increased emphasis on personalized medicine by both patients and clinicians, are further propelling market demand. Market penetration is estimated at xx% in 2025.
Dominant Regions, Countries, or Segments in Global Patient Derived Xenograft Models Market
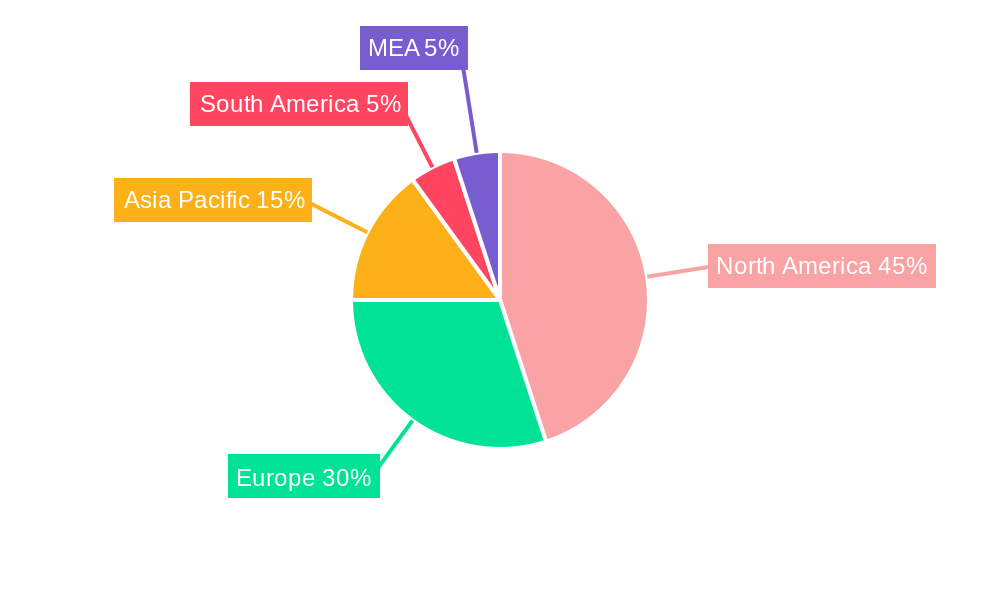
North America currently dominates the global PDX models market, holding approximately xx% market share in 2025, followed by Europe with xx%. This dominance is primarily attributed to the robust presence of pharmaceutical and biotechnology companies, a well-established research infrastructure, and substantial funding for preclinical research.
Within the market segmentation, the Mice Model segment holds the largest share, accounting for approximately xx% in 2025, due to wider availability and ease of handling compared to other models. Within tumor types, the Gastrointestinal Tumor Model segment leads, reflecting the high incidence of gastrointestinal cancers. The Pharmaceutical & Biotechnology Companies segment is the dominant end-user, representing xx% of the market in 2025.
- Key Drivers in North America: Strong pharmaceutical and biotech industries, robust research funding.
- Key Drivers in Europe: Growing focus on personalized medicine, increasing government support for research.
- Mice Model Dominance: Wider availability, cost-effectiveness, ease of genetic manipulation.
- Gastrointestinal Tumor Model Dominance: High prevalence of gastrointestinal cancers.
- Pharmaceutical & Biotech End-User Dominance: High demand for accurate preclinical models.
Global Patient Derived Xenograft Models Market Product Landscape
PDX models offer significant advantages over traditional preclinical models, providing improved prediction of drug response and minimizing the gap between preclinical and clinical outcomes. Continuous innovations focus on enhancing model fidelity, including the incorporation of immune components and the development of patient-specific models, reflecting personalized medicine’s growing influence. Recent advancements in gene editing technologies allow for greater customization and creation of disease-specific models. Unique selling propositions (USPs) lie in their ability to accurately represent human tumor heterogeneity and drug response.
Key Drivers, Barriers & Challenges in Global Patient Derived Xenograft Models Market
Key Drivers:
- Increasing demand for personalized medicine.
- Growing need for accurate preclinical models.
- Technological advancements (e.g., CRISPR-Cas9, next-generation sequencing).
- Increased funding for cancer research.
Key Barriers and Challenges:
- High cost of model development and validation.
- Complex regulatory hurdles related to obtaining patient consent and handling sensitive patient data.
- Ethical considerations surrounding the use of animal models.
- Limited availability of high-quality patient samples.
- Competition from alternative preclinical models.
Emerging Opportunities in Global Patient Derived Xenograft Models Market
Emerging opportunities include the expansion into new therapeutic areas beyond oncology, the development of more sophisticated models incorporating the tumor microenvironment, and the increasing use of PDX models in combination with other technologies, such as artificial intelligence and machine learning, for drug discovery and development. Untapped markets exist in emerging economies with growing healthcare infrastructure.
Growth Accelerators in the Global Patient Derived Xenograft Models Market Industry
Long-term growth will be driven by technological breakthroughs in model development, strategic partnerships between pharmaceutical companies and research institutions, and expansion into new geographic markets. Increasing adoption of personalized medicine and the continuing evolution of preclinical drug development methodologies will further propel market growth.
Key Players Shaping the Global Patient Derived Xenograft Models Market Market
- Champions Oncology Inc
- Xentech
- Pharmatest Services Ltd
- Crown Bioscience Inc
- Oncodesign
- EPO Berlin-Buch GmbH
- Charles River Laboratories Inc
- Urolead
- Hera BioLabs
Notable Milestones in Global Patient Derived Xenograft Models Market Sector
- July 2022: GemPharmatech and Charles River Laboratories announced a strategic license agreement for the distribution of next-generation NOD CRISPR Prkdc Il2r gamma (NCG) mouse lines in North America, expanding the availability of advanced PDX models.
- April 2022: Niigata University researchers established a novel pancreatic carcinogenesis model in wild-type rats, contributing to the development of improved preclinical models for pancreatic cancer.
In-Depth Global Patient Derived Xenograft Models Market Market Outlook
The future of the PDX models market is bright, with continued growth driven by technological innovation, increased adoption by pharmaceutical and biotech companies, and the expanding demand for personalized medicine. Strategic partnerships and collaborations will play a key role in shaping the market landscape. The market holds significant potential for growth in emerging markets and therapeutic areas, creating promising opportunities for market entrants and established players alike.
Global Patient Derived Xenograft Models Market Segmentation
-
1. Type
- 1.1. Mice Model
- 1.2. Rats Model
-
2. Tumor Type
- 2.1. Gastrointestinal Tumor Model
- 2.2. Gynecological Tumor Model
- 2.3. Respiratory Tumor Model
- 2.4. Other Tumor Model
-
3. End User
- 3.1. Pharmaceutical & Biotechnology Companies
- 3.2. Academic & Research Institutions
- 3.3. Others
Global Patient Derived Xenograft Models Market Segmentation By Geography
-
1. North America
- 1.1. United States
- 1.2. Canada
- 1.3. Mexico
-
2. Europe
- 2.1. Germany
- 2.2. United Kingdom
- 2.3. France
- 2.4. Italy
- 2.5. Spain
- 2.6. Rest of Europe
-
3. Asia Pacific
- 3.1. China
- 3.2. Japan
- 3.3. India
- 3.4. Australia
- 3.5. South Korea
- 3.6. Rest of Asia Pacific
- 4. Rest of the World
Global Patient Derived Xenograft Models Market REPORT HIGHLIGHTS
| Aspects | Details |
|---|---|
| Study Period | 2019-2033 |
| Base Year | 2024 |
| Estimated Year | 2025 |
| Forecast Period | 2025-2033 |
| Historical Period | 2019-2024 |
| Growth Rate | CAGR of 12.50% from 2019-2033 |
| Segmentation |
|
Table of Contents
- 1. Introduction
- 1.1. Research Scope
- 1.2. Market Segmentation
- 1.3. Research Methodology
- 1.4. Definitions and Assumptions
- 2. Executive Summary
- 2.1. Introduction
- 3. Market Dynamics
- 3.1. Introduction
- 3.2. Market Drivers
- 3.2.1. Rising Cases of Cancer; Rising R&D Activities in the Pharmaceutical Industry; Continuous Support for Cancer Research From Public as Well as Private Sector
- 3.3. Market Restrains
- 3.3.1. High Cost of Personalized Patient Derived Xenograft Models; Stringent Regulations Towards Use of Animals Models
- 3.4. Market Trends
- 3.4.1. Mice Model Segment is Expected to Witness Growth Over the Forecast Period
- 4. Market Factor Analysis
- 4.1. Porters Five Forces
- 4.2. Supply/Value Chain
- 4.3. PESTEL analysis
- 4.4. Market Entropy
- 4.5. Patent/Trademark Analysis
- 5. Global Patient Derived Xenograft Models Market Analysis, Insights and Forecast, 2019-2031
- 5.1. Market Analysis, Insights and Forecast - by Type
- 5.1.1. Mice Model
- 5.1.2. Rats Model
- 5.2. Market Analysis, Insights and Forecast - by Tumor Type
- 5.2.1. Gastrointestinal Tumor Model
- 5.2.2. Gynecological Tumor Model
- 5.2.3. Respiratory Tumor Model
- 5.2.4. Other Tumor Model
- 5.3. Market Analysis, Insights and Forecast - by End User
- 5.3.1. Pharmaceutical & Biotechnology Companies
- 5.3.2. Academic & Research Institutions
- 5.3.3. Others
- 5.4. Market Analysis, Insights and Forecast - by Region
- 5.4.1. North America
- 5.4.2. Europe
- 5.4.3. Asia Pacific
- 5.4.4. Rest of the World
- 5.1. Market Analysis, Insights and Forecast - by Type
- 6. North America Global Patient Derived Xenograft Models Market Analysis, Insights and Forecast, 2019-2031
- 6.1. Market Analysis, Insights and Forecast - by Type
- 6.1.1. Mice Model
- 6.1.2. Rats Model
- 6.2. Market Analysis, Insights and Forecast - by Tumor Type
- 6.2.1. Gastrointestinal Tumor Model
- 6.2.2. Gynecological Tumor Model
- 6.2.3. Respiratory Tumor Model
- 6.2.4. Other Tumor Model
- 6.3. Market Analysis, Insights and Forecast - by End User
- 6.3.1. Pharmaceutical & Biotechnology Companies
- 6.3.2. Academic & Research Institutions
- 6.3.3. Others
- 6.1. Market Analysis, Insights and Forecast - by Type
- 7. Europe Global Patient Derived Xenograft Models Market Analysis, Insights and Forecast, 2019-2031
- 7.1. Market Analysis, Insights and Forecast - by Type
- 7.1.1. Mice Model
- 7.1.2. Rats Model
- 7.2. Market Analysis, Insights and Forecast - by Tumor Type
- 7.2.1. Gastrointestinal Tumor Model
- 7.2.2. Gynecological Tumor Model
- 7.2.3. Respiratory Tumor Model
- 7.2.4. Other Tumor Model
- 7.3. Market Analysis, Insights and Forecast - by End User
- 7.3.1. Pharmaceutical & Biotechnology Companies
- 7.3.2. Academic & Research Institutions
- 7.3.3. Others
- 7.1. Market Analysis, Insights and Forecast - by Type
- 8. Asia Pacific Global Patient Derived Xenograft Models Market Analysis, Insights and Forecast, 2019-2031
- 8.1. Market Analysis, Insights and Forecast - by Type
- 8.1.1. Mice Model
- 8.1.2. Rats Model
- 8.2. Market Analysis, Insights and Forecast - by Tumor Type
- 8.2.1. Gastrointestinal Tumor Model
- 8.2.2. Gynecological Tumor Model
- 8.2.3. Respiratory Tumor Model
- 8.2.4. Other Tumor Model
- 8.3. Market Analysis, Insights and Forecast - by End User
- 8.3.1. Pharmaceutical & Biotechnology Companies
- 8.3.2. Academic & Research Institutions
- 8.3.3. Others
- 8.1. Market Analysis, Insights and Forecast - by Type
- 9. Rest of the World Global Patient Derived Xenograft Models Market Analysis, Insights and Forecast, 2019-2031
- 9.1. Market Analysis, Insights and Forecast - by Type
- 9.1.1. Mice Model
- 9.1.2. Rats Model
- 9.2. Market Analysis, Insights and Forecast - by Tumor Type
- 9.2.1. Gastrointestinal Tumor Model
- 9.2.2. Gynecological Tumor Model
- 9.2.3. Respiratory Tumor Model
- 9.2.4. Other Tumor Model
- 9.3. Market Analysis, Insights and Forecast - by End User
- 9.3.1. Pharmaceutical & Biotechnology Companies
- 9.3.2. Academic & Research Institutions
- 9.3.3. Others
- 9.1. Market Analysis, Insights and Forecast - by Type
- 10. North America Global Patient Derived Xenograft Models Market Analysis, Insights and Forecast, 2019-2031
- 10.1. Market Analysis, Insights and Forecast - By Country/Sub-region
- 10.1.1 United States
- 10.1.2 Canada
- 10.1.3 Mexico
- 11. Europe Global Patient Derived Xenograft Models Market Analysis, Insights and Forecast, 2019-2031
- 11.1. Market Analysis, Insights and Forecast - By Country/Sub-region
- 11.1.1 Germany
- 11.1.2 United Kingdom
- 11.1.3 France
- 11.1.4 Spain
- 11.1.5 Italy
- 11.1.6 Spain
- 11.1.7 Belgium
- 11.1.8 Netherland
- 11.1.9 Nordics
- 11.1.10 Rest of Europe
- 12. Asia Pacific Global Patient Derived Xenograft Models Market Analysis, Insights and Forecast, 2019-2031
- 12.1. Market Analysis, Insights and Forecast - By Country/Sub-region
- 12.1.1 China
- 12.1.2 Japan
- 12.1.3 India
- 12.1.4 South Korea
- 12.1.5 Southeast Asia
- 12.1.6 Australia
- 12.1.7 Indonesia
- 12.1.8 Phillipes
- 12.1.9 Singapore
- 12.1.10 Thailandc
- 12.1.11 Rest of Asia Pacific
- 13. South America Global Patient Derived Xenograft Models Market Analysis, Insights and Forecast, 2019-2031
- 13.1. Market Analysis, Insights and Forecast - By Country/Sub-region
- 13.1.1 Brazil
- 13.1.2 Argentina
- 13.1.3 Peru
- 13.1.4 Chile
- 13.1.5 Colombia
- 13.1.6 Ecuador
- 13.1.7 Venezuela
- 13.1.8 Rest of South America
- 14. MEA Global Patient Derived Xenograft Models Market Analysis, Insights and Forecast, 2019-2031
- 14.1. Market Analysis, Insights and Forecast - By Country/Sub-region
- 14.1.1 United Arab Emirates
- 14.1.2 Saudi Arabia
- 14.1.3 South Africa
- 14.1.4 Rest of Middle East and Africa
- 15. Competitive Analysis
- 15.1. Market Share Analysis 2024
- 15.2. Company Profiles
- 15.2.1 Champions Oncology Inc
- 15.2.1.1. Overview
- 15.2.1.2. Products
- 15.2.1.3. SWOT Analysis
- 15.2.1.4. Recent Developments
- 15.2.1.5. Financials (Based on Availability)
- 15.2.2 Xentech
- 15.2.2.1. Overview
- 15.2.2.2. Products
- 15.2.2.3. SWOT Analysis
- 15.2.2.4. Recent Developments
- 15.2.2.5. Financials (Based on Availability)
- 15.2.3 Pharmatest Services Ltd
- 15.2.3.1. Overview
- 15.2.3.2. Products
- 15.2.3.3. SWOT Analysis
- 15.2.3.4. Recent Developments
- 15.2.3.5. Financials (Based on Availability)
- 15.2.4 Crown Bioscience Inc
- 15.2.4.1. Overview
- 15.2.4.2. Products
- 15.2.4.3. SWOT Analysis
- 15.2.4.4. Recent Developments
- 15.2.4.5. Financials (Based on Availability)
- 15.2.5 Oncodesign
- 15.2.5.1. Overview
- 15.2.5.2. Products
- 15.2.5.3. SWOT Analysis
- 15.2.5.4. Recent Developments
- 15.2.5.5. Financials (Based on Availability)
- 15.2.6 EPO Berlin-Buch GmbH
- 15.2.6.1. Overview
- 15.2.6.2. Products
- 15.2.6.3. SWOT Analysis
- 15.2.6.4. Recent Developments
- 15.2.6.5. Financials (Based on Availability)
- 15.2.7 Charles River Laboratories Inc
- 15.2.7.1. Overview
- 15.2.7.2. Products
- 15.2.7.3. SWOT Analysis
- 15.2.7.4. Recent Developments
- 15.2.7.5. Financials (Based on Availability)
- 15.2.8 Urolead
- 15.2.8.1. Overview
- 15.2.8.2. Products
- 15.2.8.3. SWOT Analysis
- 15.2.8.4. Recent Developments
- 15.2.8.5. Financials (Based on Availability)
- 15.2.9 Hera BioLabs
- 15.2.9.1. Overview
- 15.2.9.2. Products
- 15.2.9.3. SWOT Analysis
- 15.2.9.4. Recent Developments
- 15.2.9.5. Financials (Based on Availability)
- 15.2.1 Champions Oncology Inc
List of Figures
- Figure 1: Global Global Patient Derived Xenograft Models Market Revenue Breakdown (Million, %) by Region 2024 & 2032
- Figure 2: North America Global Patient Derived Xenograft Models Market Revenue (Million), by Country 2024 & 2032
- Figure 3: North America Global Patient Derived Xenograft Models Market Revenue Share (%), by Country 2024 & 2032
- Figure 4: Europe Global Patient Derived Xenograft Models Market Revenue (Million), by Country 2024 & 2032
- Figure 5: Europe Global Patient Derived Xenograft Models Market Revenue Share (%), by Country 2024 & 2032
- Figure 6: Asia Pacific Global Patient Derived Xenograft Models Market Revenue (Million), by Country 2024 & 2032
- Figure 7: Asia Pacific Global Patient Derived Xenograft Models Market Revenue Share (%), by Country 2024 & 2032
- Figure 8: South America Global Patient Derived Xenograft Models Market Revenue (Million), by Country 2024 & 2032
- Figure 9: South America Global Patient Derived Xenograft Models Market Revenue Share (%), by Country 2024 & 2032
- Figure 10: MEA Global Patient Derived Xenograft Models Market Revenue (Million), by Country 2024 & 2032
- Figure 11: MEA Global Patient Derived Xenograft Models Market Revenue Share (%), by Country 2024 & 2032
- Figure 12: North America Global Patient Derived Xenograft Models Market Revenue (Million), by Type 2024 & 2032
- Figure 13: North America Global Patient Derived Xenograft Models Market Revenue Share (%), by Type 2024 & 2032
- Figure 14: North America Global Patient Derived Xenograft Models Market Revenue (Million), by Tumor Type 2024 & 2032
- Figure 15: North America Global Patient Derived Xenograft Models Market Revenue Share (%), by Tumor Type 2024 & 2032
- Figure 16: North America Global Patient Derived Xenograft Models Market Revenue (Million), by End User 2024 & 2032
- Figure 17: North America Global Patient Derived Xenograft Models Market Revenue Share (%), by End User 2024 & 2032
- Figure 18: North America Global Patient Derived Xenograft Models Market Revenue (Million), by Country 2024 & 2032
- Figure 19: North America Global Patient Derived Xenograft Models Market Revenue Share (%), by Country 2024 & 2032
- Figure 20: Europe Global Patient Derived Xenograft Models Market Revenue (Million), by Type 2024 & 2032
- Figure 21: Europe Global Patient Derived Xenograft Models Market Revenue Share (%), by Type 2024 & 2032
- Figure 22: Europe Global Patient Derived Xenograft Models Market Revenue (Million), by Tumor Type 2024 & 2032
- Figure 23: Europe Global Patient Derived Xenograft Models Market Revenue Share (%), by Tumor Type 2024 & 2032
- Figure 24: Europe Global Patient Derived Xenograft Models Market Revenue (Million), by End User 2024 & 2032
- Figure 25: Europe Global Patient Derived Xenograft Models Market Revenue Share (%), by End User 2024 & 2032
- Figure 26: Europe Global Patient Derived Xenograft Models Market Revenue (Million), by Country 2024 & 2032
- Figure 27: Europe Global Patient Derived Xenograft Models Market Revenue Share (%), by Country 2024 & 2032
- Figure 28: Asia Pacific Global Patient Derived Xenograft Models Market Revenue (Million), by Type 2024 & 2032
- Figure 29: Asia Pacific Global Patient Derived Xenograft Models Market Revenue Share (%), by Type 2024 & 2032
- Figure 30: Asia Pacific Global Patient Derived Xenograft Models Market Revenue (Million), by Tumor Type 2024 & 2032
- Figure 31: Asia Pacific Global Patient Derived Xenograft Models Market Revenue Share (%), by Tumor Type 2024 & 2032
- Figure 32: Asia Pacific Global Patient Derived Xenograft Models Market Revenue (Million), by End User 2024 & 2032
- Figure 33: Asia Pacific Global Patient Derived Xenograft Models Market Revenue Share (%), by End User 2024 & 2032
- Figure 34: Asia Pacific Global Patient Derived Xenograft Models Market Revenue (Million), by Country 2024 & 2032
- Figure 35: Asia Pacific Global Patient Derived Xenograft Models Market Revenue Share (%), by Country 2024 & 2032
- Figure 36: Rest of the World Global Patient Derived Xenograft Models Market Revenue (Million), by Type 2024 & 2032
- Figure 37: Rest of the World Global Patient Derived Xenograft Models Market Revenue Share (%), by Type 2024 & 2032
- Figure 38: Rest of the World Global Patient Derived Xenograft Models Market Revenue (Million), by Tumor Type 2024 & 2032
- Figure 39: Rest of the World Global Patient Derived Xenograft Models Market Revenue Share (%), by Tumor Type 2024 & 2032
- Figure 40: Rest of the World Global Patient Derived Xenograft Models Market Revenue (Million), by End User 2024 & 2032
- Figure 41: Rest of the World Global Patient Derived Xenograft Models Market Revenue Share (%), by End User 2024 & 2032
- Figure 42: Rest of the World Global Patient Derived Xenograft Models Market Revenue (Million), by Country 2024 & 2032
- Figure 43: Rest of the World Global Patient Derived Xenograft Models Market Revenue Share (%), by Country 2024 & 2032
List of Tables
- Table 1: Global Patient Derived Xenograft Models Market Revenue Million Forecast, by Region 2019 & 2032
- Table 2: Global Patient Derived Xenograft Models Market Revenue Million Forecast, by Type 2019 & 2032
- Table 3: Global Patient Derived Xenograft Models Market Revenue Million Forecast, by Tumor Type 2019 & 2032
- Table 4: Global Patient Derived Xenograft Models Market Revenue Million Forecast, by End User 2019 & 2032
- Table 5: Global Patient Derived Xenograft Models Market Revenue Million Forecast, by Region 2019 & 2032
- Table 6: Global Patient Derived Xenograft Models Market Revenue Million Forecast, by Country 2019 & 2032
- Table 7: United States Global Patient Derived Xenograft Models Market Revenue (Million) Forecast, by Application 2019 & 2032
- Table 8: Canada Global Patient Derived Xenograft Models Market Revenue (Million) Forecast, by Application 2019 & 2032
- Table 9: Mexico Global Patient Derived Xenograft Models Market Revenue (Million) Forecast, by Application 2019 & 2032
- Table 10: Global Patient Derived Xenograft Models Market Revenue Million Forecast, by Country 2019 & 2032
- Table 11: Germany Global Patient Derived Xenograft Models Market Revenue (Million) Forecast, by Application 2019 & 2032
- Table 12: United Kingdom Global Patient Derived Xenograft Models Market Revenue (Million) Forecast, by Application 2019 & 2032
- Table 13: France Global Patient Derived Xenograft Models Market Revenue (Million) Forecast, by Application 2019 & 2032
- Table 14: Spain Global Patient Derived Xenograft Models Market Revenue (Million) Forecast, by Application 2019 & 2032
- Table 15: Italy Global Patient Derived Xenograft Models Market Revenue (Million) Forecast, by Application 2019 & 2032
- Table 16: Spain Global Patient Derived Xenograft Models Market Revenue (Million) Forecast, by Application 2019 & 2032
- Table 17: Belgium Global Patient Derived Xenograft Models Market Revenue (Million) Forecast, by Application 2019 & 2032
- Table 18: Netherland Global Patient Derived Xenograft Models Market Revenue (Million) Forecast, by Application 2019 & 2032
- Table 19: Nordics Global Patient Derived Xenograft Models Market Revenue (Million) Forecast, by Application 2019 & 2032
- Table 20: Rest of Europe Global Patient Derived Xenograft Models Market Revenue (Million) Forecast, by Application 2019 & 2032
- Table 21: Global Patient Derived Xenograft Models Market Revenue Million Forecast, by Country 2019 & 2032
- Table 22: China Global Patient Derived Xenograft Models Market Revenue (Million) Forecast, by Application 2019 & 2032
- Table 23: Japan Global Patient Derived Xenograft Models Market Revenue (Million) Forecast, by Application 2019 & 2032
- Table 24: India Global Patient Derived Xenograft Models Market Revenue (Million) Forecast, by Application 2019 & 2032
- Table 25: South Korea Global Patient Derived Xenograft Models Market Revenue (Million) Forecast, by Application 2019 & 2032
- Table 26: Southeast Asia Global Patient Derived Xenograft Models Market Revenue (Million) Forecast, by Application 2019 & 2032
- Table 27: Australia Global Patient Derived Xenograft Models Market Revenue (Million) Forecast, by Application 2019 & 2032
- Table 28: Indonesia Global Patient Derived Xenograft Models Market Revenue (Million) Forecast, by Application 2019 & 2032
- Table 29: Phillipes Global Patient Derived Xenograft Models Market Revenue (Million) Forecast, by Application 2019 & 2032
- Table 30: Singapore Global Patient Derived Xenograft Models Market Revenue (Million) Forecast, by Application 2019 & 2032
- Table 31: Thailandc Global Patient Derived Xenograft Models Market Revenue (Million) Forecast, by Application 2019 & 2032
- Table 32: Rest of Asia Pacific Global Patient Derived Xenograft Models Market Revenue (Million) Forecast, by Application 2019 & 2032
- Table 33: Global Patient Derived Xenograft Models Market Revenue Million Forecast, by Country 2019 & 2032
- Table 34: Brazil Global Patient Derived Xenograft Models Market Revenue (Million) Forecast, by Application 2019 & 2032
- Table 35: Argentina Global Patient Derived Xenograft Models Market Revenue (Million) Forecast, by Application 2019 & 2032
- Table 36: Peru Global Patient Derived Xenograft Models Market Revenue (Million) Forecast, by Application 2019 & 2032
- Table 37: Chile Global Patient Derived Xenograft Models Market Revenue (Million) Forecast, by Application 2019 & 2032
- Table 38: Colombia Global Patient Derived Xenograft Models Market Revenue (Million) Forecast, by Application 2019 & 2032
- Table 39: Ecuador Global Patient Derived Xenograft Models Market Revenue (Million) Forecast, by Application 2019 & 2032
- Table 40: Venezuela Global Patient Derived Xenograft Models Market Revenue (Million) Forecast, by Application 2019 & 2032
- Table 41: Rest of South America Global Patient Derived Xenograft Models Market Revenue (Million) Forecast, by Application 2019 & 2032
- Table 42: Global Patient Derived Xenograft Models Market Revenue Million Forecast, by Country 2019 & 2032
- Table 43: United Arab Emirates Global Patient Derived Xenograft Models Market Revenue (Million) Forecast, by Application 2019 & 2032
- Table 44: Saudi Arabia Global Patient Derived Xenograft Models Market Revenue (Million) Forecast, by Application 2019 & 2032
- Table 45: South Africa Global Patient Derived Xenograft Models Market Revenue (Million) Forecast, by Application 2019 & 2032
- Table 46: Rest of Middle East and Africa Global Patient Derived Xenograft Models Market Revenue (Million) Forecast, by Application 2019 & 2032
- Table 47: Global Patient Derived Xenograft Models Market Revenue Million Forecast, by Type 2019 & 2032
- Table 48: Global Patient Derived Xenograft Models Market Revenue Million Forecast, by Tumor Type 2019 & 2032
- Table 49: Global Patient Derived Xenograft Models Market Revenue Million Forecast, by End User 2019 & 2032
- Table 50: Global Patient Derived Xenograft Models Market Revenue Million Forecast, by Country 2019 & 2032
- Table 51: United States Global Patient Derived Xenograft Models Market Revenue (Million) Forecast, by Application 2019 & 2032
- Table 52: Canada Global Patient Derived Xenograft Models Market Revenue (Million) Forecast, by Application 2019 & 2032
- Table 53: Mexico Global Patient Derived Xenograft Models Market Revenue (Million) Forecast, by Application 2019 & 2032
- Table 54: Global Patient Derived Xenograft Models Market Revenue Million Forecast, by Type 2019 & 2032
- Table 55: Global Patient Derived Xenograft Models Market Revenue Million Forecast, by Tumor Type 2019 & 2032
- Table 56: Global Patient Derived Xenograft Models Market Revenue Million Forecast, by End User 2019 & 2032
- Table 57: Global Patient Derived Xenograft Models Market Revenue Million Forecast, by Country 2019 & 2032
- Table 58: Germany Global Patient Derived Xenograft Models Market Revenue (Million) Forecast, by Application 2019 & 2032
- Table 59: United Kingdom Global Patient Derived Xenograft Models Market Revenue (Million) Forecast, by Application 2019 & 2032
- Table 60: France Global Patient Derived Xenograft Models Market Revenue (Million) Forecast, by Application 2019 & 2032
- Table 61: Italy Global Patient Derived Xenograft Models Market Revenue (Million) Forecast, by Application 2019 & 2032
- Table 62: Spain Global Patient Derived Xenograft Models Market Revenue (Million) Forecast, by Application 2019 & 2032
- Table 63: Rest of Europe Global Patient Derived Xenograft Models Market Revenue (Million) Forecast, by Application 2019 & 2032
- Table 64: Global Patient Derived Xenograft Models Market Revenue Million Forecast, by Type 2019 & 2032
- Table 65: Global Patient Derived Xenograft Models Market Revenue Million Forecast, by Tumor Type 2019 & 2032
- Table 66: Global Patient Derived Xenograft Models Market Revenue Million Forecast, by End User 2019 & 2032
- Table 67: Global Patient Derived Xenograft Models Market Revenue Million Forecast, by Country 2019 & 2032
- Table 68: China Global Patient Derived Xenograft Models Market Revenue (Million) Forecast, by Application 2019 & 2032
- Table 69: Japan Global Patient Derived Xenograft Models Market Revenue (Million) Forecast, by Application 2019 & 2032
- Table 70: India Global Patient Derived Xenograft Models Market Revenue (Million) Forecast, by Application 2019 & 2032
- Table 71: Australia Global Patient Derived Xenograft Models Market Revenue (Million) Forecast, by Application 2019 & 2032
- Table 72: South Korea Global Patient Derived Xenograft Models Market Revenue (Million) Forecast, by Application 2019 & 2032
- Table 73: Rest of Asia Pacific Global Patient Derived Xenograft Models Market Revenue (Million) Forecast, by Application 2019 & 2032
- Table 74: Global Patient Derived Xenograft Models Market Revenue Million Forecast, by Type 2019 & 2032
- Table 75: Global Patient Derived Xenograft Models Market Revenue Million Forecast, by Tumor Type 2019 & 2032
- Table 76: Global Patient Derived Xenograft Models Market Revenue Million Forecast, by End User 2019 & 2032
- Table 77: Global Patient Derived Xenograft Models Market Revenue Million Forecast, by Country 2019 & 2032
Frequently Asked Questions
1. What is the projected Compound Annual Growth Rate (CAGR) of the Global Patient Derived Xenograft Models Market?
The projected CAGR is approximately 12.50%.
2. Which companies are prominent players in the Global Patient Derived Xenograft Models Market?
Key companies in the market include Champions Oncology Inc, Xentech, Pharmatest Services Ltd, Crown Bioscience Inc, Oncodesign, EPO Berlin-Buch GmbH, Charles River Laboratories Inc, Urolead, Hera BioLabs.
3. What are the main segments of the Global Patient Derived Xenograft Models Market?
The market segments include Type, Tumor Type, End User.
4. Can you provide details about the market size?
The market size is estimated to be USD XX Million as of 2022.
5. What are some drivers contributing to market growth?
Rising Cases of Cancer; Rising R&D Activities in the Pharmaceutical Industry; Continuous Support for Cancer Research From Public as Well as Private Sector.
6. What are the notable trends driving market growth?
Mice Model Segment is Expected to Witness Growth Over the Forecast Period.
7. Are there any restraints impacting market growth?
High Cost of Personalized Patient Derived Xenograft Models; Stringent Regulations Towards Use of Animals Models.
8. Can you provide examples of recent developments in the market?
July 2022: GemPharmatech (GemPharmatech Co., Ltd.) announced that it has entered into a strategic license agreement with Charles River Laboratories, Inc. for exclusive distribution of its next-generation NOD CRISPR Prkdc Il2r gamma (NCG) mouse lines in North America. Charles River will establish foundation colonies with models to be commercially available beginning in 2023.
9. What pricing options are available for accessing the report?
Pricing options include single-user, multi-user, and enterprise licenses priced at USD 4750, USD 5250, and USD 8750 respectively.
10. Is the market size provided in terms of value or volume?
The market size is provided in terms of value, measured in Million.
11. Are there any specific market keywords associated with the report?
Yes, the market keyword associated with the report is "Global Patient Derived Xenograft Models Market," which aids in identifying and referencing the specific market segment covered.
12. How do I determine which pricing option suits my needs best?
The pricing options vary based on user requirements and access needs. Individual users may opt for single-user licenses, while businesses requiring broader access may choose multi-user or enterprise licenses for cost-effective access to the report.
13. Are there any additional resources or data provided in the Global Patient Derived Xenograft Models Market report?
While the report offers comprehensive insights, it's advisable to review the specific contents or supplementary materials provided to ascertain if additional resources or data are available.
14. How can I stay updated on further developments or reports in the Global Patient Derived Xenograft Models Market?
To stay informed about further developments, trends, and reports in the Global Patient Derived Xenograft Models Market, consider subscribing to industry newsletters, following relevant companies and organizations, or regularly checking reputable industry news sources and publications.
Methodology
Step 1 - Identification of Relevant Samples Size from Population Database


Step 2 - Approaches for Defining Global Market Size (Value, Volume* & Price*)

Note*: In applicable scenarios
Step 3 - Data Sources
Primary Research
- Web Analytics
- Survey Reports
- Research Institute
- Latest Research Reports
- Opinion Leaders
Secondary Research
- Annual Reports
- White Paper
- Latest Press Release
- Industry Association
- Paid Database
- Investor Presentations

Step 4 - Data Triangulation
Involves using different sources of information in order to increase the validity of a study
These sources are likely to be stakeholders in a program - participants, other researchers, program staff, other community members, and so on.
Then we put all data in single framework & apply various statistical tools to find out the dynamic on the market.
During the analysis stage, feedback from the stakeholder groups would be compared to determine areas of agreement as well as areas of divergence


