
Key Insights
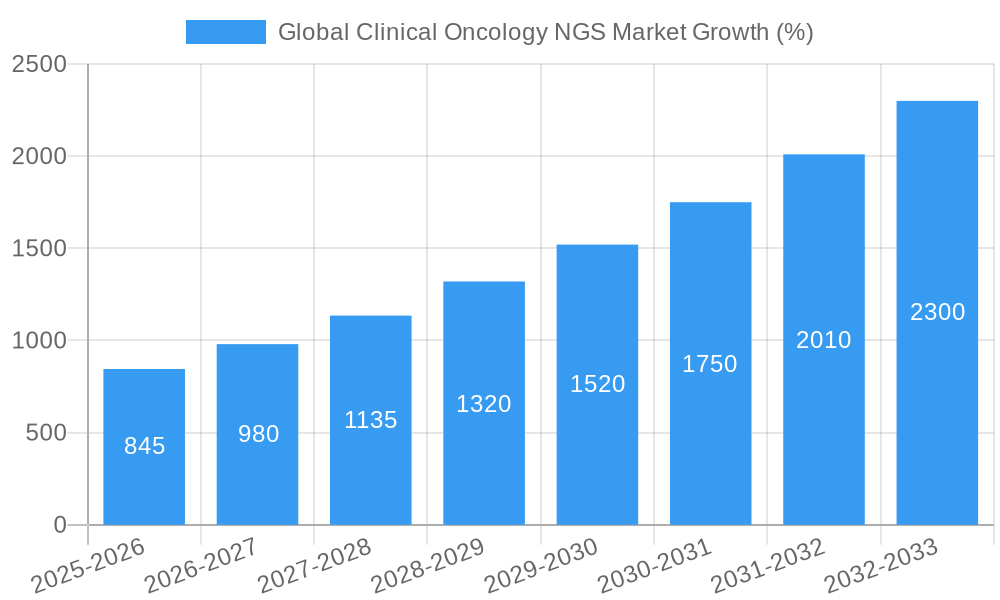
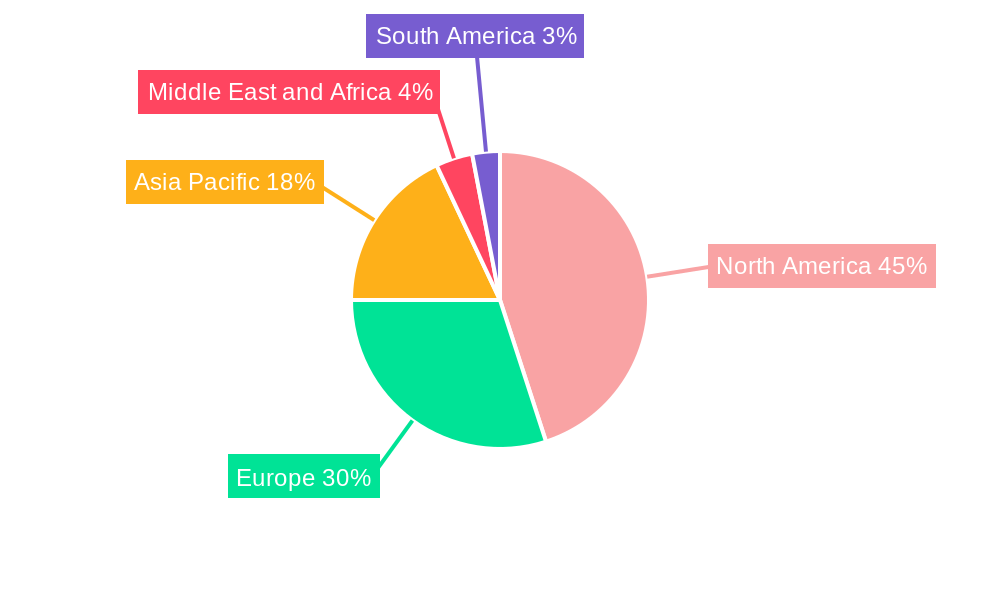
The global clinical oncology next-generation sequencing (NGS) market is experiencing robust growth, driven by the increasing prevalence of cancer, advancements in NGS technologies, and the rising demand for personalized medicine. The market's Compound Annual Growth Rate (CAGR) of 16.90% from 2019 to 2024 suggests a significant expansion, projected to continue into the forecast period (2025-2033). Key drivers include the improved accuracy and efficiency of NGS in cancer diagnosis and treatment compared to traditional methods, its ability to detect minimal residual disease (MRD), and its role in guiding targeted therapies. Furthermore, the declining cost of sequencing and the development of user-friendly software for data analysis are making NGS more accessible to a wider range of healthcare providers. Technological advancements, particularly in whole genome sequencing (WGS) and whole exome sequencing (WES), are further fueling market growth. However, challenges remain, including the high initial investment costs associated with NGS technology, the need for skilled professionals to interpret complex data, and regulatory hurdles in certain regions. The market is segmented by technology (WGS, WES, targeted sequencing), workflow (pre-sequencing, sequencing, data analysis), application (screening, inherited cancer, companion diagnostics), and end-user (hospitals, clinics, laboratories). North America currently holds a significant market share due to advanced healthcare infrastructure and high adoption rates, but the Asia-Pacific region is expected to witness substantial growth in the coming years due to increasing healthcare expenditure and rising cancer incidence.
The competitive landscape is characterized by a mix of established players like Illumina, Thermo Fisher Scientific, and Roche, alongside emerging companies offering innovative solutions. These companies are strategically focusing on partnerships, acquisitions, and technological advancements to maintain their market positions. The ongoing research and development efforts in NGS are expected to result in further technological advancements, leading to improved diagnostic accuracy, reduced costs, and increased accessibility of NGS-based clinical oncology applications. This will ultimately contribute to improved patient outcomes and personalized cancer care globally. While challenges exist, the long-term growth prospects for the clinical oncology NGS market remain very positive, fueled by continuous innovation and increasing demand for effective cancer treatment solutions. The market is expected to reach a substantial value by 2033, driven by the factors mentioned above.
Global Clinical Oncology NGS Market: A Comprehensive Report (2019-2033)
This in-depth report provides a comprehensive analysis of the Global Clinical Oncology Next-Generation Sequencing (NGS) Market, encompassing market dynamics, growth trends, regional segmentation, product landscape, key players, and future outlook. The study period covers 2019-2033, with 2025 as the base year and a forecast period of 2025-2033. The report leverages extensive data analysis to offer actionable insights for industry professionals, investors, and researchers. The market size is valued at xx Million in 2025 and projected to reach xx Million by 2033.
Global Clinical Oncology NGS Market Dynamics & Structure
The Global Clinical Oncology NGS market is characterized by a moderately concentrated landscape with several key players competing intensely. Technological innovation, particularly in areas like targeted sequencing and improved data analysis tools, is a primary growth driver. Stringent regulatory frameworks governing diagnostic testing and data privacy present both challenges and opportunities. The market witnesses continuous product evolution, with improved accuracy, speed, and cost-effectiveness driving adoption. Mergers and acquisitions (M&A) activity is notable, with larger companies strategically acquiring smaller players to expand their portfolio and market share.
- Market Concentration: Moderately concentrated, with top 5 players holding approximately xx% market share in 2025.
- Technological Innovation: Rapid advancements in sequencing technologies, data analysis algorithms, and bioinformatics tools are driving market growth.
- Regulatory Framework: Stringent regulations related to diagnostic testing and data privacy impact market access and adoption. Compliance costs represent a significant barrier for smaller companies.
- Competitive Landscape: Intense competition among established players and emerging companies drives innovation and price pressure.
- M&A Activity: An average of xx M&A deals per year were observed during the historical period (2019-2024).
- End-User Demographics: The market is driven primarily by the increasing prevalence of cancer, the growing demand for personalized medicine, and improved reimbursement policies.
Global Clinical Oncology NGS Market Growth Trends & Insights
The Global Clinical Oncology NGS market has witnessed significant growth driven by rising cancer incidence rates, increasing demand for personalized medicine, and technological advancements leading to improved accuracy and efficiency of NGS-based cancer diagnostics. The market exhibited a CAGR of xx% during the historical period (2019-2024) and is projected to maintain a CAGR of xx% during the forecast period (2025-2033). This growth is attributable to several factors: wider adoption of NGS in clinical settings, decreasing costs associated with sequencing, and increasing availability of sophisticated data analysis tools. Consumer behavior is shifting towards a preference for personalized cancer treatment, fueling demand for NGS-based diagnostics. Technological disruptions, such as the development of long-read sequencing technologies, are poised to further accelerate market growth. Market penetration of NGS in oncology is estimated at xx% in 2025, expected to increase to xx% by 2033.
Dominant Regions, Countries, or Segments in Global Clinical Oncology NGS Market
North America currently dominates the Global Clinical Oncology NGS market, driven by high healthcare expenditure, robust regulatory support, and early adoption of advanced technologies. Within North America, the United States holds the largest market share. Europe follows as a significant market, with strong growth prospects fueled by increasing healthcare investments and expanding NGS infrastructure. Asia-Pacific is witnessing rapid growth, driven by rising cancer incidence, increasing healthcare spending, and the entrance of several key players into this market.
Key Drivers by Segment:
- Technology: Targeted Sequencing & Resequencing holds the largest market share due to its cost-effectiveness and applicability to a wide range of cancer types. Whole Genome Sequencing is witnessing strong growth driven by its ability to provide a comprehensive genetic profile.
- Workflow: The Sequencing segment holds the largest market share, while the Data Analysis segment is experiencing the highest growth rate due to increasing demand for sophisticated bioinformatics tools.
- Application: Companion diagnostics is the fastest-growing application segment, driven by the increasing use of NGS for guiding targeted therapy selection.
- End-use: Hospitals and specialized laboratories represent the largest market share, but clinics are showing significant growth driven by their increasing capacity for molecular diagnostics.
Global Clinical Oncology NGS Market Product Landscape
The Global Clinical Oncology NGS market offers a range of products, including sequencing platforms, library preparation kits, data analysis software, and related services. Recent innovations focus on improving throughput, accuracy, and cost-effectiveness. Unique selling propositions often revolve around ease of use, speed of results, and the comprehensiveness of data generated. Technological advancements are concentrating on miniaturization, integration of workflow steps, and enhanced data interpretation capabilities.
Key Drivers, Barriers & Challenges in Global Clinical Oncology NGS Market
Key Drivers:
- Rising prevalence of cancer globally
- Increasing demand for personalized medicine and targeted therapies
- Technological advancements in NGS technology, leading to higher accuracy and lower costs.
- Favorable reimbursement policies in several regions.
Challenges and Restraints:
- High initial investment costs associated with NGS technologies
- Complex data analysis and interpretation requirements
- Stringent regulatory hurdles and data privacy concerns
- Skilled personnel shortage in data analysis and interpretation
Emerging Opportunities in Global Clinical Oncology NGS Market
- Expansion into untapped markets in developing economies
- Development of novel NGS applications for early cancer detection and screening
- Integration of NGS data with other omics data to improve diagnostic accuracy and treatment personalization.
- Growing interest in liquid biopsies for non-invasive cancer diagnostics.
Growth Accelerators in the Global Clinical Oncology NGS Market Industry
The long-term growth of the Clinical Oncology NGS market is fueled by continuous technological innovation, strategic partnerships between NGS providers and pharmaceutical companies, and the ongoing expansion of the market into new geographic regions and clinical applications. The development of more efficient and affordable sequencing technologies, coupled with the growing demand for precision medicine, is creating significant opportunities for market expansion and growth.
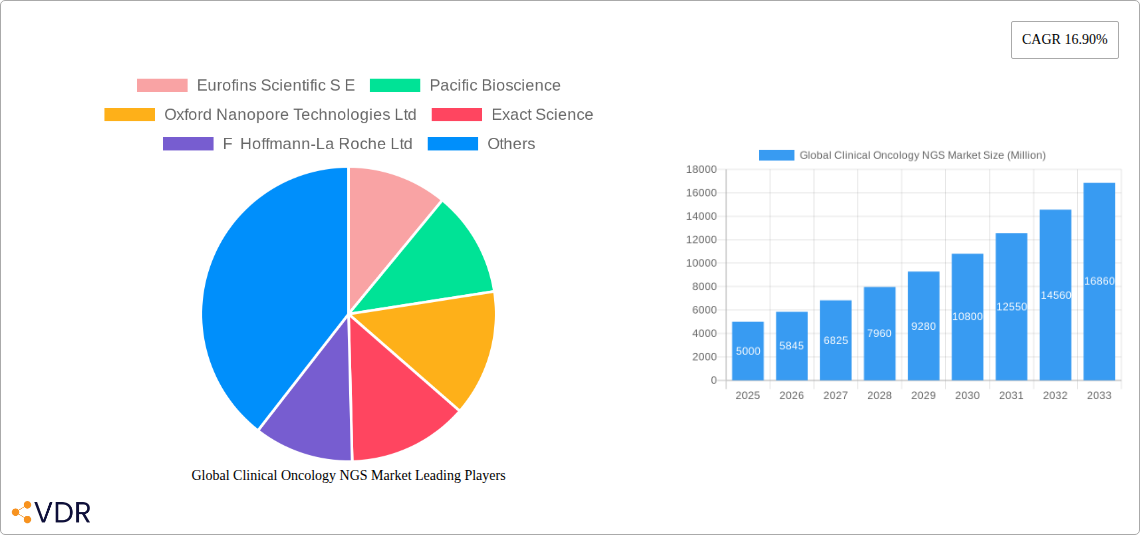
Key Players Shaping the Global Clinical Oncology NGS Market Market
- Eurofins Scientific S.E.
- Pacific Biosciences
- Oxford Nanopore Technologies Ltd
- Exact Sciences
- F. Hoffmann-La Roche Ltd
- Qiagen N.V.
- Foundation Medicine
- Myriad Genetics
- Illumina Inc
- Caris Life Sciences
- Thermo Fisher Scientific
- Agilent Technologies
- PerkinElmer
- Beijing Genomics Institute (BGI)
Notable Milestones in Global Clinical Oncology NGS Market Sector
- 2020: Illumina launches the NovaSeq X Plus System.
- 2021: Roche acquires Genentech's oncology assets.
- 2022: FDA approves several NGS-based companion diagnostic tests.
- 2023: Several key players announce strategic partnerships to develop new NGS applications.
- 2024: Significant advancements in long-read sequencing technologies are reported.
In-Depth Global Clinical Oncology NGS Market Market Outlook
The future of the Global Clinical Oncology NGS market is bright, driven by technological advancements, increasing demand for personalized medicine, and expanding market penetration in emerging economies. Strategic partnerships, mergers, and acquisitions will further shape the market landscape. Continued innovation in areas such as liquid biopsies, single-cell sequencing, and artificial intelligence-driven data analysis will be key factors driving long-term growth and creating new opportunities for market players. The market is expected to witness considerable expansion, with significant potential for growth in both developed and emerging markets.
Global Clinical Oncology NGS Market Segmentation
-
1. Technology
- 1.1. Whole Genome Sequencing
- 1.2. Whole Exome Sequencing
- 1.3. Targeted Sequencing & Resequencing Centrifuges
-
2. Workflow
- 2.1. Pre-Sequencing
- 2.2. Data Analysis
-
3. Application
-
3.1. Screening
- 3.1.1. Sporadic Cancer
- 3.1.2. Inherited Cancer
- 3.2. Companion Diagnostics
- 3.3. Other Diagnostics
-
3.1. Screening
-
4. End-use
- 4.1. Hospitals
- 4.2. Clinics
- 4.3. Laboratories
Global Clinical Oncology NGS Market Segmentation By Geography
-
1. North America
- 1.1. United States
- 1.2. Canada
- 1.3. Mexico
-
2. Europe
- 2.1. Germany
- 2.2. United Kingdom
- 2.3. France
- 2.4. Italy
- 2.5. Spain
- 2.6. Rest of Europe
-
3. Asia Pacific
- 3.1. China
- 3.2. Japan
- 3.3. India
- 3.4. Australia
- 3.5. South Korea
- 3.6. Rest of Asia Pacific
-
4. Middle East and Africa
- 4.1. GCC
- 4.2. South Africa
- 4.3. Rest of Middle East and Africa
-
5. South America
- 5.1. Brazil
- 5.2. Argentina
- 5.3. Rest of South America
Global Clinical Oncology NGS Market REPORT HIGHLIGHTS
| Aspects | Details |
|---|---|
| Study Period | 2019-2033 |
| Base Year | 2024 |
| Estimated Year | 2025 |
| Forecast Period | 2025-2033 |
| Historical Period | 2019-2024 |
| Growth Rate | CAGR of 16.90% from 2019-2033 |
| Segmentation |
|
Table of Contents
- 1. Introduction
- 1.1. Research Scope
- 1.2. Market Segmentation
- 1.3. Research Methodology
- 1.4. Definitions and Assumptions
- 2. Executive Summary
- 2.1. Introduction
- 3. Market Dynamics
- 3.1. Introduction
- 3.2. Market Drivers
- 3.2.1. Advancements in the Field of Personalized Medicine; Rising Burden of Cancer; Decrease in Costs for Genetic Sequencing
- 3.3. Market Restrains
- 3.3.1. Lack of computational efficiency for data management; Inadequate Reimbursement Policy
- 3.4. Market Trends
- 3.4.1. Whole Genome Sequencing is Expected to Projected Significant Growth Over the Forecast Period.
- 4. Market Factor Analysis
- 4.1. Porters Five Forces
- 4.2. Supply/Value Chain
- 4.3. PESTEL analysis
- 4.4. Market Entropy
- 4.5. Patent/Trademark Analysis
- 5. Global Clinical Oncology NGS Market Analysis, Insights and Forecast, 2019-2031
- 5.1. Market Analysis, Insights and Forecast - by Technology
- 5.1.1. Whole Genome Sequencing
- 5.1.2. Whole Exome Sequencing
- 5.1.3. Targeted Sequencing & Resequencing Centrifuges
- 5.2. Market Analysis, Insights and Forecast - by Workflow
- 5.2.1. Pre-Sequencing
- 5.2.2. Data Analysis
- 5.3. Market Analysis, Insights and Forecast - by Application
- 5.3.1. Screening
- 5.3.1.1. Sporadic Cancer
- 5.3.1.2. Inherited Cancer
- 5.3.2. Companion Diagnostics
- 5.3.3. Other Diagnostics
- 5.3.1. Screening
- 5.4. Market Analysis, Insights and Forecast - by End-use
- 5.4.1. Hospitals
- 5.4.2. Clinics
- 5.4.3. Laboratories
- 5.5. Market Analysis, Insights and Forecast - by Region
- 5.5.1. North America
- 5.5.2. Europe
- 5.5.3. Asia Pacific
- 5.5.4. Middle East and Africa
- 5.5.5. South America
- 5.1. Market Analysis, Insights and Forecast - by Technology
- 6. North America Global Clinical Oncology NGS Market Analysis, Insights and Forecast, 2019-2031
- 6.1. Market Analysis, Insights and Forecast - by Technology
- 6.1.1. Whole Genome Sequencing
- 6.1.2. Whole Exome Sequencing
- 6.1.3. Targeted Sequencing & Resequencing Centrifuges
- 6.2. Market Analysis, Insights and Forecast - by Workflow
- 6.2.1. Pre-Sequencing
- 6.2.2. Data Analysis
- 6.3. Market Analysis, Insights and Forecast - by Application
- 6.3.1. Screening
- 6.3.1.1. Sporadic Cancer
- 6.3.1.2. Inherited Cancer
- 6.3.2. Companion Diagnostics
- 6.3.3. Other Diagnostics
- 6.3.1. Screening
- 6.4. Market Analysis, Insights and Forecast - by End-use
- 6.4.1. Hospitals
- 6.4.2. Clinics
- 6.4.3. Laboratories
- 6.1. Market Analysis, Insights and Forecast - by Technology
- 7. Europe Global Clinical Oncology NGS Market Analysis, Insights and Forecast, 2019-2031
- 7.1. Market Analysis, Insights and Forecast - by Technology
- 7.1.1. Whole Genome Sequencing
- 7.1.2. Whole Exome Sequencing
- 7.1.3. Targeted Sequencing & Resequencing Centrifuges
- 7.2. Market Analysis, Insights and Forecast - by Workflow
- 7.2.1. Pre-Sequencing
- 7.2.2. Data Analysis
- 7.3. Market Analysis, Insights and Forecast - by Application
- 7.3.1. Screening
- 7.3.1.1. Sporadic Cancer
- 7.3.1.2. Inherited Cancer
- 7.3.2. Companion Diagnostics
- 7.3.3. Other Diagnostics
- 7.3.1. Screening
- 7.4. Market Analysis, Insights and Forecast - by End-use
- 7.4.1. Hospitals
- 7.4.2. Clinics
- 7.4.3. Laboratories
- 7.1. Market Analysis, Insights and Forecast - by Technology
- 8. Asia Pacific Global Clinical Oncology NGS Market Analysis, Insights and Forecast, 2019-2031
- 8.1. Market Analysis, Insights and Forecast - by Technology
- 8.1.1. Whole Genome Sequencing
- 8.1.2. Whole Exome Sequencing
- 8.1.3. Targeted Sequencing & Resequencing Centrifuges
- 8.2. Market Analysis, Insights and Forecast - by Workflow
- 8.2.1. Pre-Sequencing
- 8.2.2. Data Analysis
- 8.3. Market Analysis, Insights and Forecast - by Application
- 8.3.1. Screening
- 8.3.1.1. Sporadic Cancer
- 8.3.1.2. Inherited Cancer
- 8.3.2. Companion Diagnostics
- 8.3.3. Other Diagnostics
- 8.3.1. Screening
- 8.4. Market Analysis, Insights and Forecast - by End-use
- 8.4.1. Hospitals
- 8.4.2. Clinics
- 8.4.3. Laboratories
- 8.1. Market Analysis, Insights and Forecast - by Technology
- 9. Middle East and Africa Global Clinical Oncology NGS Market Analysis, Insights and Forecast, 2019-2031
- 9.1. Market Analysis, Insights and Forecast - by Technology
- 9.1.1. Whole Genome Sequencing
- 9.1.2. Whole Exome Sequencing
- 9.1.3. Targeted Sequencing & Resequencing Centrifuges
- 9.2. Market Analysis, Insights and Forecast - by Workflow
- 9.2.1. Pre-Sequencing
- 9.2.2. Data Analysis
- 9.3. Market Analysis, Insights and Forecast - by Application
- 9.3.1. Screening
- 9.3.1.1. Sporadic Cancer
- 9.3.1.2. Inherited Cancer
- 9.3.2. Companion Diagnostics
- 9.3.3. Other Diagnostics
- 9.3.1. Screening
- 9.4. Market Analysis, Insights and Forecast - by End-use
- 9.4.1. Hospitals
- 9.4.2. Clinics
- 9.4.3. Laboratories
- 9.1. Market Analysis, Insights and Forecast - by Technology
- 10. South America Global Clinical Oncology NGS Market Analysis, Insights and Forecast, 2019-2031
- 10.1. Market Analysis, Insights and Forecast - by Technology
- 10.1.1. Whole Genome Sequencing
- 10.1.2. Whole Exome Sequencing
- 10.1.3. Targeted Sequencing & Resequencing Centrifuges
- 10.2. Market Analysis, Insights and Forecast - by Workflow
- 10.2.1. Pre-Sequencing
- 10.2.2. Data Analysis
- 10.3. Market Analysis, Insights and Forecast - by Application
- 10.3.1. Screening
- 10.3.1.1. Sporadic Cancer
- 10.3.1.2. Inherited Cancer
- 10.3.2. Companion Diagnostics
- 10.3.3. Other Diagnostics
- 10.3.1. Screening
- 10.4. Market Analysis, Insights and Forecast - by End-use
- 10.4.1. Hospitals
- 10.4.2. Clinics
- 10.4.3. Laboratories
- 10.1. Market Analysis, Insights and Forecast - by Technology
- 11. North America Global Clinical Oncology NGS Market Analysis, Insights and Forecast, 2019-2031
- 11.1. Market Analysis, Insights and Forecast - By Country/Sub-region
- 11.1.1 United States
- 11.1.2 Canada
- 11.1.3 Mexico
- 12. Europe Global Clinical Oncology NGS Market Analysis, Insights and Forecast, 2019-2031
- 12.1. Market Analysis, Insights and Forecast - By Country/Sub-region
- 12.1.1 Germany
- 12.1.2 United Kingdom
- 12.1.3 France
- 12.1.4 Italy
- 12.1.5 Spain
- 12.1.6 Rest of Europe
- 13. Asia Pacific Global Clinical Oncology NGS Market Analysis, Insights and Forecast, 2019-2031
- 13.1. Market Analysis, Insights and Forecast - By Country/Sub-region
- 13.1.1 China
- 13.1.2 Japan
- 13.1.3 India
- 13.1.4 Australia
- 13.1.5 South Korea
- 13.1.6 Rest of Asia Pacific
- 14. Middle East and Africa Global Clinical Oncology NGS Market Analysis, Insights and Forecast, 2019-2031
- 14.1. Market Analysis, Insights and Forecast - By Country/Sub-region
- 14.1.1 GCC
- 14.1.2 South Africa
- 14.1.3 Rest of Middle East and Africa
- 15. South America Global Clinical Oncology NGS Market Analysis, Insights and Forecast, 2019-2031
- 15.1. Market Analysis, Insights and Forecast - By Country/Sub-region
- 15.1.1 Brazil
- 15.1.2 Argentina
- 15.1.3 Rest of South America
- 16. Competitive Analysis
- 16.1. Market Share Analysis 2024
- 16.2. Company Profiles
- 16.2.1 Eurofins Scientific S E
- 16.2.1.1. Overview
- 16.2.1.2. Products
- 16.2.1.3. SWOT Analysis
- 16.2.1.4. Recent Developments
- 16.2.1.5. Financials (Based on Availability)
- 16.2.2 Pacific Bioscience
- 16.2.2.1. Overview
- 16.2.2.2. Products
- 16.2.2.3. SWOT Analysis
- 16.2.2.4. Recent Developments
- 16.2.2.5. Financials (Based on Availability)
- 16.2.3 Oxford Nanopore Technologies Ltd
- 16.2.3.1. Overview
- 16.2.3.2. Products
- 16.2.3.3. SWOT Analysis
- 16.2.3.4. Recent Developments
- 16.2.3.5. Financials (Based on Availability)
- 16.2.4 Exact Science
- 16.2.4.1. Overview
- 16.2.4.2. Products
- 16.2.4.3. SWOT Analysis
- 16.2.4.4. Recent Developments
- 16.2.4.5. Financials (Based on Availability)
- 16.2.5 F Hoffmann-La Roche Ltd
- 16.2.5.1. Overview
- 16.2.5.2. Products
- 16.2.5.3. SWOT Analysis
- 16.2.5.4. Recent Developments
- 16.2.5.5. Financials (Based on Availability)
- 16.2.6 Partek Inc
- 16.2.6.1. Overview
- 16.2.6.2. Products
- 16.2.6.3. SWOT Analysis
- 16.2.6.4. Recent Developments
- 16.2.6.5. Financials (Based on Availability)
- 16.2.7 Qiagen N V *List Not Exhaustive
- 16.2.7.1. Overview
- 16.2.7.2. Products
- 16.2.7.3. SWOT Analysis
- 16.2.7.4. Recent Developments
- 16.2.7.5. Financials (Based on Availability)
- 16.2.8 Foundation Medicine
- 16.2.8.1. Overview
- 16.2.8.2. Products
- 16.2.8.3. SWOT Analysis
- 16.2.8.4. Recent Developments
- 16.2.8.5. Financials (Based on Availability)
- 16.2.9 Myriad Genetics
- 16.2.9.1. Overview
- 16.2.9.2. Products
- 16.2.9.3. SWOT Analysis
- 16.2.9.4. Recent Developments
- 16.2.9.5. Financials (Based on Availability)
- 16.2.10 Illumina Inc
- 16.2.10.1. Overview
- 16.2.10.2. Products
- 16.2.10.3. SWOT Analysis
- 16.2.10.4. Recent Developments
- 16.2.10.5. Financials (Based on Availability)
- 16.2.11 Caris Life Sciences
- 16.2.11.1. Overview
- 16.2.11.2. Products
- 16.2.11.3. SWOT Analysis
- 16.2.11.4. Recent Developments
- 16.2.11.5. Financials (Based on Availability)
- 16.2.12 Thermo Fisher Scientific
- 16.2.12.1. Overview
- 16.2.12.2. Products
- 16.2.12.3. SWOT Analysis
- 16.2.12.4. Recent Developments
- 16.2.12.5. Financials (Based on Availability)
- 16.2.13 Agilent Technologies
- 16.2.13.1. Overview
- 16.2.13.2. Products
- 16.2.13.3. SWOT Analysis
- 16.2.13.4. Recent Developments
- 16.2.13.5. Financials (Based on Availability)
- 16.2.14 Perkin Elmer
- 16.2.14.1. Overview
- 16.2.14.2. Products
- 16.2.14.3. SWOT Analysis
- 16.2.14.4. Recent Developments
- 16.2.14.5. Financials (Based on Availability)
- 16.2.15 Beijing Genomics Institute (BGI)
- 16.2.15.1. Overview
- 16.2.15.2. Products
- 16.2.15.3. SWOT Analysis
- 16.2.15.4. Recent Developments
- 16.2.15.5. Financials (Based on Availability)
- 16.2.1 Eurofins Scientific S E
List of Figures
- Figure 1: Global Global Clinical Oncology NGS Market Revenue Breakdown (Million, %) by Region 2024 & 2032
- Figure 2: North America Global Clinical Oncology NGS Market Revenue (Million), by Country 2024 & 2032
- Figure 3: North America Global Clinical Oncology NGS Market Revenue Share (%), by Country 2024 & 2032
- Figure 4: Europe Global Clinical Oncology NGS Market Revenue (Million), by Country 2024 & 2032
- Figure 5: Europe Global Clinical Oncology NGS Market Revenue Share (%), by Country 2024 & 2032
- Figure 6: Asia Pacific Global Clinical Oncology NGS Market Revenue (Million), by Country 2024 & 2032
- Figure 7: Asia Pacific Global Clinical Oncology NGS Market Revenue Share (%), by Country 2024 & 2032
- Figure 8: Middle East and Africa Global Clinical Oncology NGS Market Revenue (Million), by Country 2024 & 2032
- Figure 9: Middle East and Africa Global Clinical Oncology NGS Market Revenue Share (%), by Country 2024 & 2032
- Figure 10: South America Global Clinical Oncology NGS Market Revenue (Million), by Country 2024 & 2032
- Figure 11: South America Global Clinical Oncology NGS Market Revenue Share (%), by Country 2024 & 2032
- Figure 12: North America Global Clinical Oncology NGS Market Revenue (Million), by Technology 2024 & 2032
- Figure 13: North America Global Clinical Oncology NGS Market Revenue Share (%), by Technology 2024 & 2032
- Figure 14: North America Global Clinical Oncology NGS Market Revenue (Million), by Workflow 2024 & 2032
- Figure 15: North America Global Clinical Oncology NGS Market Revenue Share (%), by Workflow 2024 & 2032
- Figure 16: North America Global Clinical Oncology NGS Market Revenue (Million), by Application 2024 & 2032
- Figure 17: North America Global Clinical Oncology NGS Market Revenue Share (%), by Application 2024 & 2032
- Figure 18: North America Global Clinical Oncology NGS Market Revenue (Million), by End-use 2024 & 2032
- Figure 19: North America Global Clinical Oncology NGS Market Revenue Share (%), by End-use 2024 & 2032
- Figure 20: North America Global Clinical Oncology NGS Market Revenue (Million), by Country 2024 & 2032
- Figure 21: North America Global Clinical Oncology NGS Market Revenue Share (%), by Country 2024 & 2032
- Figure 22: Europe Global Clinical Oncology NGS Market Revenue (Million), by Technology 2024 & 2032
- Figure 23: Europe Global Clinical Oncology NGS Market Revenue Share (%), by Technology 2024 & 2032
- Figure 24: Europe Global Clinical Oncology NGS Market Revenue (Million), by Workflow 2024 & 2032
- Figure 25: Europe Global Clinical Oncology NGS Market Revenue Share (%), by Workflow 2024 & 2032
- Figure 26: Europe Global Clinical Oncology NGS Market Revenue (Million), by Application 2024 & 2032
- Figure 27: Europe Global Clinical Oncology NGS Market Revenue Share (%), by Application 2024 & 2032
- Figure 28: Europe Global Clinical Oncology NGS Market Revenue (Million), by End-use 2024 & 2032
- Figure 29: Europe Global Clinical Oncology NGS Market Revenue Share (%), by End-use 2024 & 2032
- Figure 30: Europe Global Clinical Oncology NGS Market Revenue (Million), by Country 2024 & 2032
- Figure 31: Europe Global Clinical Oncology NGS Market Revenue Share (%), by Country 2024 & 2032
- Figure 32: Asia Pacific Global Clinical Oncology NGS Market Revenue (Million), by Technology 2024 & 2032
- Figure 33: Asia Pacific Global Clinical Oncology NGS Market Revenue Share (%), by Technology 2024 & 2032
- Figure 34: Asia Pacific Global Clinical Oncology NGS Market Revenue (Million), by Workflow 2024 & 2032
- Figure 35: Asia Pacific Global Clinical Oncology NGS Market Revenue Share (%), by Workflow 2024 & 2032
- Figure 36: Asia Pacific Global Clinical Oncology NGS Market Revenue (Million), by Application 2024 & 2032
- Figure 37: Asia Pacific Global Clinical Oncology NGS Market Revenue Share (%), by Application 2024 & 2032
- Figure 38: Asia Pacific Global Clinical Oncology NGS Market Revenue (Million), by End-use 2024 & 2032
- Figure 39: Asia Pacific Global Clinical Oncology NGS Market Revenue Share (%), by End-use 2024 & 2032
- Figure 40: Asia Pacific Global Clinical Oncology NGS Market Revenue (Million), by Country 2024 & 2032
- Figure 41: Asia Pacific Global Clinical Oncology NGS Market Revenue Share (%), by Country 2024 & 2032
- Figure 42: Middle East and Africa Global Clinical Oncology NGS Market Revenue (Million), by Technology 2024 & 2032
- Figure 43: Middle East and Africa Global Clinical Oncology NGS Market Revenue Share (%), by Technology 2024 & 2032
- Figure 44: Middle East and Africa Global Clinical Oncology NGS Market Revenue (Million), by Workflow 2024 & 2032
- Figure 45: Middle East and Africa Global Clinical Oncology NGS Market Revenue Share (%), by Workflow 2024 & 2032
- Figure 46: Middle East and Africa Global Clinical Oncology NGS Market Revenue (Million), by Application 2024 & 2032
- Figure 47: Middle East and Africa Global Clinical Oncology NGS Market Revenue Share (%), by Application 2024 & 2032
- Figure 48: Middle East and Africa Global Clinical Oncology NGS Market Revenue (Million), by End-use 2024 & 2032
- Figure 49: Middle East and Africa Global Clinical Oncology NGS Market Revenue Share (%), by End-use 2024 & 2032
- Figure 50: Middle East and Africa Global Clinical Oncology NGS Market Revenue (Million), by Country 2024 & 2032
- Figure 51: Middle East and Africa Global Clinical Oncology NGS Market Revenue Share (%), by Country 2024 & 2032
- Figure 52: South America Global Clinical Oncology NGS Market Revenue (Million), by Technology 2024 & 2032
- Figure 53: South America Global Clinical Oncology NGS Market Revenue Share (%), by Technology 2024 & 2032
- Figure 54: South America Global Clinical Oncology NGS Market Revenue (Million), by Workflow 2024 & 2032
- Figure 55: South America Global Clinical Oncology NGS Market Revenue Share (%), by Workflow 2024 & 2032
- Figure 56: South America Global Clinical Oncology NGS Market Revenue (Million), by Application 2024 & 2032
- Figure 57: South America Global Clinical Oncology NGS Market Revenue Share (%), by Application 2024 & 2032
- Figure 58: South America Global Clinical Oncology NGS Market Revenue (Million), by End-use 2024 & 2032
- Figure 59: South America Global Clinical Oncology NGS Market Revenue Share (%), by End-use 2024 & 2032
- Figure 60: South America Global Clinical Oncology NGS Market Revenue (Million), by Country 2024 & 2032
- Figure 61: South America Global Clinical Oncology NGS Market Revenue Share (%), by Country 2024 & 2032
List of Tables
- Table 1: Global Clinical Oncology NGS Market Revenue Million Forecast, by Region 2019 & 2032
- Table 2: Global Clinical Oncology NGS Market Revenue Million Forecast, by Technology 2019 & 2032
- Table 3: Global Clinical Oncology NGS Market Revenue Million Forecast, by Workflow 2019 & 2032
- Table 4: Global Clinical Oncology NGS Market Revenue Million Forecast, by Application 2019 & 2032
- Table 5: Global Clinical Oncology NGS Market Revenue Million Forecast, by End-use 2019 & 2032
- Table 6: Global Clinical Oncology NGS Market Revenue Million Forecast, by Region 2019 & 2032
- Table 7: Global Clinical Oncology NGS Market Revenue Million Forecast, by Country 2019 & 2032
- Table 8: United States Global Clinical Oncology NGS Market Revenue (Million) Forecast, by Application 2019 & 2032
- Table 9: Canada Global Clinical Oncology NGS Market Revenue (Million) Forecast, by Application 2019 & 2032
- Table 10: Mexico Global Clinical Oncology NGS Market Revenue (Million) Forecast, by Application 2019 & 2032
- Table 11: Global Clinical Oncology NGS Market Revenue Million Forecast, by Country 2019 & 2032
- Table 12: Germany Global Clinical Oncology NGS Market Revenue (Million) Forecast, by Application 2019 & 2032
- Table 13: United Kingdom Global Clinical Oncology NGS Market Revenue (Million) Forecast, by Application 2019 & 2032
- Table 14: France Global Clinical Oncology NGS Market Revenue (Million) Forecast, by Application 2019 & 2032
- Table 15: Italy Global Clinical Oncology NGS Market Revenue (Million) Forecast, by Application 2019 & 2032
- Table 16: Spain Global Clinical Oncology NGS Market Revenue (Million) Forecast, by Application 2019 & 2032
- Table 17: Rest of Europe Global Clinical Oncology NGS Market Revenue (Million) Forecast, by Application 2019 & 2032
- Table 18: Global Clinical Oncology NGS Market Revenue Million Forecast, by Country 2019 & 2032
- Table 19: China Global Clinical Oncology NGS Market Revenue (Million) Forecast, by Application 2019 & 2032
- Table 20: Japan Global Clinical Oncology NGS Market Revenue (Million) Forecast, by Application 2019 & 2032
- Table 21: India Global Clinical Oncology NGS Market Revenue (Million) Forecast, by Application 2019 & 2032
- Table 22: Australia Global Clinical Oncology NGS Market Revenue (Million) Forecast, by Application 2019 & 2032
- Table 23: South Korea Global Clinical Oncology NGS Market Revenue (Million) Forecast, by Application 2019 & 2032
- Table 24: Rest of Asia Pacific Global Clinical Oncology NGS Market Revenue (Million) Forecast, by Application 2019 & 2032
- Table 25: Global Clinical Oncology NGS Market Revenue Million Forecast, by Country 2019 & 2032
- Table 26: GCC Global Clinical Oncology NGS Market Revenue (Million) Forecast, by Application 2019 & 2032
- Table 27: South Africa Global Clinical Oncology NGS Market Revenue (Million) Forecast, by Application 2019 & 2032
- Table 28: Rest of Middle East and Africa Global Clinical Oncology NGS Market Revenue (Million) Forecast, by Application 2019 & 2032
- Table 29: Global Clinical Oncology NGS Market Revenue Million Forecast, by Country 2019 & 2032
- Table 30: Brazil Global Clinical Oncology NGS Market Revenue (Million) Forecast, by Application 2019 & 2032
- Table 31: Argentina Global Clinical Oncology NGS Market Revenue (Million) Forecast, by Application 2019 & 2032
- Table 32: Rest of South America Global Clinical Oncology NGS Market Revenue (Million) Forecast, by Application 2019 & 2032
- Table 33: Global Clinical Oncology NGS Market Revenue Million Forecast, by Technology 2019 & 2032
- Table 34: Global Clinical Oncology NGS Market Revenue Million Forecast, by Workflow 2019 & 2032
- Table 35: Global Clinical Oncology NGS Market Revenue Million Forecast, by Application 2019 & 2032
- Table 36: Global Clinical Oncology NGS Market Revenue Million Forecast, by End-use 2019 & 2032
- Table 37: Global Clinical Oncology NGS Market Revenue Million Forecast, by Country 2019 & 2032
- Table 38: United States Global Clinical Oncology NGS Market Revenue (Million) Forecast, by Application 2019 & 2032
- Table 39: Canada Global Clinical Oncology NGS Market Revenue (Million) Forecast, by Application 2019 & 2032
- Table 40: Mexico Global Clinical Oncology NGS Market Revenue (Million) Forecast, by Application 2019 & 2032
- Table 41: Global Clinical Oncology NGS Market Revenue Million Forecast, by Technology 2019 & 2032
- Table 42: Global Clinical Oncology NGS Market Revenue Million Forecast, by Workflow 2019 & 2032
- Table 43: Global Clinical Oncology NGS Market Revenue Million Forecast, by Application 2019 & 2032
- Table 44: Global Clinical Oncology NGS Market Revenue Million Forecast, by End-use 2019 & 2032
- Table 45: Global Clinical Oncology NGS Market Revenue Million Forecast, by Country 2019 & 2032
- Table 46: Germany Global Clinical Oncology NGS Market Revenue (Million) Forecast, by Application 2019 & 2032
- Table 47: United Kingdom Global Clinical Oncology NGS Market Revenue (Million) Forecast, by Application 2019 & 2032
- Table 48: France Global Clinical Oncology NGS Market Revenue (Million) Forecast, by Application 2019 & 2032
- Table 49: Italy Global Clinical Oncology NGS Market Revenue (Million) Forecast, by Application 2019 & 2032
- Table 50: Spain Global Clinical Oncology NGS Market Revenue (Million) Forecast, by Application 2019 & 2032
- Table 51: Rest of Europe Global Clinical Oncology NGS Market Revenue (Million) Forecast, by Application 2019 & 2032
- Table 52: Global Clinical Oncology NGS Market Revenue Million Forecast, by Technology 2019 & 2032
- Table 53: Global Clinical Oncology NGS Market Revenue Million Forecast, by Workflow 2019 & 2032
- Table 54: Global Clinical Oncology NGS Market Revenue Million Forecast, by Application 2019 & 2032
- Table 55: Global Clinical Oncology NGS Market Revenue Million Forecast, by End-use 2019 & 2032
- Table 56: Global Clinical Oncology NGS Market Revenue Million Forecast, by Country 2019 & 2032
- Table 57: China Global Clinical Oncology NGS Market Revenue (Million) Forecast, by Application 2019 & 2032
- Table 58: Japan Global Clinical Oncology NGS Market Revenue (Million) Forecast, by Application 2019 & 2032
- Table 59: India Global Clinical Oncology NGS Market Revenue (Million) Forecast, by Application 2019 & 2032
- Table 60: Australia Global Clinical Oncology NGS Market Revenue (Million) Forecast, by Application 2019 & 2032
- Table 61: South Korea Global Clinical Oncology NGS Market Revenue (Million) Forecast, by Application 2019 & 2032
- Table 62: Rest of Asia Pacific Global Clinical Oncology NGS Market Revenue (Million) Forecast, by Application 2019 & 2032
- Table 63: Global Clinical Oncology NGS Market Revenue Million Forecast, by Technology 2019 & 2032
- Table 64: Global Clinical Oncology NGS Market Revenue Million Forecast, by Workflow 2019 & 2032
- Table 65: Global Clinical Oncology NGS Market Revenue Million Forecast, by Application 2019 & 2032
- Table 66: Global Clinical Oncology NGS Market Revenue Million Forecast, by End-use 2019 & 2032
- Table 67: Global Clinical Oncology NGS Market Revenue Million Forecast, by Country 2019 & 2032
- Table 68: GCC Global Clinical Oncology NGS Market Revenue (Million) Forecast, by Application 2019 & 2032
- Table 69: South Africa Global Clinical Oncology NGS Market Revenue (Million) Forecast, by Application 2019 & 2032
- Table 70: Rest of Middle East and Africa Global Clinical Oncology NGS Market Revenue (Million) Forecast, by Application 2019 & 2032
- Table 71: Global Clinical Oncology NGS Market Revenue Million Forecast, by Technology 2019 & 2032
- Table 72: Global Clinical Oncology NGS Market Revenue Million Forecast, by Workflow 2019 & 2032
- Table 73: Global Clinical Oncology NGS Market Revenue Million Forecast, by Application 2019 & 2032
- Table 74: Global Clinical Oncology NGS Market Revenue Million Forecast, by End-use 2019 & 2032
- Table 75: Global Clinical Oncology NGS Market Revenue Million Forecast, by Country 2019 & 2032
- Table 76: Brazil Global Clinical Oncology NGS Market Revenue (Million) Forecast, by Application 2019 & 2032
- Table 77: Argentina Global Clinical Oncology NGS Market Revenue (Million) Forecast, by Application 2019 & 2032
- Table 78: Rest of South America Global Clinical Oncology NGS Market Revenue (Million) Forecast, by Application 2019 & 2032
Frequently Asked Questions
1. What is the projected Compound Annual Growth Rate (CAGR) of the Global Clinical Oncology NGS Market?
The projected CAGR is approximately 16.90%.
2. Which companies are prominent players in the Global Clinical Oncology NGS Market?
Key companies in the market include Eurofins Scientific S E, Pacific Bioscience, Oxford Nanopore Technologies Ltd, Exact Science, F Hoffmann-La Roche Ltd, Partek Inc, Qiagen N V *List Not Exhaustive, Foundation Medicine, Myriad Genetics, Illumina Inc, Caris Life Sciences, Thermo Fisher Scientific, Agilent Technologies, Perkin Elmer, Beijing Genomics Institute (BGI).
3. What are the main segments of the Global Clinical Oncology NGS Market?
The market segments include Technology, Workflow, Application, End-use.
4. Can you provide details about the market size?
The market size is estimated to be USD XX Million as of 2022.
5. What are some drivers contributing to market growth?
Advancements in the Field of Personalized Medicine; Rising Burden of Cancer; Decrease in Costs for Genetic Sequencing.
6. What are the notable trends driving market growth?
Whole Genome Sequencing is Expected to Projected Significant Growth Over the Forecast Period..
7. Are there any restraints impacting market growth?
Lack of computational efficiency for data management; Inadequate Reimbursement Policy.
8. Can you provide examples of recent developments in the market?
N/A
9. What pricing options are available for accessing the report?
Pricing options include single-user, multi-user, and enterprise licenses priced at USD 4750, USD 5250, and USD 8750 respectively.
10. Is the market size provided in terms of value or volume?
The market size is provided in terms of value, measured in Million.
11. Are there any specific market keywords associated with the report?
Yes, the market keyword associated with the report is "Global Clinical Oncology NGS Market," which aids in identifying and referencing the specific market segment covered.
12. How do I determine which pricing option suits my needs best?
The pricing options vary based on user requirements and access needs. Individual users may opt for single-user licenses, while businesses requiring broader access may choose multi-user or enterprise licenses for cost-effective access to the report.
13. Are there any additional resources or data provided in the Global Clinical Oncology NGS Market report?
While the report offers comprehensive insights, it's advisable to review the specific contents or supplementary materials provided to ascertain if additional resources or data are available.
14. How can I stay updated on further developments or reports in the Global Clinical Oncology NGS Market?
To stay informed about further developments, trends, and reports in the Global Clinical Oncology NGS Market, consider subscribing to industry newsletters, following relevant companies and organizations, or regularly checking reputable industry news sources and publications.
Methodology
Step 1 - Identification of Relevant Samples Size from Population Database


Step 2 - Approaches for Defining Global Market Size (Value, Volume* & Price*)

Note*: In applicable scenarios
Step 3 - Data Sources
Primary Research
- Web Analytics
- Survey Reports
- Research Institute
- Latest Research Reports
- Opinion Leaders
Secondary Research
- Annual Reports
- White Paper
- Latest Press Release
- Industry Association
- Paid Database
- Investor Presentations

Step 4 - Data Triangulation
Involves using different sources of information in order to increase the validity of a study
These sources are likely to be stakeholders in a program - participants, other researchers, program staff, other community members, and so on.
Then we put all data in single framework & apply various statistical tools to find out the dynamic on the market.
During the analysis stage, feedback from the stakeholder groups would be compared to determine areas of agreement as well as areas of divergence


